

The Uplift Blog
GrowthBook 5.1: Learn faster with a new MCP server, Slack app, and contextual bandits
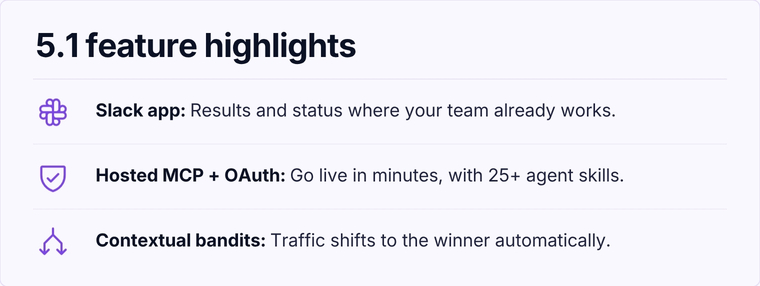
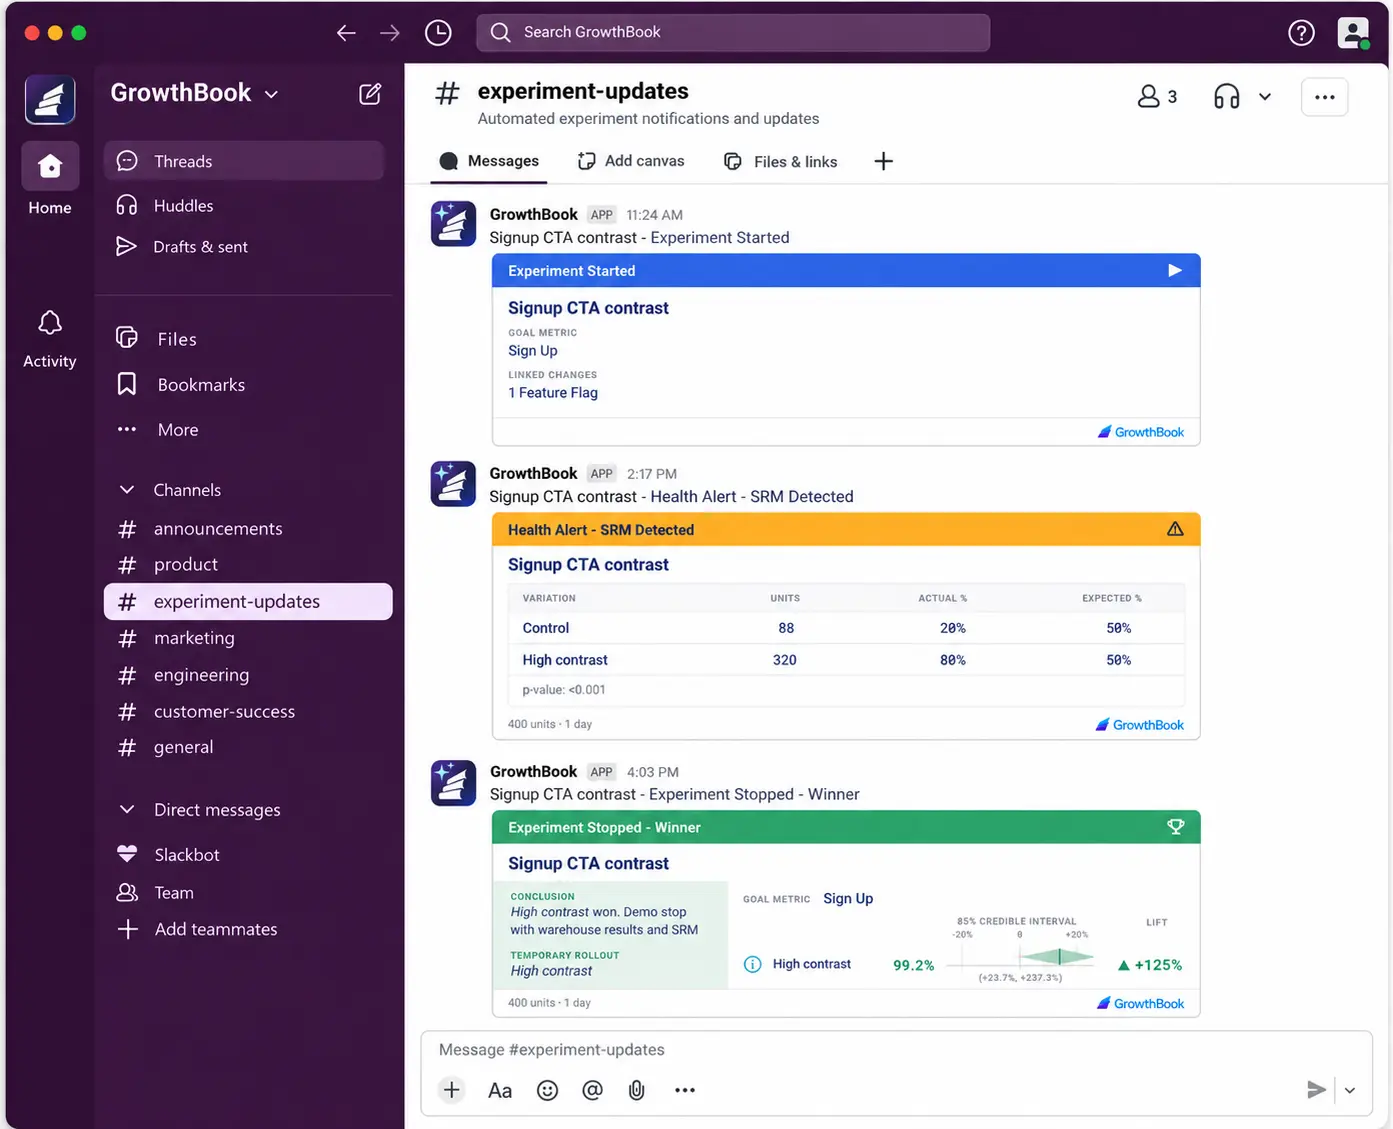
MCP server, Slack app, and contextual bandits

Filter results
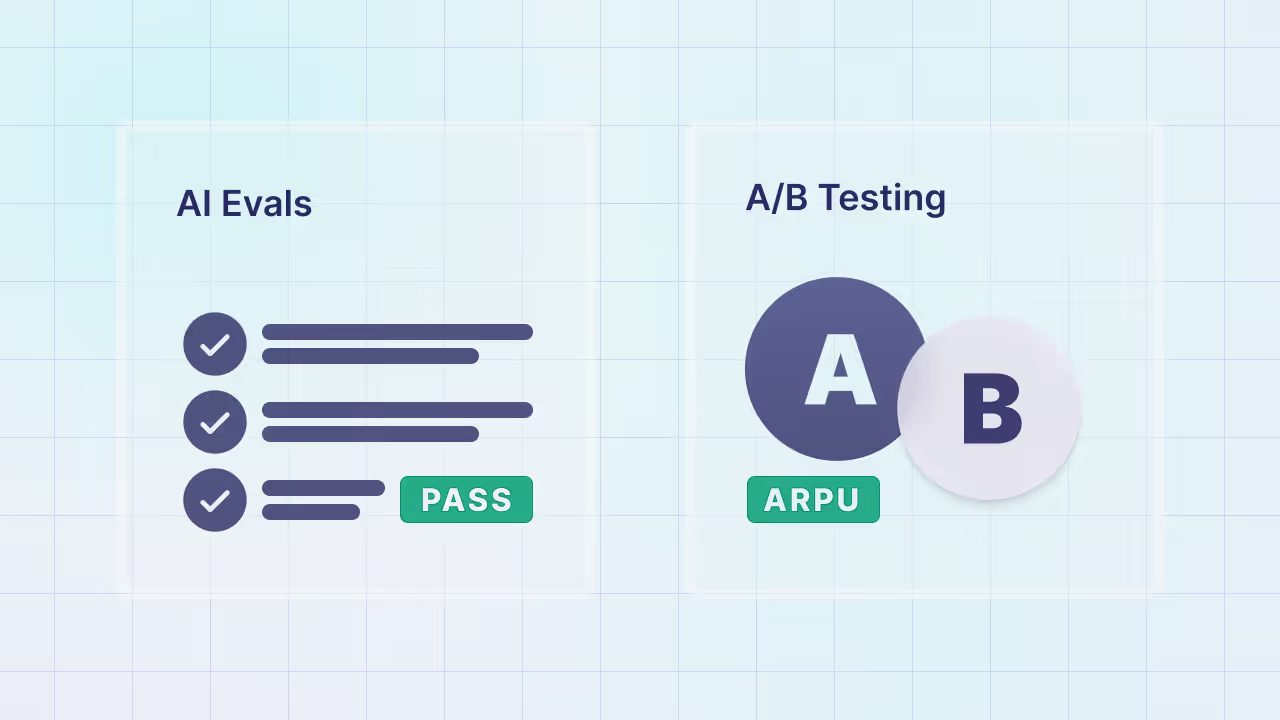
AI evals vs. A/B testing: why you need both to ship GenAI
Most teams building with GenAI are flying blind. They've replaced unit tests with vibes and shipped prompts that "felt right" to three engineers on a Friday afternoon.
This isn't a criticism—it's a diagnosis. For decades, we operated under a deterministic paradigm. The contract between developer and machine was explicit: Input A + Code = Output B. Always, without fail. In this world, success was binary. A unit test passed or it failed.
Generative AI has shattered this contract. We have moved from deterministic engineering to probabilistic engineering. We are no longer building binaries; we are managing stochastic agents that produce a distribution of probable outputs. You cannot assert(x == y) when x and y can change every time.
Gian Segato (Anthropic) eloquently sums up this shift: “We are no longer guaranteed what x is going to be, and we're no longer certain about the output y either, because it's now drawn from a distribution…. Stop for a moment to realize what this means. When building on top of this technology, our products can now succeed in ways we’ve never even imagined, and fail in ways we never intended” (Building AI Products In The Probabilistic Era).
As seismic as this shift may be, we’re focusing on a single aspect of it here: the shift from the domain of verification (is it correct?) to the domain of validation (is it good?).
This shift has left teams scrambling to define quality. Many have fallen into the trap of thinking AI Evaluations (Evals) are a replacement for A/B testing. They aren't.
And, for those in a hurry, here’s the point:
- AI Evals check for competence—can the model do the job?
- A/B testing checks for value—do users care?
You cannot ship a good AI product without both AI Evals and A/B testing.
The limits of vibe checking
In the early days of the LLM boom, “Prompt Engineering” was largely a feeling-based art. Devs would tweak a prompt, run it three times, read the output, and decide if it “felt” better.
This manual inspection, vibe checking, leverages human intuition, which is great for nuance but terrible for scale.
Vibe checking suffers from three critical flaws:
- Sample size: You might test 5 inputs. Production brings 50k edge cases.
- Regression invisibility: Making a prompt “polite” might accidentally break its ability to output valid JSON. You won’t feel that until the API breaks.
- Subjectivity: One engineer’s “concise” is another’s “curt.”
As ML Systems Researcher, Shreya Shankar notes, “You can’t vibe check your way to understanding what’s going on.” Manual inspection is mathematically insufficient for understanding probabilistic systems at scale.
To solve this, the industry turned to AI Evals.
💡 For an excellent intro to AI Evals, check out Shreya Shankar and Hamal Husain on Lenny’s Podcast.
What are AI evals?
AI evaluations are an attempt to systematize the vibe check — turning qualitative judgment into quantitative metrics. They're a way to programmatically test the probabilistic parts of your application: prompts, models, and parameters.
But the term "Eval" is overloaded. When someone says "we're running evals," they might mean any of three things.
3 types of AI evals and why they matter
Model evals
Model evals are benchmarks like MMLU or HumanEval. They're useful for choosing a provider (GPT-5 vs. Claude Opus 4.5), but they tell you almost nothing about your specific application. A model might ace GSM8K (math reasoning) and still be a terrible customer service agent. Worse, these public benchmarks are increasingly contaminated—models have seen the test questions during training, inflating scores that don't transfer to novel problems. (We wrote a whole article about why “The Benchmarks Are Lying To You.”)
System evals
System evals are what matter most. These test your end-to-end pipeline: prompt + RAG retrieval + model. The key metrics here are things like hallucination rate, faithfulness (does the answer stick to the retrieved context?), and relevance.
Many teams now use LLM-as-Judge — a strong model grading outputs on subjective criteria like tone, helpfulness, and coherence. It scales better than human review, but inherits the same limitation: it measures whether an answer seems good, not whether users act on it.
Guardrails
Guardrails are real-time safety checks—toxicity filters, PII detection, jailbreak prevention. Important, but a different concern than quality.
All three share a critical constraint: they measure competence, not value. Whether you run evals offline in your CI/CD pipeline against a curated "Golden Dataset," or online against live traffic in shadow mode, you're still asking the same question: Can this model do the job?
Some evals do capture preference — human ratings, side-by-side comparisons, thumbs up/down. But these are still proxies. A user clicking "thumbs up" in a sandbox isn't the same as a user returning to your product tomorrow. Evals measure stated preference; A/B tests measure revealed preference through behavior.
What evals can't tell you is whether users will care enough to stick around.
Where evals fall short
Even within the realm of evals, a model that looks good in controlled conditions can fall apart in production.
The DoorDash engineering team documented this problem in detail. They built a new ad-ranking model that performed well in testing—but when deployed to real users, its accuracy dropped by 4.3%. The culprit? Their test data was too clean. The model had been trained under the assumption that it would always have fresh, up-to-date information about users. But in the real world, that data was often hours or days old due to system delays. The model had been optimized for conditions that didn't exist in production.
This principle applies even more to LLM applications. LLMs are sensitive to prompt phrasing, context length, and retrieval quality—all of which behave differently in production than in curated test sets.
Consider a concrete example: you optimize a customer service prompt for faithfulness—it sticks strictly to your knowledge base and never hallucinates. Evals look great. But in production, users find the responses robotic and impersonal. Satisfaction drops. You optimized for accuracy; they wanted empathy.
This is the core limitation of evals: they measure capability, not value. Even when you run evals against live traffic, you're testing whether the model can do something—not whether that something matters to users.
Why you should use A/B testing with your AI evals
If evals are the unit test, A/B testing is the integration test with reality. It’s the only way to measure what actually matters: downstream business impact like retention, revenue, conversion, engagement, and user satisfaction.
But running A/B tests on LLMs introduces challenges that didn't exist in traditional web experimentation. (For an introduction to the topic, see our practical guide to A/B testing AI.)
Challenges of running A/B tests on AI
The latency confound
Intelligence usually costs speed. If you test a fast, simple model against a smart, slow one and the variant loses — why? Was the answer worse or did users just hate waiting three seconds?
Isolating "intelligence" as a variable often requires artificial latency injection: intentionally slowing the control to match the variant. Only then can you measure what you think you're measuring.
High variance
LLMs are non-deterministic. Two users in the same variant might see meaningfully different responses. This noise demands larger sample sizes and longer test durations to reach statistical significance.
A button-color test might reach significance in a few thousand sessions. An LLM prompt test — where output variance is high and effect sizes are often small — might need 10x that, or weeks of runtime, to detect a meaningful difference.
Choosing the right metric
Choosing the right metric is harder for AI features than for traditional UI changes. A chatbot might increase engagement (users ask more questions) while decreasing efficiency (they take longer to get answers). Align your success metric with actual business value, not just surface activity.
These realities create a tension. A/B testing AI gives you certainty, but certainty takes time. If you have twenty prompts to evaluate, a traditional A/B test could take months. And during those months, a significant portion of your users are experiencing inferior variants.
Enter multi-armed bandits
For prompt optimization, where iterations are cheap and the cost of a suboptimal variant is low, multi-armed bandits offer a different trade-off. Instead of fixed traffic allocation, they dynamically shift users toward winning variants as data accumulates. You sacrifice some statistical rigor for speed and reduced regret.
🎰 Check out our deep-dive on how they work in GrowthBook.
Comparing A/B testing to multi-armed bandits
Bandits aren't a replacement for A/B testing. They're a complement — best suited for rapid iteration loops where you're optimizing within a validated direction, not making major strategic bets.
How to use AI evals and A/B testing together
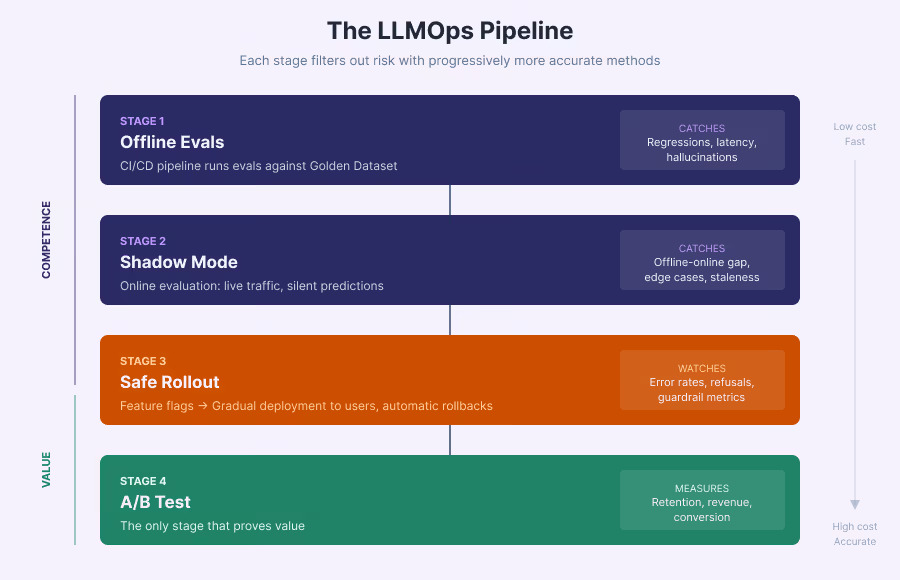
At GrowthBook, we see the highest-performing teams treating evals and experimentation not as separate islands, but as a continuous pipeline—each stage filtering out risk with progressively more expensive (but more accurate) methods.
Using AI evals and A/B testing together in practice
Stage 1: the offline filter (CI/CD)
A developer creates a new prompt branch. The CI/CD pipeline automatically runs evals against the Golden Dataset. If faithfulness drops below 90% or latency exceeds the threshold, the build fails. Bad ideas die here, costing pennies in API credits rather than user trust.
Stage 2: shadow mode (production, silent)
The prompt passes offline evals and gets deployed—but users never see it. The new model processes live traffic silently, logging predictions without surfacing them.
This is an online evaluation: you're still measuring competence (latency, accuracy, edge case handling), but now against real-world conditions. DoorDash's 4% accuracy gap between testing and production is exactly the kind of discrepancy shadow mode is designed to surface—before users experience the degraded results.
Stage 3: safe rollout
Shadow mode passes. Feature flags gradually release the new model to users. You're monitoring guardrail metrics: error rates, refusal spikes, support tickets. If something tanks, you flip the flag and revert instantly—no code rollback required.
🦺 Use GrowthBook's Safe Rollouts to monitor guardrail metrics and rollback automatically.
Stage 4: the A/B test (causal proof)
The rollout survives. Now you run the real experiment: new model vs. baseline, measured on business metrics. Not "faithfulness" but retention. Not "relevance" but conversion. This is the only stage that proves value.
Conclusion: AI evals plus A/B testing for GenAI
You cannot A/B test a broken model. It’s reckless. And you cannot Eval your way to product-market fit. It’s guesswork.
To ship generative AI that's both safe and profitable, you need both: rigorous evals to ensure competence, and robust A/B testing to prove value. The pipeline between them—shadow mode, safe rollouts—is how you get from one to the other without breaking things.
As Segato warned, our products can now fail in ways we never intended. This pipeline is how we catch those failures before users do.
We've moved from is it correct? to is it good? Evals answer the first question. A/B tests answer the second. You need both.
Frequently asked questions
Can AI Evals replace A/B testing?
No. AI Evals and A/B testing serve different purposes in the development lifecycle. Evals measure competence—accuracy, safety, tone—whether run offline or online. A/B testing measures business value through revealed user behavior: retention, revenue, conversion. Evals tell you the model works; A/B tests tell you it's worth shipping.
What is the difference between Offline and Online Evaluation?
Offline evaluation happens pre-deployment using a static Golden Dataset to check for regressions and quality. Online evaluation happens in production using live traffic (e.g., shadow mode). Both measure competence, but online evaluation catches issues—like feature staleness or latency spikes—that don't appear in controlled conditions.
How do you handle latency when A/B testing LLMs?
Latency is a major confounding variable because "smarter" models are often slower. If a slower model performs worse, it's unclear if users disliked the answer or the wait time. To fix this, engineers use Artificial Latency Injection—intentionally slowing down the control group to match the variant's response time, isolating "intelligence" as the single variable.
What is "Vibe Checking" in AI development?
"Vibe checking" is the informal process of manually inspecting a few model outputs to see if they "feel" right. While useful for early exploration, it is unscalable and statistically flawed for production systems because it fails to account for edge cases, regressions, or large-scale user preferences.
When should I use a Multi-Armed Bandit instead of an A/B test?
Use a Multi-Armed Bandit when your goal is optimization (maximizing reward) rather than knowledge (statistical significance). MABs are ideal for testing prompt variations or content recommendations because they automatically route traffic to the winning variation, minimizing regret. Use A/B tests for major architectural changes or risky launches where you need certainty.
What is the best way to deploy AI models safely?
Use a staged pipeline. Start with offline evals in CI/CD to catch regressions. Then use shadow mode to test against live traffic silently. Next, use feature flags to release to a small percentage of users while monitoring guardrails. Finally, run a full A/B test to measure business impact. Each stage filters out risk before exposing users to problems.
What is LLM-as-Judge?
LLM-as-Judge is an evaluation technique where a strong model (like GPT-4 or Claude) grades the outputs of your system on subjective criteria such as tone, helpfulness, and coherence. It scales better than human review but shares the same limitation as other evals: it measures whether an answer seems good, not whether users will act on it.
What is the difference between stated and revealed preference in AI evaluation?
Stated preference is what users say they like—thumbs up ratings, side-by-side comparisons in a sandbox. Revealed preference is what users actually do—returning to your product, completing tasks, converting. Evals capture stated preference; A/B tests capture revealed preference. The two often diverge.
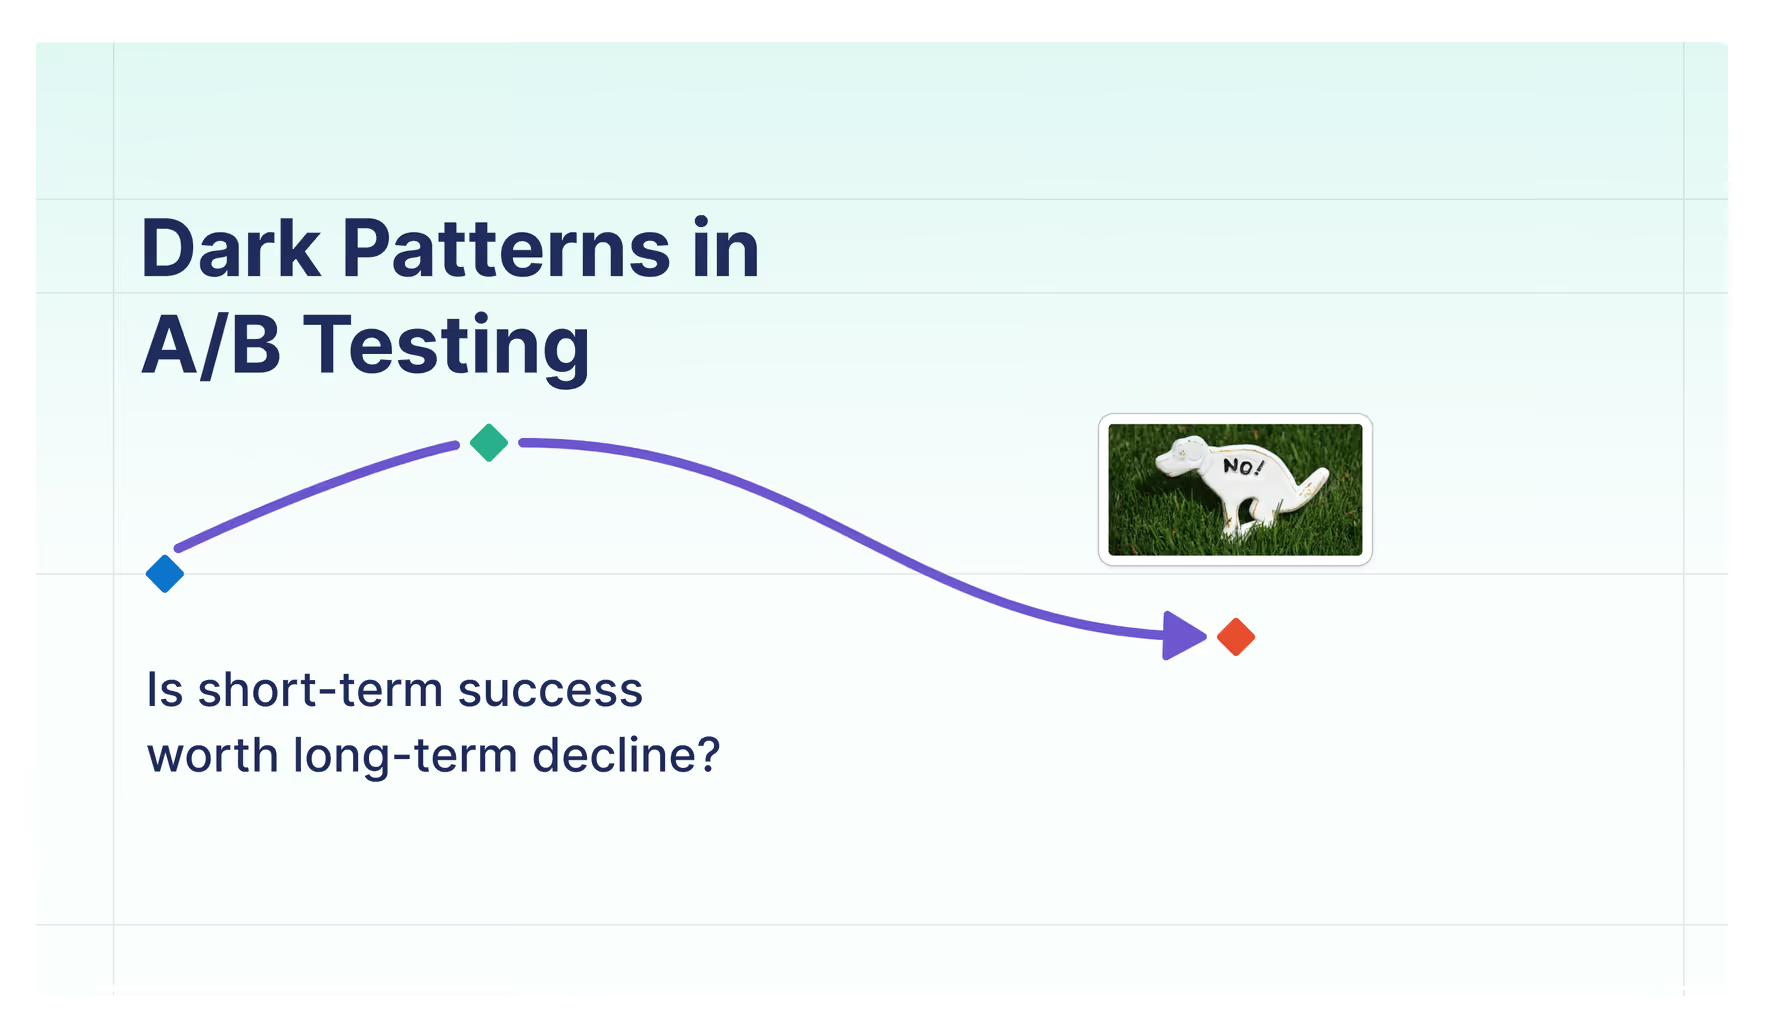
Dark patterns in A/B testing: how short-term optimization leads to product enshittification
Why optimizing for short-term A/B test wins can degrade user trust and product quality. A look at common dark patterns in experimentation, why they “work,” and how better metrics can help teams build products that create real long-term value.
A post supposedly from a software engineer at a meal delivery company went viral recently. It accused the unnamed company of unscrupulously manipulating pricing, fees, and salaries to increase revenue. One of the things they did was to run an A/B test on a “Priority delivery” fee. According to the post, there were no product changes to make delivery faster, but instead, they delayed regular deliveries.
“We actually ran an A/B test last year where we didn't speed up the priority orders, we just purposefully delayed non-priority orders by 5 to 10 minutes to make the Priority ones "feel" faster by comparison. Management loved the results. We generated millions in pure profit just by making the standard service worse, not by making the premium service better.” (Source: Reddit)
While there are some questions about the veracity of this post, such dark patterns in A/B testing and product development are absolutely being done. And this raises an important question about the ethics of using these techniques in experimentation.
What are dark patterns?
Dark patterns are product design or implementation choices that deliberately nudge, coerce, or mislead users into behaviors that primarily benefit the company. They often come at the expense of the user’s understanding or long-term satisfaction.
For a comprehensive taxonomy, see deceptive.design, which catalogs these patterns in detail.
How are dark patterns used in A/B testing?
In the context of A/B testing, dark patterns typically appear when experiments are optimized narrowly for short-term business metrics, such as a conversion rate, without regard for whether the underlying change actually improves the product. Often they are introduced as a response to an organization’s goal metric that fails to capture the complete picture (see Goodhart’s Law and the dangers of metric selection).
Common dark patterns used in experiments
- Artificial degradation: Making a baseline experience worse (for example, slowing delivery times as above or adding friction) so that a paid tier or alternative appears more attractive.
- Obscured choice: Designing UI variants that make it harder to opt out, cancel, or choose a lower-cost option, then validating them via A/B tests that show higher revenue.
- Price obfuscation: Experimenting with fees, surcharges, or defaults in ways that users only discover late in the funnel.
- Emotional manipulation: Leveraging urgency, guilt, or fear (“Only 2 left!”, “People like you choose…”) to drive behavior, then justifying it with statistically significant lifts.
A/B testing itself is not the problem. The problem is using experimentation as a shield: “the data says it works” becomes a way to avoid asking whether the outcome is aligned with user value or long-term trust. It hides the real question of whether we should do this at all.
Short-term wins, long-term costs of unethical experimentation
Dark patterns can look good in the short term. They are engineered to do so. Revenue goes up, conversion improves, and dashboards turn green. These tactics exploit goodwill with your current user base and long-term measurement blind spots, creating lifts that are easy to recognize immediately. The costs, however, tend to be delayed and externalized.
Dark patterns in A/B testing introduce several long-term risks for organizations.
- Reputational risk
Users are not irrational. They may not always articulate why they are unhappy, but they notice when a product feels hostile, manipulative, or nickel-and-dime driven. Trust erodes quietly and then suddenly. When stories like the viral post above surface (whether accurate or not), they resonate precisely because users already suspect this behavior. - Legislative and regulatory risk
Many dark patterns operate in gray areas that are increasingly of interest to regulators. Fee transparency, deceptive defaults, and coercive UX are now explicitly called out in regulations in multiple jurisdictions (see the EU’s Digital Services Act (DSA) and the California Privacy Rights Act (CPRA)). An A/B test that boosts revenue today can become legal exposure tomorrow, complete with internal documentation showing intent. - Internal and cultural risk
Engineers, designers, and PMs generally want to build products that help people. When teams are repeatedly asked to ship features that intentionally worsen user experience, morale suffers. The best people notice. Over time, this can lead to disengagement or attrition, especially among senior contributors who have other options. - Risk from competition
Applying dark patterns that don’t improve the product opens the door, in the long term, for competitors to build a better product and put your company at risk.
In other words, dark patterns trade long-term value for short-term gains.
Practical solutions to avoid dark patterns in experimentation
There are some practical ways to help reduce these risks and avoid the enshittification of products. Chief among these are adopting value principles and establishing ethics committees.
Value principles, like Google’s “Don’t be evil”, are frequently treated as aspirational marketing artifacts rather than operational constraints. Many tend to be vague or non-actionable and open to interpretation, which provides no meaningful protection against dark patterns. Finally, even if they are actionable and adopted as policy, they can come into tension with other incentives at the company, such as bonuses or career progression. Google, after all, ditched “Don’t be evil” in 2018.
Ethics committees are used at some larger companies to ensure consistent application of company values. However, they can face the same issues as the values above, particularly if the company is facing financial pressure; the ethics team can be high on the list of cuts.
The most practical way to avoid dark patterns is not an ethics committee or a vague principle statement; it is using the right metrics.
If you only measure immediate revenue or conversion, you will eventually design experiments that extract value rather than create it. To counteract this, teams need to deliberately include metrics that reflect longer-term outcomes.
Example experimentation metrics to use to avoid dark pattern behavior
- Retention
- Repeat usage
- Complaint rates
- Refunds
- Customer support contacts
- Brand sentiment
- Qualitative feedback
Not all of these can be perfectly measured- or measured at all (like the likelihood or cost of losing key employees). In the real world, the data will never be perfect. Good product judgment will still be required, as there will always be uncertainty. An experiment that produces a short-term lift but could be seen to damage trust should be treated with skepticism, even if the lift is excellent.
When experimentation leads to a better product
Ultimately, the goal of experimentation is not to prove that you can move a number. It is to learn how to make something people genuinely want. A/B testing is a powerful tool in the service of that goal, but the further you drift from it, the more your “wins” become signals of underlying enshittification rather than progress. Make sure your metrics reflect your real goals as much as possible.
In the long run, the most effective optimization strategy remains the simplest: make the product better.

The Best A/B Testing Platforms of 2026: Features, Comparisons, and Expert Recommendations
Imagine making every product decision with data, powered by the best A/B testing platforms of 2026. These tools have become essential for businesses hungry to innovate faster and build with confidence. This new generation of tools prioritizes performance, flexibility, and organization-wide applicability, ushering in a paradigm known as experimentation-driven development. No longer confined to marketing departments, A/B testing is now a cornerstone for entire product teams.
In this guide, we’ll explore key platforms, focusing on their strengths, limitations, and suitability for different needs. By the end, you’ll have a clearer understanding of which platform is right for your organization.
Modern A/B testing platforms: innovating for today's needs
GrowthBook: experimentation-driven development at its best
We built GrowthBook to be the tool we always wished we had—one that balances developer-friendly workflows with robust experimentation capabilities. We excel in flexibility, scalability, and developer-friendly features, and we seamlessly integrate feature flagging and A/B testing to deliver unmatched usability and precision. Picture your team quickly toggling features while running precise experiments—all within a platform that feels like it was designed just for developers. Here's where GrowthBook is unique:
- Warehouse-native integration: GrowthBook integrates directly with your existing data warehouse, ensuring low-latency experiment evaluations and reliable metrics.
- Open-source and self-hosting options: Ideal for industries with stringent compliance and data sovereignty requirements, like fintech and healthtech, GrowthBook’s open-source nature empowers teams to self-host if needed.
- Developer-first approach: Robust SDKs, CI/CD compatibility, and transparent SQL insights allow engineering and data teams to fine-tune experiments with precision.
- Seamless integration: GrowthBook easily fits into existing workflows, leveraging tools you already use to maximize ROI.
With a focus on unlocking experimentation-driven product development, we're the trusted choice for teams aiming to scale innovation while maintaining performance.
Statsig: all-in-one simplicity with limits
Statsig provides A/B testing, feature flagging, and session recording in a unified platform. While it’s sufficient for teams seeking a simple, all-in-one solution, its statistical methods, while including features like CUPED, may not be as robust as those offered by platforms specifically designed for data scientists. For example, it lacks flexibility in supporting different types of experiments, such as those with very large or very small user bases. The platform’s rising costs, especially when scaling beyond the initial 5 million events included in the Pro plan, make it less appealing. Additionally, its limitations in integrating with data warehouses may not meet the needs of organizations with sophisticated data practices
Datadog Experiments: statistical precision for data-driven teams
Datadog Experiments (formerly Eppo) shines in its statistical depth, offering precise and actionable experiment results. Its warehouse-native architecture aligns with organizations that prioritize high-quality experimentation. However, Datadog Experiments' feature flagging functionality, while supporting core features such as feature gates and rollouts, may not be as comprehensive as some competitors'. For example, it may lack advanced features like user segmentation or real-time monitoring found in more mature platforms. For data-driven organizations primarily focused on experimentation, Datadog Experiments provides an excellent foundation. However, teams seeking a broader feature flagging toolset with more advanced capabilities may need to consider alternatives.
Legacy A/B testing platforms: struggling to keep up
LaunchDarkly: feature management first, experimentation second
LaunchDarkly excels in feature flagging but treats A/B testing as an afterthought. This lack of integration can lead to a clunky user experience, making it less suitable for teams aiming for seamless experimentation workflows.
Optimizely: high costs, fragmented experience
Once a market leader, Optimizely now faces challenges with its high pricing and fragmented user experience. While its A/B testing capabilities remain robust, the platform’s cost makes it viable only for large enterprises. Compared to Optimizely, GrowthBook reduces both cost and complexity.
Adobe Target: limited flexibility in a closed ecosystem
Adobe Target is tightly integrated into Adobe’s ecosystem, making it a logical choice for existing Adobe customers. However, its high costs and lack of flexibility make it less appealing for agile teams seeking modern experimentation workflows. GrowthBook is a clear alternative to Adobe Target, with warehouse-native analytics.
Other A/B testing platforms: niche capabilities
PostHog: lightweight analytics with basic experimentation
PostHog focuses on product analytics and offers basic experimentation features. While its open-core model appeals to startups, the platform’s limited self-hosting capabilities and lightweight experimentation tools make it less suitable for teams with advanced needs. For advanced experimentation and robust feature flags, consider GrowthBook compared to PostHog.
VWO: conversion optimization for marketing teams
VWO is a web experimentation and CRO platform built for marketing teams at SMB companies, with a visual editor and client-side A/B testing as its core offering. It's accessible for non-technical users but becomes limiting quickly — full-stack and server-side experimentation are difficult to operationalize, and pricing makes it up to 5x more expensive than GrowthBook as usage grows. For developer-led product teams, GrowthBook is a more capable alternative to VWO.
AB Tasty: client-side testing for conversion-focused teams
AB Tasty is a conversion optimization platform aimed at marketing teams running A/B and multivariate tests on web and mobile. Feature flagging is not a core capability, there's no warehouse-native option, and pricing is custom with add-ons that increase as requirements grow — making it harder to scale for product and engineering teams. Teams that need full-stack experimentation and robust feature flags will find GrowthBook a stronger alternative to AB Tasty.
Choosing the right A/B testing platform in 2026
When choosing an A/B testing platform, think about what matters most to your organization. Are you looking for scalability, compliance, or seamless integration with your current tools? Matching these priorities with the right platform can make all the difference.
- For advanced experimentation workflows: GrowthBook delivers unmatched flexibility, scalability, and developer-first features.
- For data teams: Datadog Experiments offers statistical rigor and warehouse-native integration but falls short with limited feature flagging capabilities, making it less ideal for teams needing a comprehensive solution.
- For all-in-one solutions: Statsig provides simplicity but may not scale with advanced needs.
- For feature flagging-first teams: LaunchDarkly suffices but lacks depth in experimentation.
- For legacy ecosystem users: Optimizely and Adobe Target remain options, albeit costly and limited in flexibility.
- For marketing and CRO teams: VWO and AB Tasty are accessible for non-technical teams running client-side conversion tests, but both become limiting and expensive as product and engineering requirements grow.
- For lightweight needs: PostHog provides budget-friendly analytics-driven tools for smaller teams.
Conclusion
Innovation thrives on experimentation—it’s how teams transform ideas into measurable success. Choosing the right A/B testing platform can accelerate your ability to iterate, scale, and innovate. GrowthBook’s modular design makes it perfect for organizations aiming to scale. Imagine starting with basic experiments and effortlessly expanding into enterprise-grade workflows—it’s a platform built to evolve with your team’s needs. Whether you’re prioritizing compliance, advanced experimentation, or seamless developer integration, GrowthBook’s strengths make it the clear leader in the 2026 A/B testing platform landscape.
Want to compare more A/B testing platforms?
We've put together a few additional A/B testing platform guides to help you find the right tool for your business:
- Best Warehouse Native A/B Testing Tools
- Best A/B Testing Tools for Developers
- Best A/B Testing tools with Product Analytics
Ready to scale your experiments?
Get started with GrowthBook for free today.

7 steps to better experiment design
A practical checklist for running A/B tests you can trust
From predictive model accuracy at Facebook and experiment design at X (formerly Twitter), to building the best experimentation platform used by Dropbox, Sony and Upstart with GrowthBook, I've spent the last six years shaping how some of the largest tech companies measure success and ship features.
Across companies, industries, and scales, I’ve seen the same pattern repeat: experimentation rarely fails because teams don’t understand A/B testing mechanics. It fails because experiments are poorly designed—unclear goals, misaligned metrics, weak baselines, flawed randomization, or decisions made without a plan for ambiguous results.
The teams that get the most value from experimentation aren’t running more tests. They’re running better ones. They’re deliberate about what they’re trying to learn and disciplined about how results turn into decisions.
This article distills the most reliable experiment design practices I’ve learned from years of work in the field. If you already know how A/B testing works and want results you can trust—and act on—these seven steps are a strong place to start.
(For a deeper technical walkthrough, see GrowthBook’s Experimentation Best Practices)
1. Define the goal clearly
Every experiment should answer a specific question.
Start by writing down the problem you’re trying to solve in plain language. Is it activation? Retention? Conversion efficiency?
A good test of clarity is whether you can write a concrete hypothesis, such as:
“Users who complete the new onboarding flow will reach the activation milestone 10% more often than users in the existing flow.”
Clear goals prevent experiments from drifting into vague “did anything change?” territory.
In practice: Teams at Dropbox use tightly framed hypotheses to avoid shipping changes that move surface-level engagement but fail to improve long-term collaboration or retention.
2. Choose the right success metrics
Once the goal is clear, metrics follow.
Every experiment should have:
- One primary metric that defines success
- A set of secondary metrics for context
- Guardrail metrics to catch unintended harm
Focusing on too many metrics creates confusion. Tracking too few hides important tradeoffs—especially when multiple metrics are evaluated simultaneously (see GrowthBook’s guidance on multiple testing corrections).
Use your secondary metrics to improve your understanding of what drives your primary metric. They also help you check-in periodically with your primary metric, ensuring it is well-defined and driving you towards your business goals.
Teams at Khan Academy use experimentation to iterate on learning experiences while remaining deeply thoughtful about how success is measured in an educational context.
3. Know your baseline
You can’t interpret change without knowing where you started.
Before launching an experiment:
- Understand current performance
- Measure normal variance
- Calibrate expectations for realistic lift
A change from 4% to 5% conversion is only meaningful if you know how stable 4% really is.
In practice: One GrowthBook customer—a large European marketplace—moved away from before-and-after analysis after realizing they couldn’t separate real lift from seasonality. Establishing proper baselines made results interpretable and decisions easier.
4. Understand leading vs. lagging indicators
Not all metrics respond at the same speed.
- Leading indicators provide fast feedback and are often better suited for short-term experiments.
- Lagging indicators validate long-term impact and strategic alignment.
High-performing teams use both, but they’re intentional about which metric actually determines success.
Optimizing only for lagging indicators slows learning. Ignoring them risks local optimization.
5. Define the experiment population and randomization strategy
Decide who should be included in the experiment—and exclude everyone else.
Best practices include:
- Randomizing users as close to the experience as possible
- Ensuring assignment persists across sessions
- Using a true control group
- Keeping designs simple when traffic is limited
If you don’t have enough users, avoid multi-variant tests.
In practice: One GrowthBook customer, a major European retailer, was running underpowered tests. They moved from partial traffic to testing on 100% of visitors—dramatically reducing time to confidence and revealing insights that challenged long-held assumptions.
If you’re using feature flags to control exposure, GrowthBook’s approach to running experiments with feature flags is designed specifically for this kind of setup.
6. Validate your setup before you trust results
You can’t analyze what you can’t connect.
Before launching real experiments, confirm that:
- Exposure data joins cleanly with outcome data
- Identifiers are consistent
- Metrics are computed correctly
Then run an A/A test—two identical variants with no visible change.
In practice: Teams operating at scale use A/A tests to catch instrumentation and analysis issues early. If multiple uncorrelated metrics “win” in a no-change test, or multiple A/A tests fail with clear issues, something is broken. GrowthBook strongly recommends this as a validation step (A/A testing documentation).
7. Decide how long to run the experiment
Ending experiments early increases false positives. Letting them run forever slows learning.
Plan duration in advance based on:
- Expected variance
- Minimum detectable effect
- Available traffic
If you need flexibility, approaches like sequential testing can help—but only if you understand the tradeoffs.
Bonus: plan for all outcomes
Only 10–30% of experiments produce a clear winner. That’s normal.
High-performing teams plan for this reality before launching:
- Low-cost features may ship on directional evidence
- High-cost features require stronger confidence
- Neutral results still generate valuable learning
Experiments aren’t always about maximizing win rates. In some cases, they prevent huge losses. In other cases, their primary value is learning about user behavior.
Final thought
Experimentation isn’t about proving you’re right. It’s about discovering what’s true.
Every experiment—even a neutral one—teaches you something about your users and your assumptions. Teams that stay curious, document learnings, and iterate deliberately are the ones that compound results over time.
That’s what turns experimentation into a real competitive advantage.
FAQ: experimentation & A/B testing in practice
How do you decide whether an A/B test result is actionable?
When the results all point to the same decision, even when accounting for uncertainty. If you would ship even if the results were at the bottom end of the confidence intervals and you've collected a reasonable amount of data, ship!
Why are so many A/B test results inconclusive?
Because most product changes simply don’t meaningfully change behavior. Neutral results often reveal what users don’t care about, guiding better future experiments.
How long should an experiment run?
Long enough to reach sufficient statistical power—not until a metric looks good.
When should you ship a result that isn’t statistically significant?
For low-risk, low-cost changes with stable guardrails. High-risk features need stronger confidence.
What’s the biggest mistake teams make with experimentation?
Treating experimentation as validation instead of learning.

Announcing GrowthBook 4.2: product analytics & experimentation at scale
At GrowthBook, our mission is to provide the insights you need to build better products that grow your business faster. With GrowthBook 4.2, we’ve added a beta version of GrowthBook Product Analytics. Now our users will have a single integrated platform for feature management, experimentation, and product analytics.
In addition, we’ve continued to enhance the developer experience, making experimentation at scale and integration into any stack easier than ever. Finally, for companies seeking an alternative to Statsig, our Statsig to GrowthBook Migration Kit automates importing feature gates and dynamic configs while replacing Statsig SDKs with GrowthBook SDKs.
Release 4.2 is available immediately to both our cloud and self-hosted users. Visit our Pricing page for details about Starter, Pro, and Enterprise options.
GrowthBook product analytics (beta)
Adding Product Analytics to the GrowthBook platform closes the loop for development. Now, you can go from feature management to experimentation to product analytics in a single tool. While in beta, Product Analytics will be available to all users.
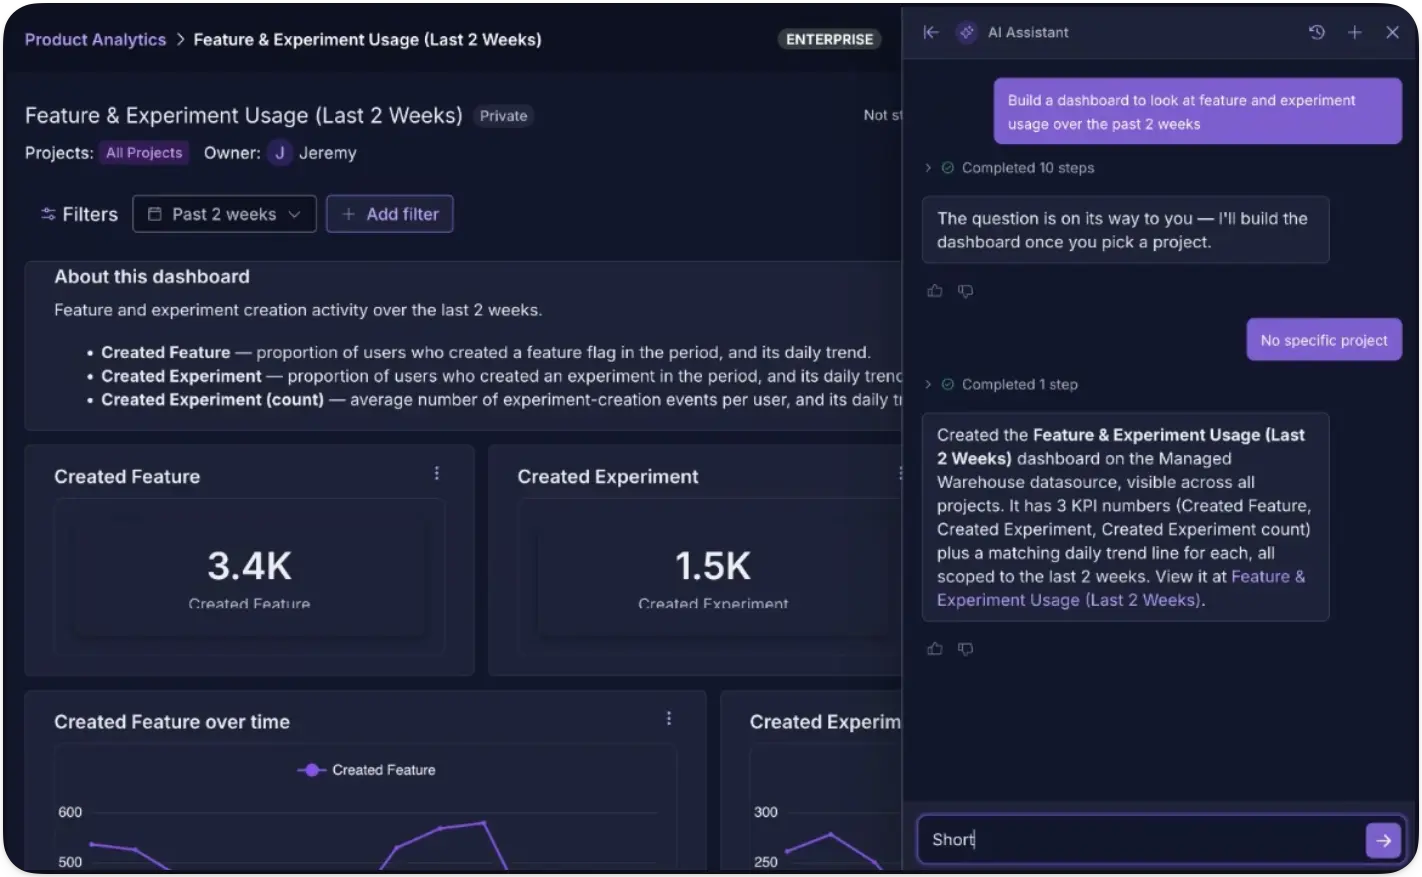
Turn your warehouse data and metrics into actionable product insights. Explore user behavior, share dashboards, and make smarter decisions about what to build next. With Product Analytics, you will be able to:
- Build and share dashboards that combine graphs, pivot tables, and text
- Create custom charts and tables from any data in your warehouse
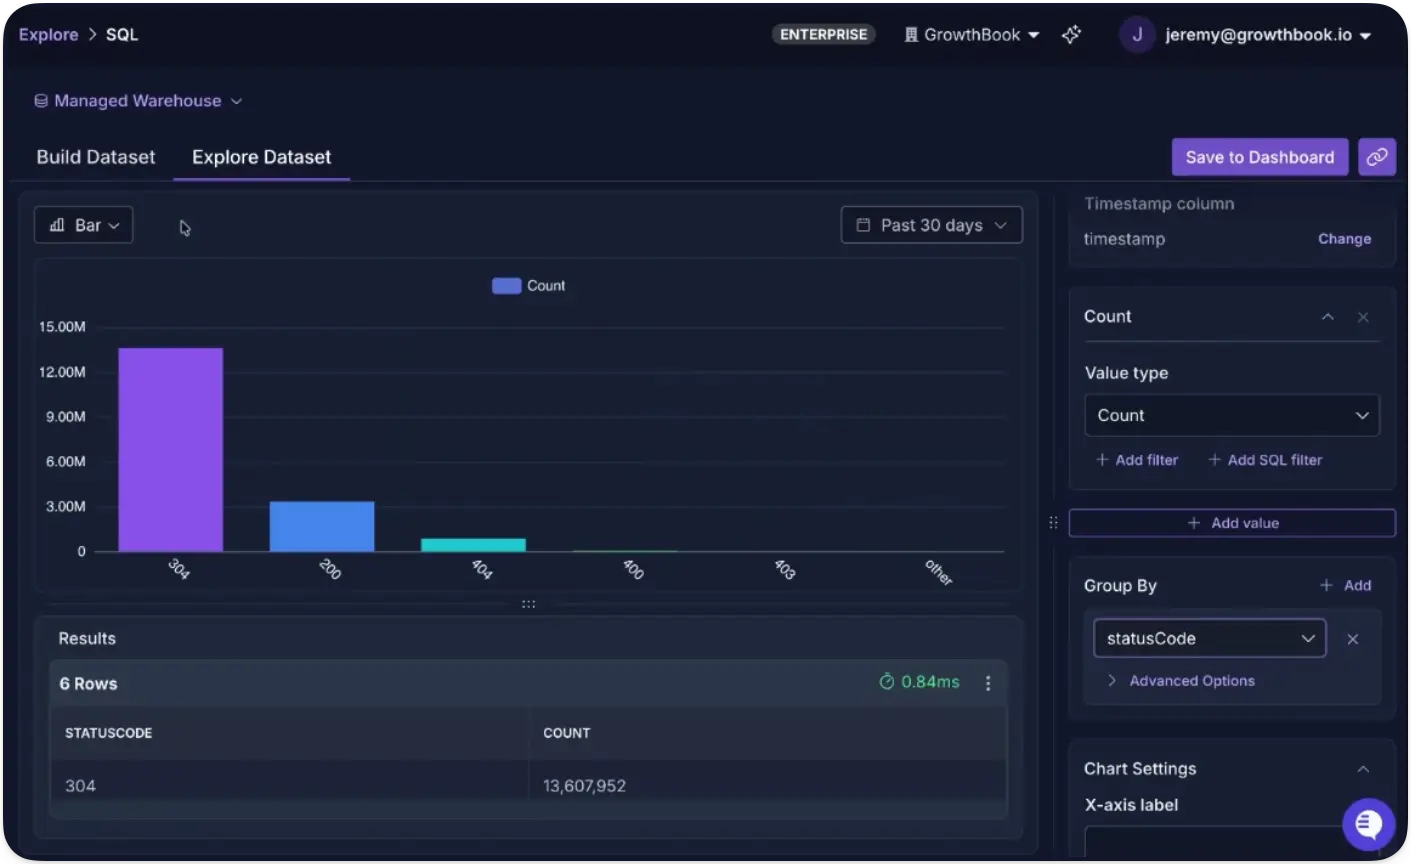
- Use GrowthBook SQL Explorer with our AI-powered text-to-SQL capabilities to query, aggregate, and group data
- Access any metric defined in GrowthBook and track its performance over time
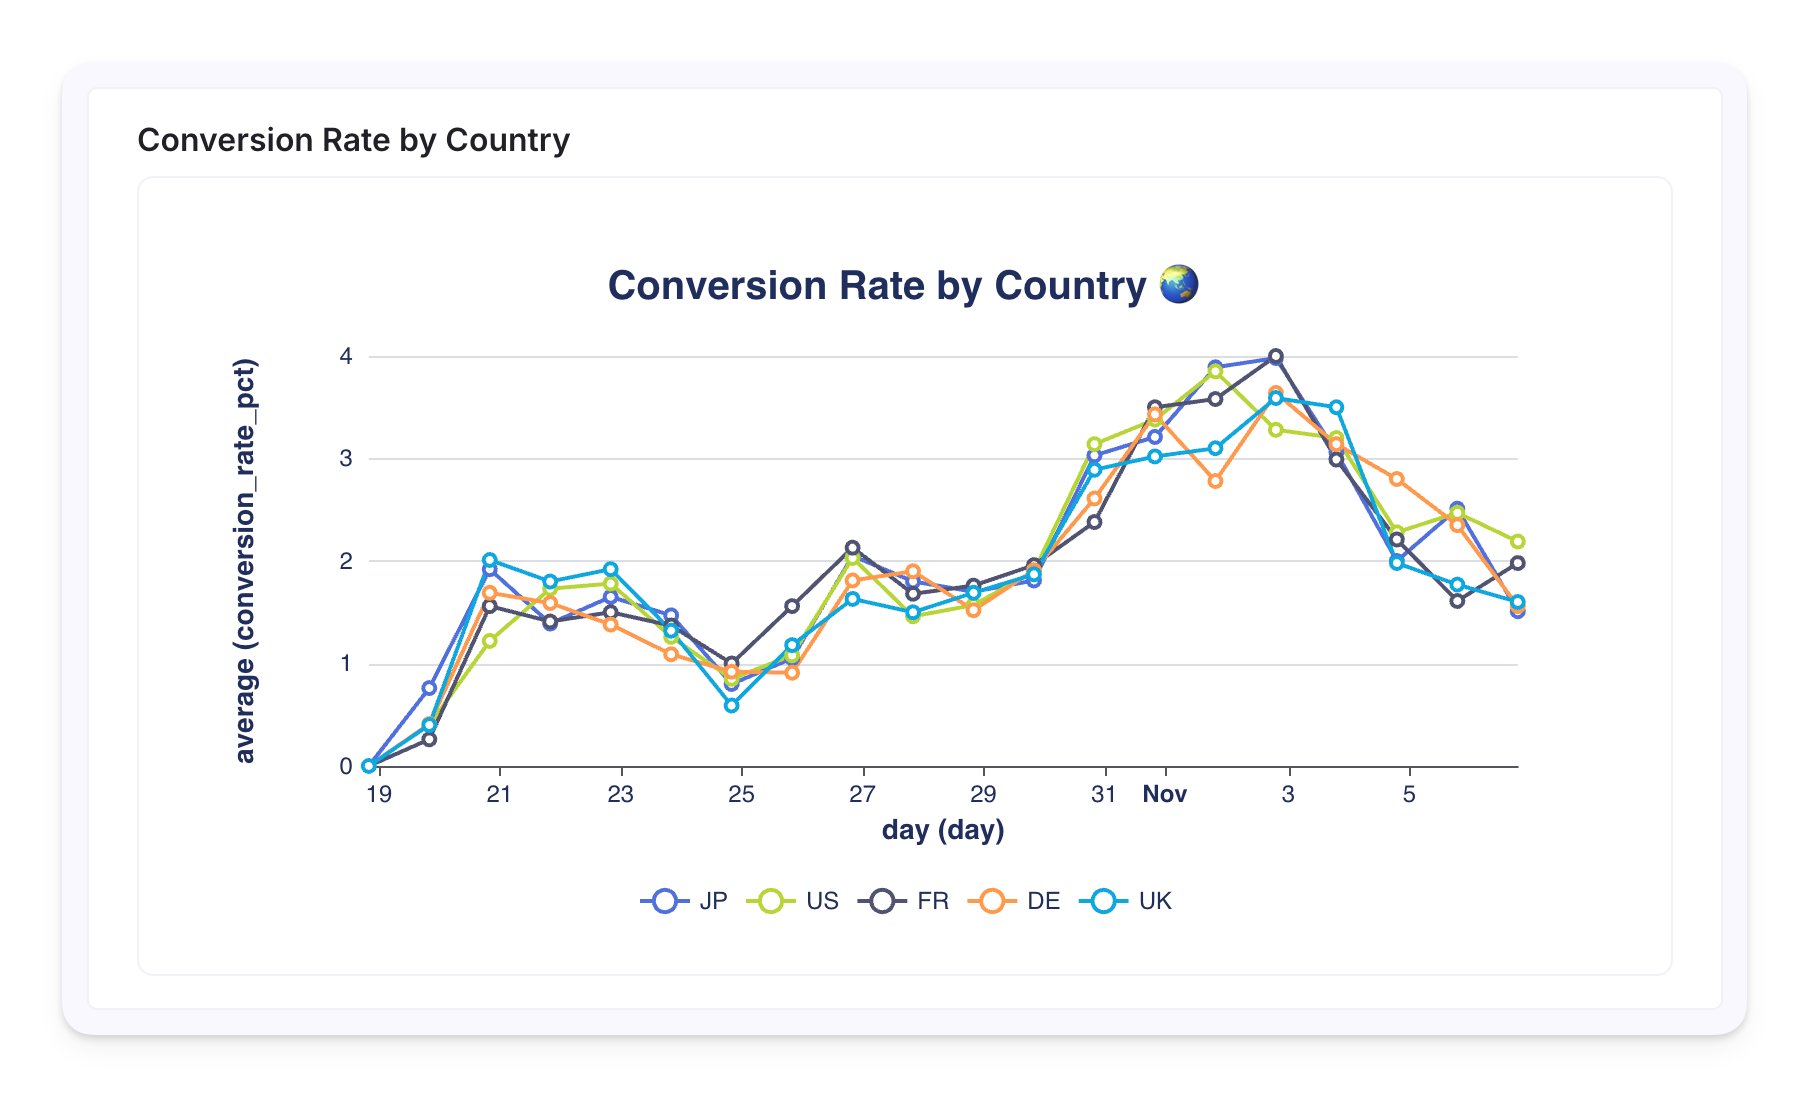
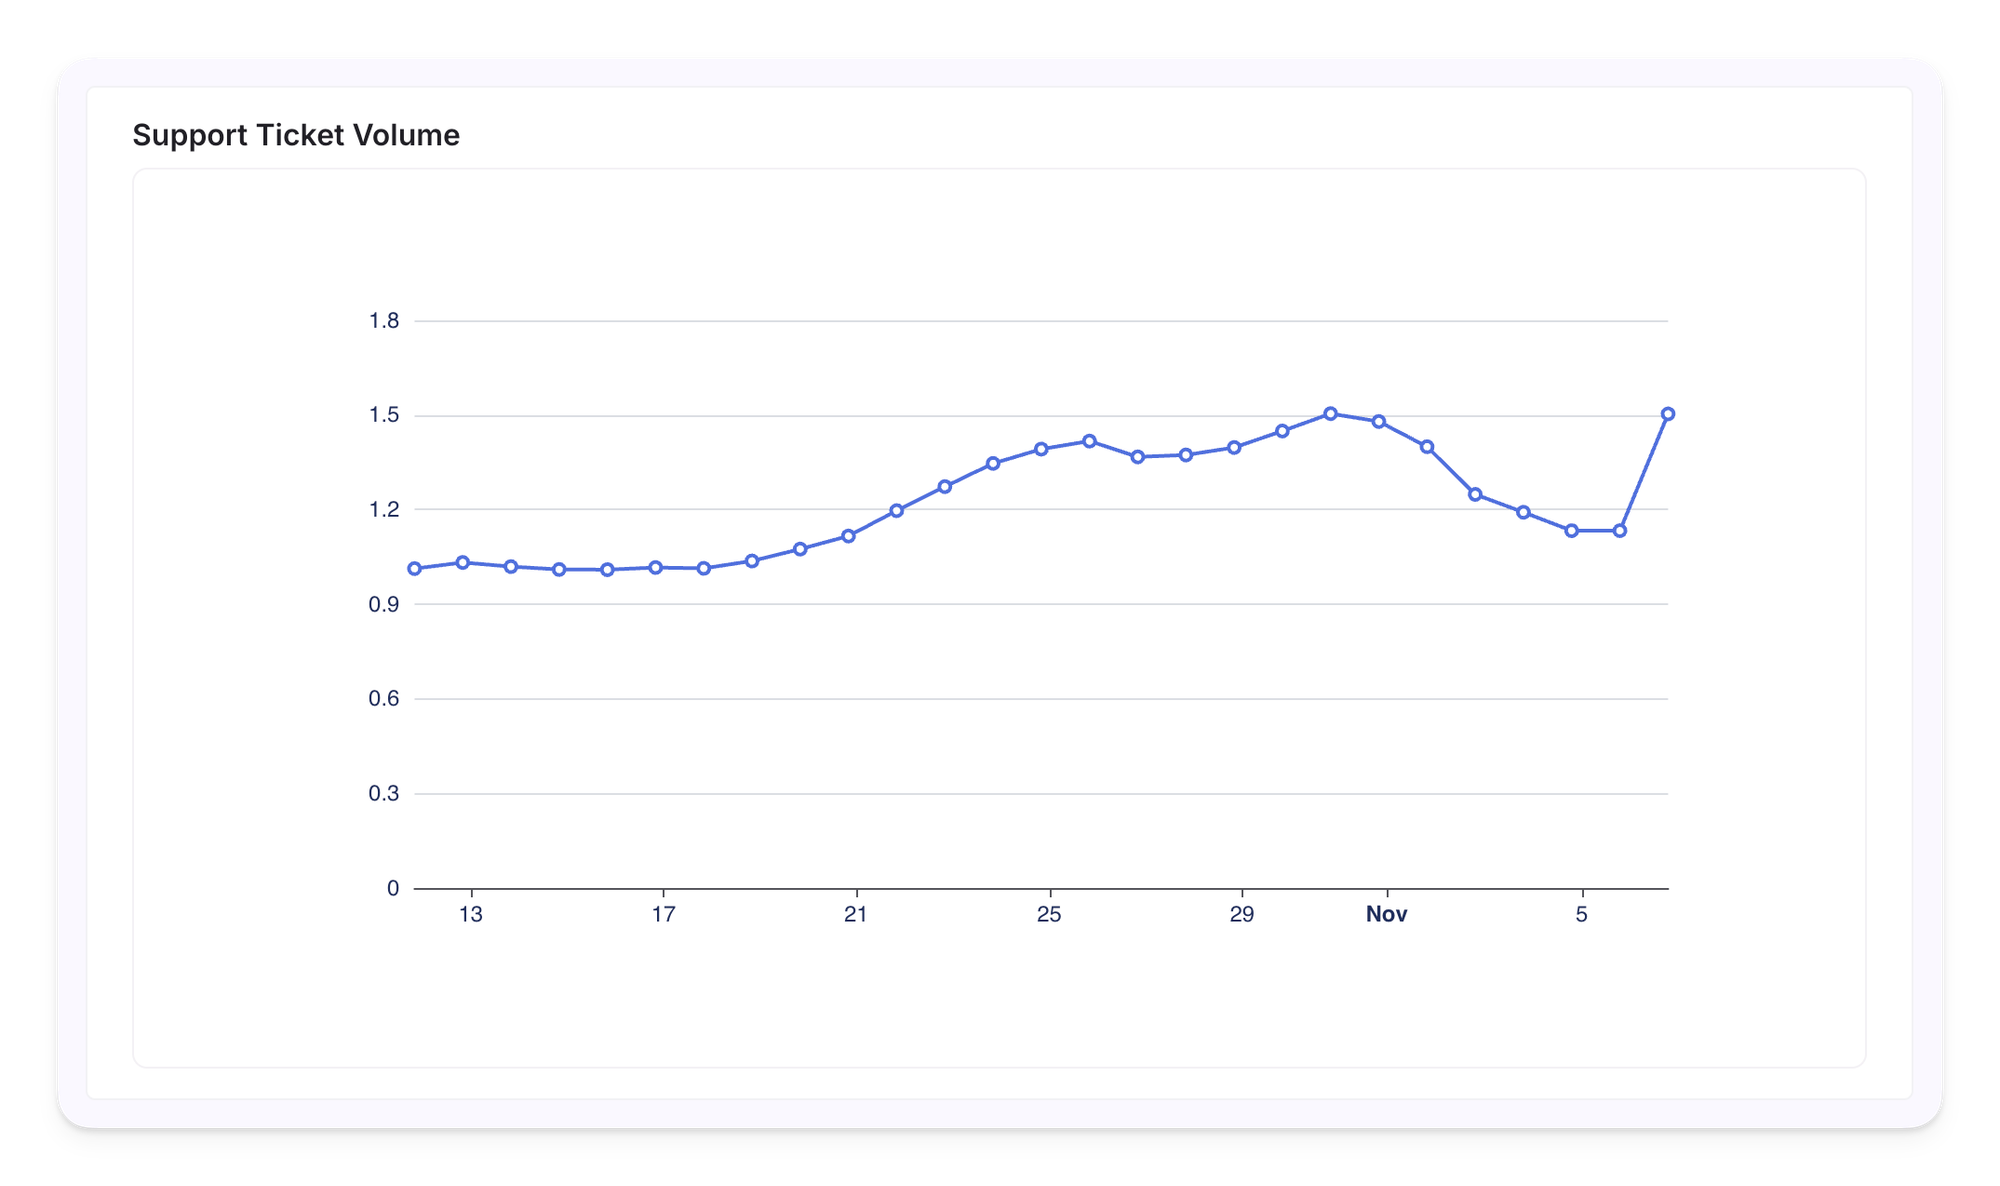
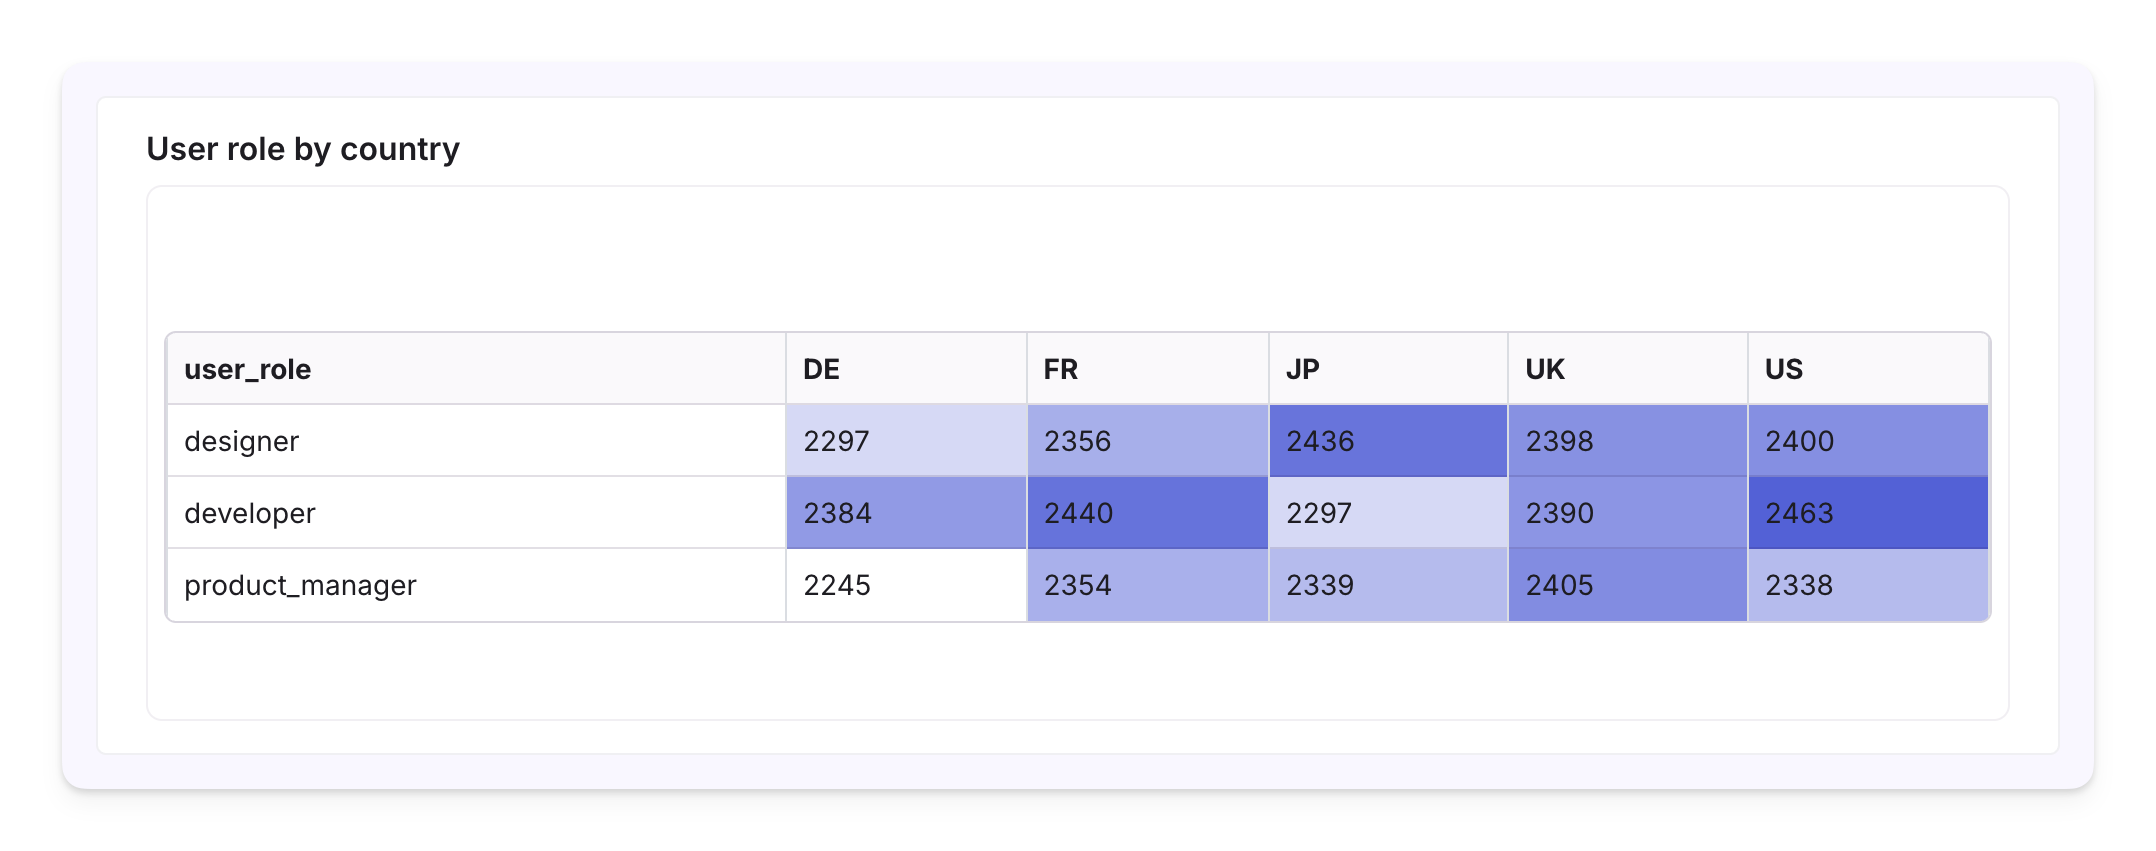
This Product Analytics beta provides a glimpse of what’s to come as GrowthBook develops more self-service tools for building, analyzing, and exploring all of your product data. Let us know what you think in our Slack community!
Statsig to GrowthBook migration kit
With the OpenAI acquisition of Statsig, we saw a spike in interest in GrowthBook. Product teams looking for alternatives expressed concern about what would happen to their data. Others worried that the product might be discontinued or deprioritized. To make the transition from the acquired platform to an open-source alternative as effortless as possible, we created the Statsig to GrowthBook Migration Kit, free for all users.
- Statsig Importer instantly copies over feature gates, dynamic configs, and segments.
- Statsig Code Migration Tool (powered by Claude Code) automatically replaces Statsig SDKs with GrowthBook SDKs.
Enterprise enhancements
The 4.2 features below continue our investment in the developer experience that makes GrowthBook a top choice for product development teams with high volume apps and advanced experimentation programs.
Metric slices: simplify experiment design
When users create experiments, they often want to look at a number of metrics across common dimensions like product categories or device types. This can lead to the need to manage a number of metrics. Metric slices solves this problem. Enable auto slices on a Fact Metric once, and GrowthBook automatically generates drill-down analyses for each dimension value across all experiments using that metric.
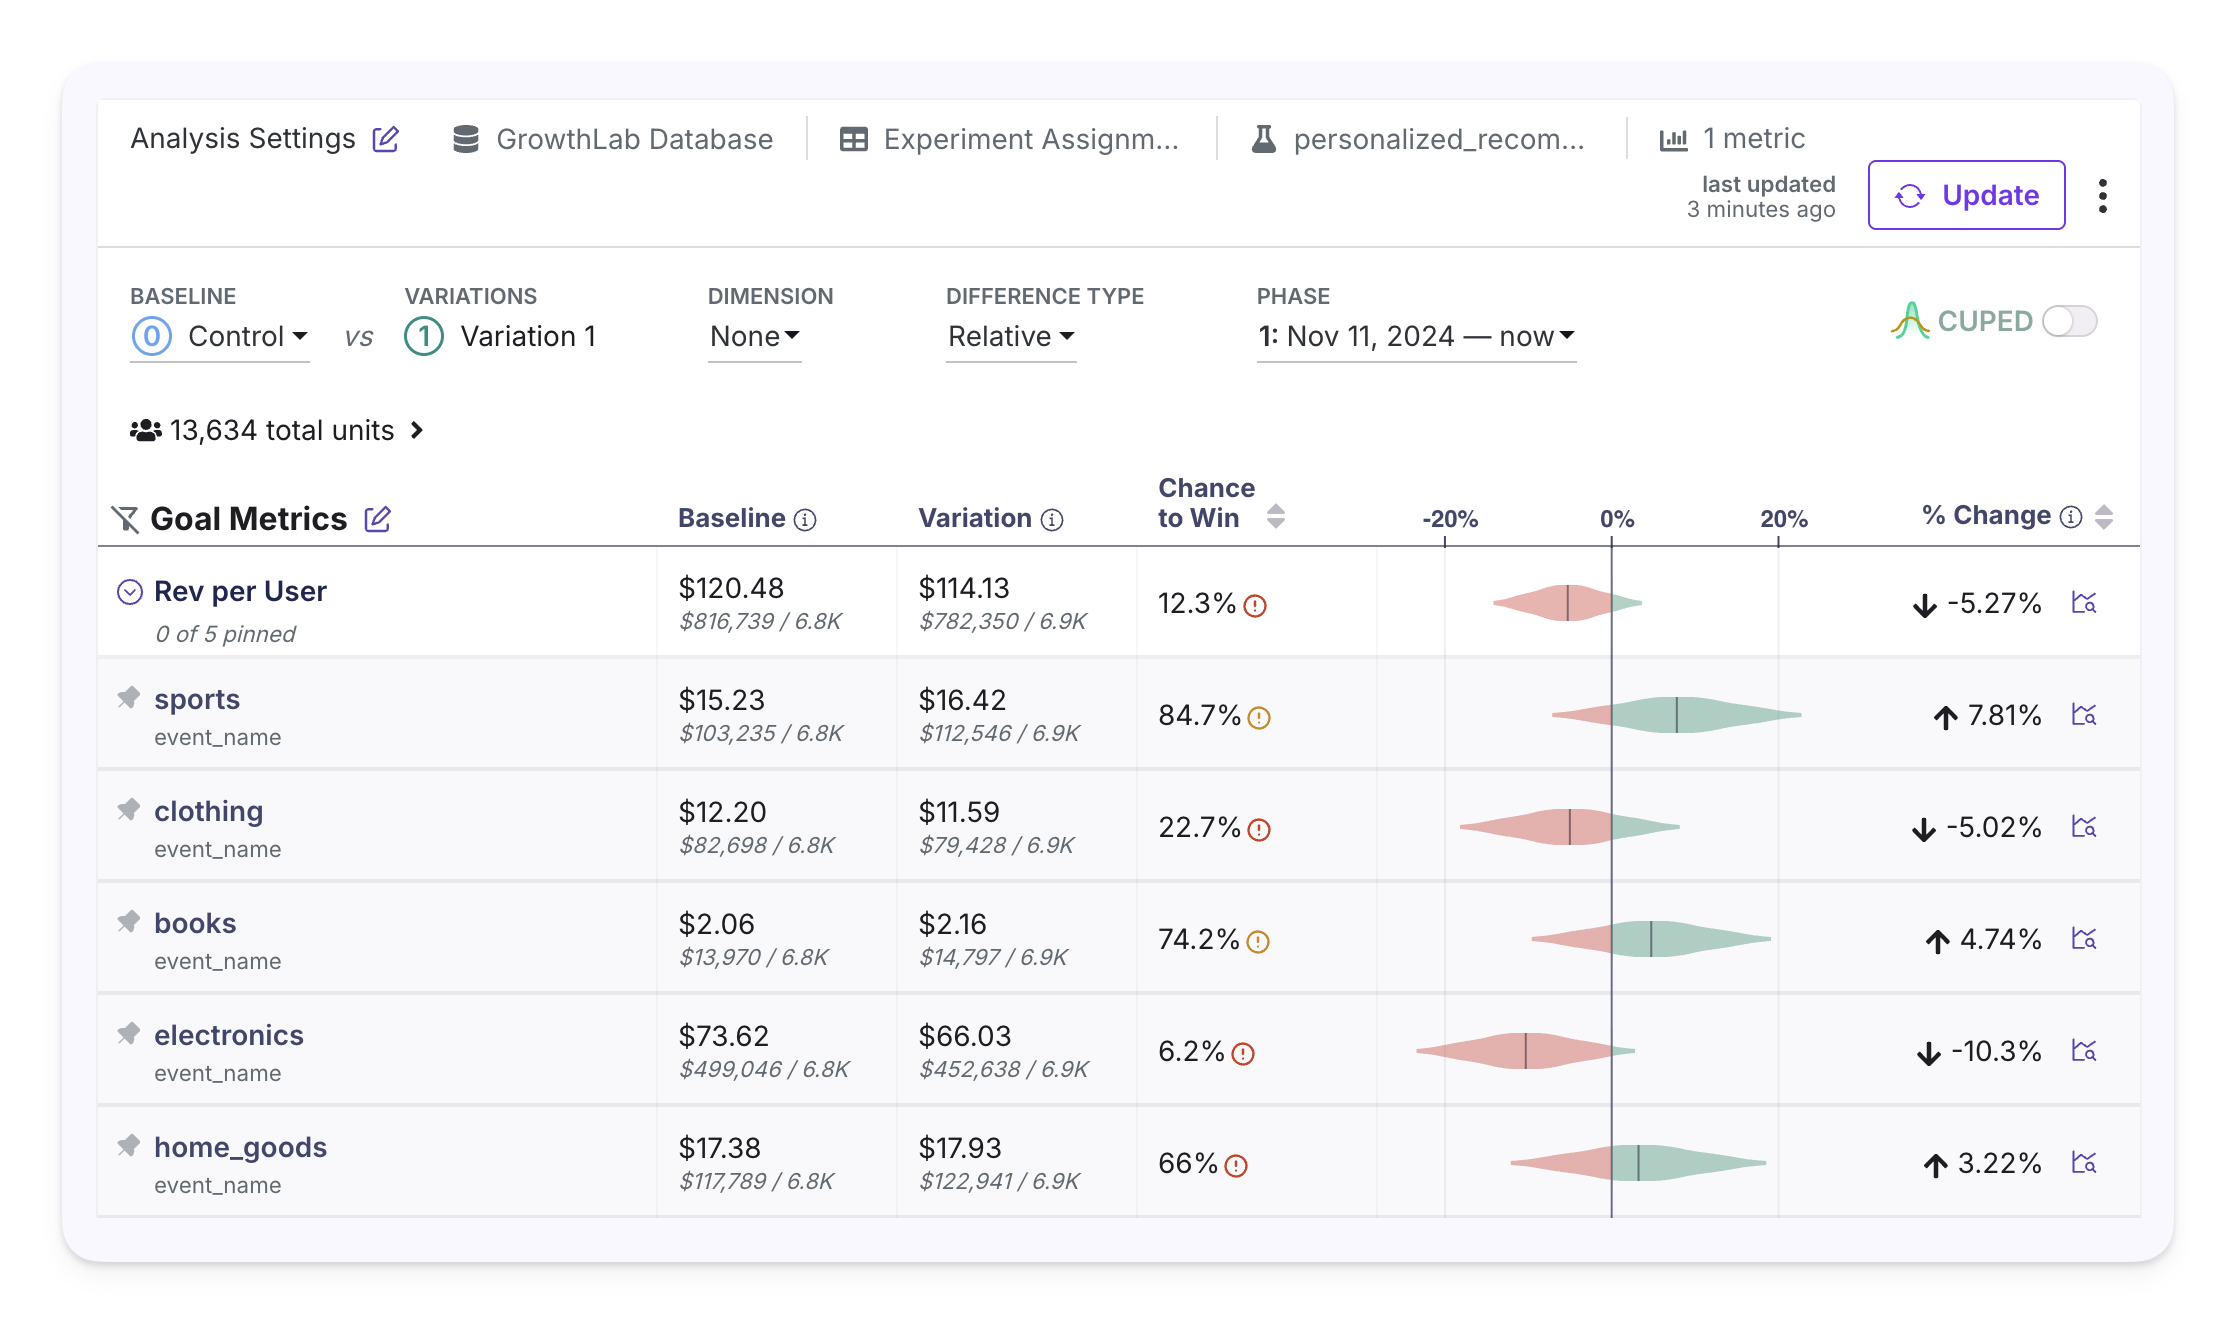
Instead of creating separate “Orders” metrics for each product category or device type, you can enable Auto Slices on those columns with a single metric which means fewer redundant metrics, faster setup, and cleaner reporting.
Incremental refresh
We revamped our Data Pipeline Mode to lower query costs and improve performance for long-running experiments and high-traffic apps. By storing intermediate results and incrementally refreshing them, we’ve seen users save up to 85% in query costs. This first version is available on BigQuery, Presto, and Trino. We’ll be adding support for more data warehouses based on customer demand.
Official metrics
Many organizations rely on a trusted set of “official” metrics. GrowthBook now makes these easier to manage by letting admins mark and edit official metrics directly from the UI (previously API-only). This helps standardize measurement, reduce confusion, and promote consistency across teams.
New SQL template variables
You can now access custom field values and phase data directly in your metric and experiment SQL, unlocking several use cases:
- Fine-tuned query optimization using non-date partition keys
- Reuse of SQL definitions with minor tweaks per experiment
- More accurate joins between experiment exposure and phase data
Custom validation hooks
GrowthBook has always been flexible — and now it’s even more so. Self-hosted enterprise users can write custom JavaScript validation hooks that run in secure V8 isolates. Use them to:
- Require tags on feature flags
- Prevent targeting rules containing PII
- Enforce naming conventions or internal policies
These hooks let teams automate governance without slowing down development.
Edge remote eval
Edge Remote Eval lets client-side SDKs offload feature flag evaluation to a backend server, preventing targeting logic from leaking to users. Previously, this required managing your own GrowthBook proxy servers. Now, you can deploy a Cloudflare Workers–based Remote Eval server — a fast, low-cost, zero-maintenance alternative built on Cloudflare’s global infrastructure.
Quality-of-life improvements
Big thanks to all of our users who reported bugs, shared feedback, and contributed ideas to this release on GitHub or Slack.
Many small improvements add up to a big boost in usability:
- Faster and more relevant search algorithm for features, metrics, and experiments
- Create feature rules in multiple environments at once
- Better column-type detection for BigQuery Fact Tables
- Add metric row filters based on Boolean columns
- Reduced webhook noise (no more notifications for unpublished drafts)
- Slack and Discord notifications now include more detailed change info
- Custom pre-launch checklist items can be scoped to specific projects
- Faster database schema browsing, even with hundreds of tables
- New setting to disable legacy metrics for smoother transition to Fact Tables
- Sortable experiment results tables — quickly see top or bottom performers
Plus dozens of smaller fixes and performance improvements.
2025: A year of rapid innovation
The 4.2 release is GrowthBook’s sixth major update in 2025, capping off what has easily been the biggest year of innovation in our company’s history. GrowthBook launched over 45 new features across four major themes in 2025:
- Experimentation at Scale: New metrics, templates, dashboards, and analytics
- Feature Management: Safe rollouts and feature analytics
- Artificial Intelligence: A new MCP server and embedded AI capabilities
- Developer Experience: Managed data warehouse, native Vercel integration, 24+ updated SDKs, enhanced server-side rendering, and support for new CMSs and FerretDB
Whether you’re on the Starter plan ready for more advanced experimentation and analytics or a Pro user building a culture of experimentation, we’re ready to help you grow. We’re excited to see what you build — and how you use these new tools to learn faster.

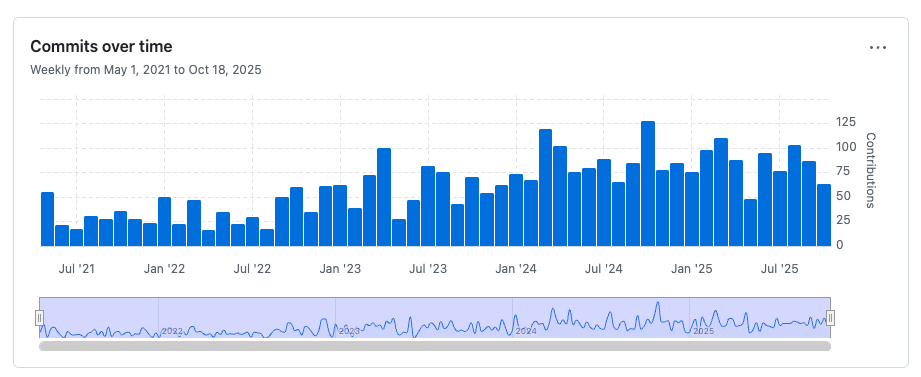
7,000 GitHub stars and counting
Thank you for making GrowthBook the world’s largest open-source experimentation platform
GrowthBook passed 7,000 stars on GitHub this month thanks to you. Your support confirms our commitment to experimentation-led development and open-source transparency. We see you testing every day in the 100 billion+ feature flag lookups we handle, and the thousands of organizations actively using GrowthBook each month.
To celebrate this milestone, let’s look back on how we’ve grown and ahead to where we’re going. Our goal is to help you go faster at scale. Let’s see how we do it.
What’s new with GrowthBook in 2025?
GrowthBook released more than 45 new features in our cloud and self-hosted experimentation platform in 4 key areas: data exploration, developer experience, advanced experimentation, and improving the experiment lifecycle with AI. As an engineering-first company, we believe that experiments should be easy and cheap to run so you can learn constantly.
Better data exploration
What good is an experiment if you can’t easily analyze the results? GrowthBook provides full transparency by exposing the underlying SQL for your experiments. But we know you wanted more ways to explore your data, debug issues, and create custom reports and visualizations without the context switching. Now you can explore your data and build custom dashboards.
Complexity happens fast when it comes to data analysis across teams and departments. Metric slices give everyone flexibility without complexity. For example, instead of separate revenue metrics for each product type, you can use metric slices to automatically generate distinct revenue metrics for each product type (such as “apparel” or “equipment”). Teams benefit from more granular and relevant analysis without duplicating definitions. Everyone stays on the same page.
Accelerating experimentation culture
Why do so many engineering teams build their own experimentation platforms? So they get exactly what they want. GrowthBook helps teams migrate from homegrown to an experimentation culture by giving developers what they want with control. Customizable dashboards and frameworks help more teams run more experiments faster and learn from the results.
That’s why we developed experiment dashboards. Developers, data teams, and product managers create their own custom view to go deep on individual experiments. They get exactly what they need to highlight interesting results, hide the noise, and begin to tell a story with the data that everyone in the organization can understand.
The Experiment Decision Framework helps teams make systematic, consistent decisions about when and how to conclude experiments. GrowthBook’s default modes include “do no harm” and “clear signal” with the option to customize with your own rules so you can iterate quickly.
For developers who want to skip the setup of a data source for our warehouse-native solution, we launched a Managed Warehouse option. Now, your team can go straight to feature management, experimentation, and product analytics without the data connection, cost, and refresh hassles.
Advanced experimentation
The more experiments you run, the more advanced your experimentation program becomes. We believe that so many of you support GrowthBook because of the high bar we set for statistical rigor. We continued that commitment with features for sophisticated metrics, automated decision-making, and comprehensive measurement capabilities for high-frequency testing programs. Measure the long term impact of changes and control outcomes with holdouts, multi-arm bandits, and safe rollouts.
With Insights, GrowthBook’s executive dashboard offers a 10,000-foot view across all of your organization’s experiments to understand what you’ve done and what you’ve learned. Help your team go further, faster by learning from experiments, exploring experiment timelines, and analyzing metric effects and correlations. Filter by project and data range, view by win rate, scaled impact, and velocity.
Improving the experiment lifecycle with AI
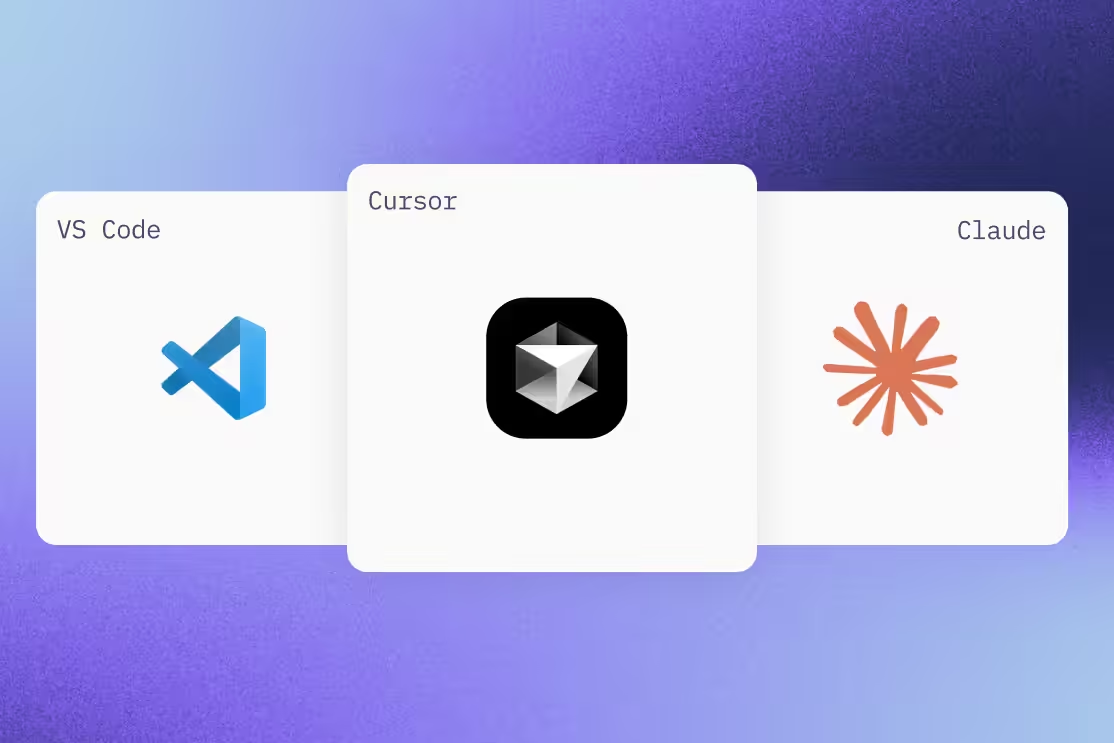
It’s time to talk to your experimentation platform. The MCP server streamlines workflows and enables AI-powered automation and insights within your development environment. Connect to your favorite LLMs to manage feature flags, experiments, and other tasks without switching contexts. The MCP server works with Cursor, Claude, VS Code, and it’s open source.
We’ve also embedded AI into GrowthBook. You can use natural language questions to generate SQL. Your GrowthBook assistant helps you follow best practices by checking hypotheses, summarizing metric descriptions, generating experiment summaries, and comparing past experiments to avoid duplication.
Looking ahead: the future of experimentation at GrowthBook
We continue to be inspired by our GitHub stargazers, Slack community members, and all the experimenters out there, committed to making everything better. As we prepare for the year ahead, we’re looking at a few key themes.
- In this time of consolidation and disruption, data security and governance matter more than ever. Our warehouse-native approach lets you keep your data in-house under your control.
- As AI-generated code becomes more pervasive, experimentation provides an essential check on whether code works and benefits the business.
- Fostering a culture of experimentation does more than draw the signal from the noise. It helps you fail sooner, in the smallest ways possible, so you can accelerate success.
Here's to the next 7,000 stars and beyond! If you haven't already, check out GrowthBook on GitHub—we'd love to see what you experiment with next.
Ready to join the experimentation revolution? Star us on GitHub, join our Slack community, or dive into the code. The future of product development is open, transparent, and data-driven. Let's build it together.

The benchmarks are lying to you: why you should A/B test your AI
Quick takeaways
- Performance varies by domain: Models that ace benchmarks often fail on your specific use case
- The Trade-offs might not be real: Faster, cheaper models might outperform expensive ones for your needs
- The best solution is rarely one model: Most successful deployments use model portfolios
- A/B testing quantifies what matters: User completion rates, costs, and latency—not abstract scores
Introduction
OpenAI's GPT-5 (high) model scores 25% on the Frontier Math benchmark for expert-level mathematics. Claude Opus 4.1 only scores 7%. Based on these numbers alone, you might assume GPT-5 is clearly the superior choice for any application requiring mathematical reasoning.
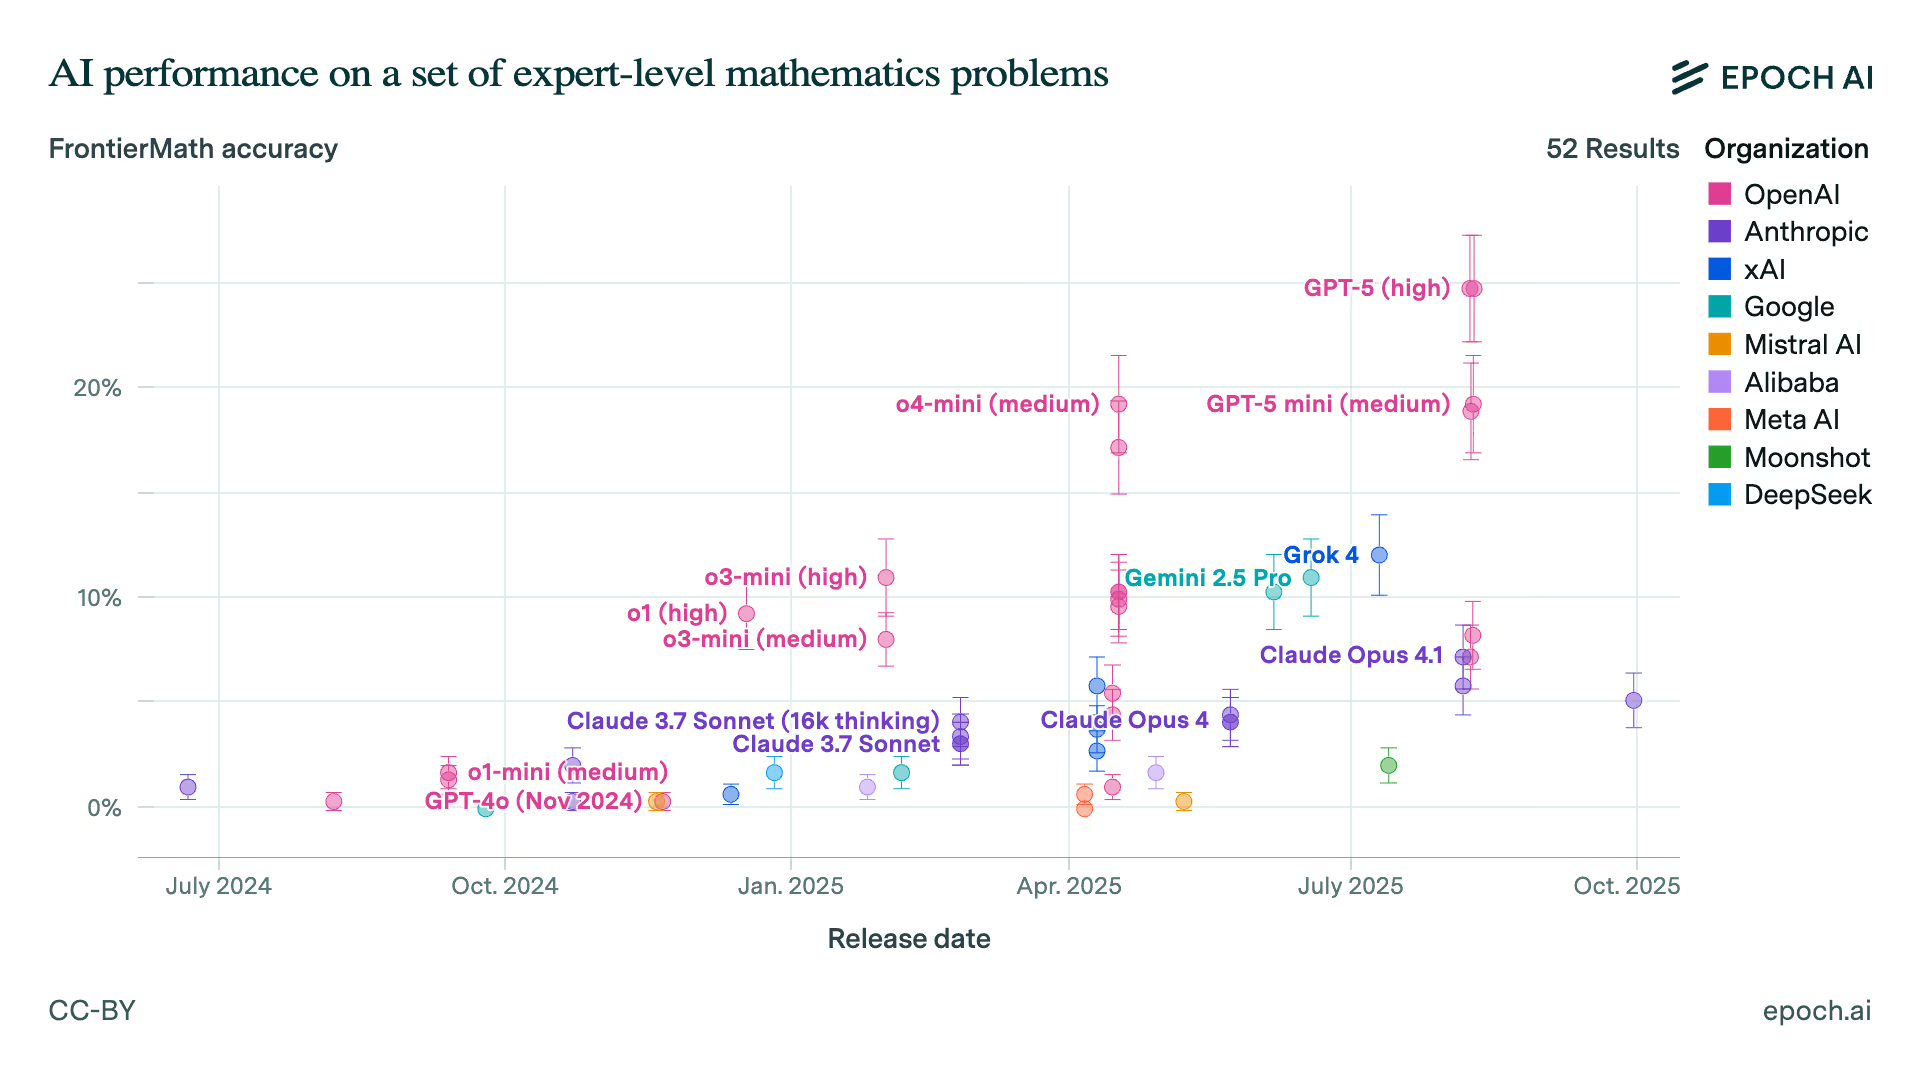
But this assumption illustrates a fundamental problem in AI evaluation, one that we in the experimentation space know quite well as Goodhart's Law: "When a measure becomes a target, it ceases to be a good measure." The AI industry has turned benchmarks into targets, and now those benchmarks are failing us.
When GPT-4 launched, it dominated every benchmark. Yet within weeks, engineering teams discovered that smaller, "inferior" models often outperformed it on specific production tasks—at a fraction of the cost.
With all the fanfare of the GPT-5 launch and outperforming all other models on coding benchmarks, developers continued to prefer Anthropic's models and tooling for real-world usage. This disconnect between benchmark performance and production reality isn't an edge case. It's the norm.
The market for LLMs is expanding rapidly—OpenAI, Anthropic, Google, Mistral, Meta, xAI, and dozens of open-source options all compete for your attention. But the question isn't which model scores highest on benchmarks. It's which model actually works in your production environment, with your users, under your constraints.
Why traditional benchmarks fail in production
AI benchmarks are standardized tests designed to measure model performance—MMLU tests general knowledge, HumanEval measures coding ability, and FrontierMath evaluates mathematical reasoning. Every major model release leads with these scores.
But these benchmarks fail in three critical ways that make them unreliable for production decisions:
1. They don't measure what actually matters Benchmarks test surrogate tasks—simplified proxies that are easier to measure than actual performance. A model might excel at multiple-choice medical questions while failing to parse your actual clinical notes. It might ace standardized coding challenges while struggling with your company's specific codebase patterns. The benchmarks measure something, just not real-world problem-solving ability.
2. They're systematically gamed Data contamination lets models memorize benchmark datasets during training, achieving perfect scores on familiar questions while failing on slight variations. Worse, models are specifically optimized to excel at benchmark tasks—essentially teaching to the test. When your model has seen the answers beforehand, the test becomes meaningless.
3. They ignore production reality Benchmarks operate in a fantasy world without your constraints. Latency doesn't exist in benchmarks, but your multi-model chain takes 15+ seconds. Cost doesn't matter in benchmarks, but 10x price differences destroy unit economics. Your infrastructure has real memory limits. Your healthcare app can't hallucinate drug dosages.
Consider this sobering statistic: 79% of ML papers claiming breakthrough performance used weak baselines to make their results look better. When researchers reran these comparisons fairly, the advantages often disappeared.
The A/B testing advantage: finding what actually works
So if benchmarks fail us, how do we actually select and optimize LLMs? Through the same methodology that transformed digital products: rigorous A/B testing with real users and real workloads.
The portfolio approach
The first insight from production A/B testing contradicts everything vendors tell you: the optimal solution is rarely a single model.
Successful deployments use a portfolio approach. Through testing, teams discover patterns like:
- Simple queries handled by models that are fast, cheap, and good enough
- Complex reasoning routed to thinking models
- Domain-specific tasks sent to fine-tuned specialist models
Take v0, Vercel's AI app builder. It uses a composite model architecture: a state-of-the-art model for new generations, a Quick Edit model for small changes, and an AutoFix model that checks outputs for errors.
This dynamic selection approach can slash costs by 80% while maintaining or improving quality. But you'll only discover your optimal routing strategy through systematic testing.
Metrics that actually drive business value
Production A/B testing reveals the metrics that benchmarks completely miss:
Performance metrics that matter:
- Task completion rate: Do users actually accomplish their goals?
- Problem resolution rate: Are issues solved, or do users return?
- Regeneration requests: How often is the first answer insufficient?
- Session depth: Are simple tasks requiring multiple interactions?
Cost and efficiency reality:
- Tokens per request: Your actual API costs, not theoretical pricing
- P95 latency: How long your slowest users wait (the ones most likely to churn)
- Throughput limits: Can you handle Black Friday or just Tuesday afternoon?
Counterintuitive insight: If an LLM solves a user's question on the first try, you may see fewer follow-up prompts. That drop in "requests per session" is actually positive—your model is more effective, not less engaging.
Making A/B testing work for LLMs
Testing LLMs requires adapting traditional experimental methods to handle their unique characteristics:
Handle the randomness: Unlike deterministic code, LLMs produce different outputs for the same prompt. This variance means:
- Run tests longer than typical UI experiments
- Use larger sample sizes to achieve statistical significance
- Consider lowering temperature settings if consistency matters more than creativity
Isolate rour variables: Test one change at a time:
- Model swap (GPT-5 → Claude Opus)
- Prompt refinement (shorter, more specific instructions)
- Parameter tuning (temperature, max tokens)
- Routing logic (which queries go to which model)
Without this discipline, you can't attribute improvements to specific changes.
Set smart guardrails: Layer guardrail metrics alongside your primary success metrics. An improvement in task completion that doubles costs might not be worth deploying. Track:
- Cost per successful interaction (not just cost per request)
- Safety violations that could trigger PR nightmares
- Latency thresholds that cause user abandonment
Build once, test forever: Invest in infrastructure that makes testing sustainable:
- Centralized proxy service for LLM communications
- Automatic metric collection and monitoring
- Prompt versioning and management
- Response validation and safety checking
This investment pays off immediately—making tests easier to run and results more trustworthy.
Embrace empiricism
Benchmarks aren't entirely useless—use them for initial screening, understanding capability boundaries, and meeting regulatory minimums. But they should never be your final decision criterion.
The AI industry's obsession with benchmarks has created a dangerous illusion. Models that dominate standardized tests struggle with real tasks. The metrics we celebrate have divorced from the outcomes we need.
For teams building with LLMs, the path is clear:
- Start with hypotheses, not benchmarks: "We believe Model X will improve task completion," not "Model X scores higher"
- Test with real users and real data: Your production environment is the only benchmark that matters
- Measure what moves your business: User satisfaction, cost per outcome, and regulatory compliance
- Iterate based on evidence: Let data, not vendor claims, drive your model selection
Despite the fanfare surrounding the GPT-5 launch and its outperformance on coding benchmarks, developers continued to prefer Anthropic's models and tooling for real-world use. The benchmarks aren't exactly lying—they're just answering the wrong questions. A/B testing asks the right ones: Will this solve my users' problems? Can we afford it at scale? Does it meet our requirements?
In the end, the best benchmark for your AI isn't a standardized test. It's users voting with their actions, costs staying within budget, and your application delivering real value.
Everything else is just numbers on a leaderboard.
Further reading
GrowthBook version 4.1
This release continues the momentum of GrowthBook 4.0 by adding two of our most requested Enterprise features - Holdouts and Experiment Dashboards. Plus, we’ve made several significant enhancements to our integrations with AI coding tools and our MCP server capabilities. If you’re not yet using GrowthBook with your AI coding tools, we highly recommend it!
Read on to learn more about these features and everything else we’ve been working on these past 2 months.
Holdouts
MCP Server
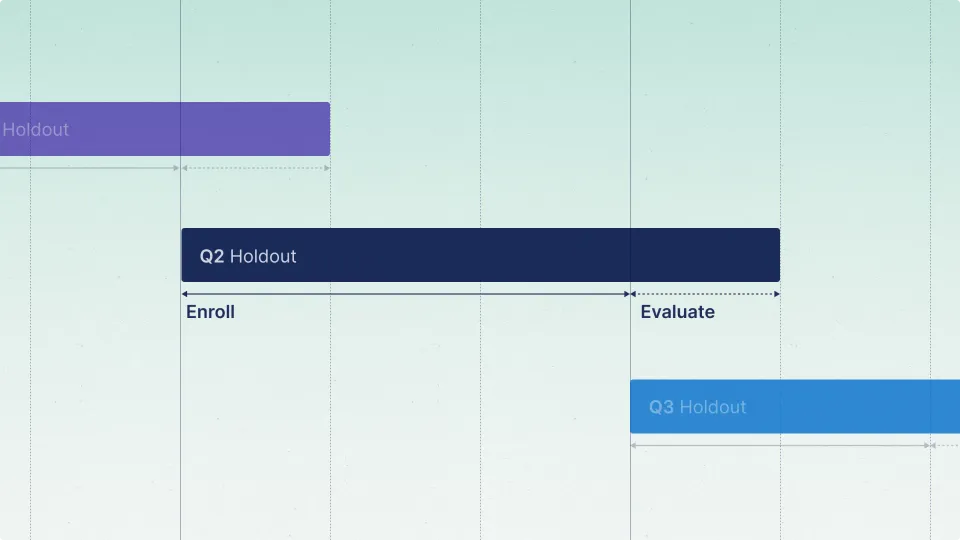
Holdout experiments measure the long-term impact of features by maintaining a control group that doesn't receive new functionality. While most users experience your latest features and improvements, a small percentage remain on the original version, providing a baseline for measuring cumulative effects over time. Read more about holdouts.
Experiment dashboards
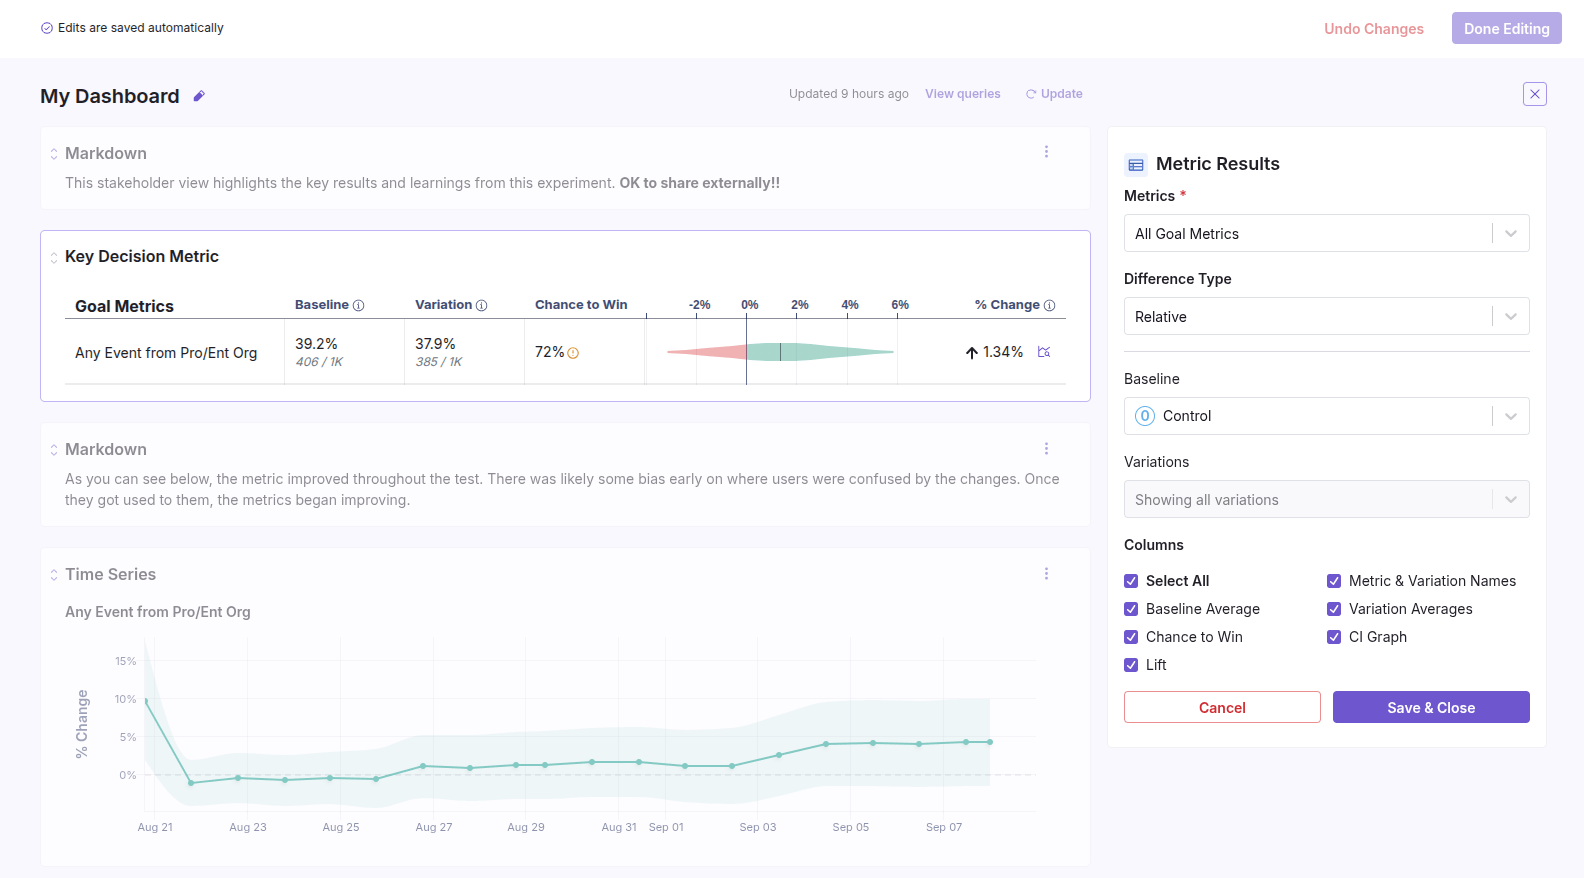
Experiment Dashboards let you create tailored views of an experiment. Highlight key insights, add context, and share a clear story with your team. For example, highlight the key goal metric results, show an interesting breakdown by dimension, and link to supporting external documents, all in a single view. Dashboards are available for all Enterprise customers. We have a lot planned for this, so stay tuned!
AI features
This release integrates AI to accelerate your workflows in GrowthBook. Auto-summarize experiment results, get help writing SQL, improve hypotheses, detect similar past experiments, and more. These features are available even if you’re self-hosted, just supply an OpenAI API key. See the AI features in action or read detailed information on how these features work.
MCP updates
We've updated our MCP Server to allow you to create experiments directly from your AI coding tool of choice, without needing to context switch to GrowthBook. This change unlocks a bunch of new, exciting workflows, and we can't wait to see how you use it!
Vercel native integration
We're excited to announce that GrowthBook is now available as a native integration in the Experimentation category on the Vercel Marketplace! This integration makes it easier than ever to add feature flagging and A/B testing to your Vercel projects, with streamlined setup, unified billing, and ultra-low latency performance. Read more on our announcement post.
Pre-computed dimensions
You can now pick a set of key experiment dimensions and pre-compute them along with the main experiment results. This allows for more efficient database queries and instant dimension breakdowns in the UI. Read more in our docs.
FerretDB support

FerretDB is a MongoDB-compatible, open-source database that is free to use. It serves as a drop-in replacement for MongoDB, converting MongoDB wire protocol queries to SQL and using PostgreSQL as its backend storage engine. We're pleased to support FerretDB officially!
Sanity CMS integration

Sanity is a real-time content backend for all your text and assets. You can now use GrowthBook feature flags to seamlessly test different content variations within Sanity. Check out our announcement video and tutorial or our docs.
The 4.1 release includes over 150 commits, way more than we can quickly summarize here. View the release details on GitHub for a more comprehensive list. As always, we love feedback - good and bad. Let us know what you think of the new features and what you want to see as part of 4.2!
Feedback loops are the next breakthrough in agentic coding
At first glance, feature flag and experimentation platforms don’t seem closely tied to AI. But at GrowthBook, we see it differently. These platforms don’t just test whether a feature works technically—they test whether it delivers the business outcomes developers intended. That distinction is critical, and it’s exactly the kind of feedback loop AI coding platforms need to evolve.
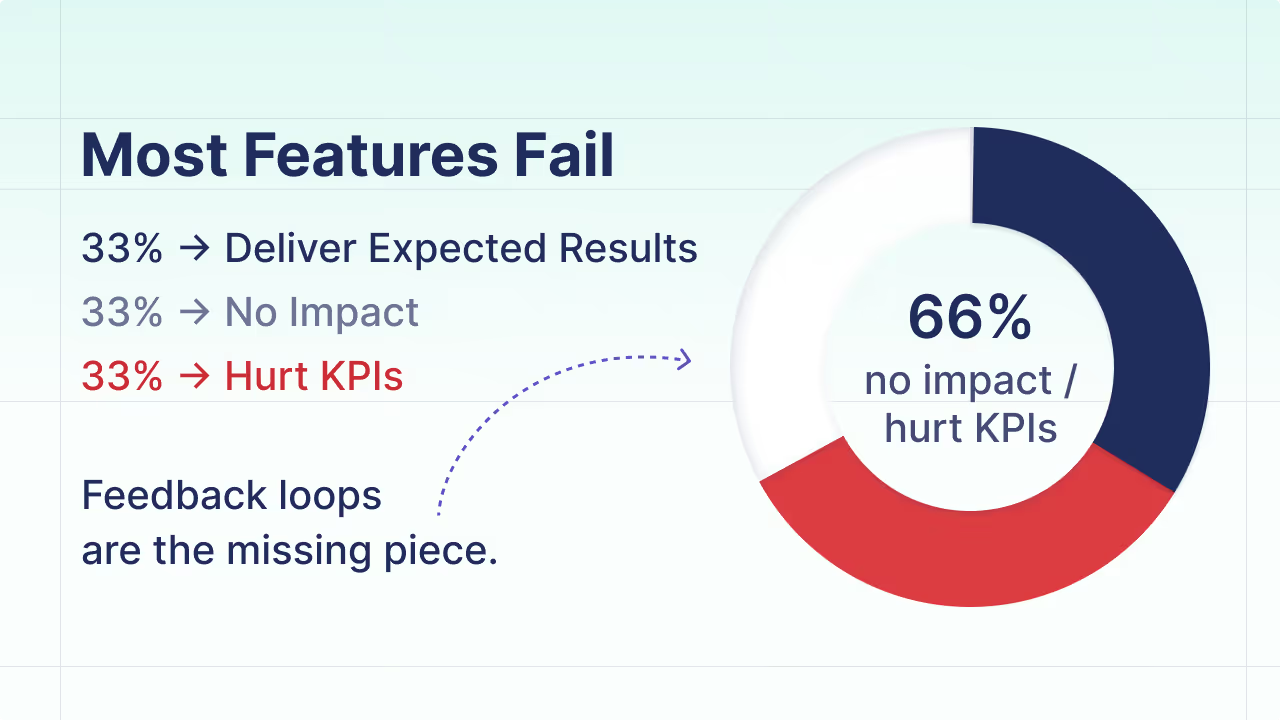
Research shows that only about one-third of software features actually deliver the expected results. Another third make little difference. And the final third actively harm key metrics like conversion or engagement. Without structured feedback, teams repeat the same costly mistakes.
Now imagine an AI that could warn you before you invested weeks of engineering effort: “This feature is unlikely to move the needle.” That’s the future we believe is coming.
The next frontier for LLMs
Most AI coding tools today help developers build features exactly as they always have. Which means they’re just as likely to produce underperforming features. The next breakthrough will be AI systems that understand what to build and how to build it—drawing on millions of past experiments.
OpenAI has already hinted at this direction. In its GPT-5 Prompting Cookbook, it recommends creating a rubric to evaluate a development plan, then iterating until the plan earns top marks. Now imagine if that rubric weren’t handcrafted, but instead learned automatically from thousands of feature tests. AI wouldn’t just critique plans. It would know what success looks like—and guide you there directly.
That’s a leap toward more intelligent, agentic AI—not only in coding, but also in fields like finance and healthcare, where feedback loops are abundant.
Bringing agentic coding into your workflow today
The good news: you don’t need to wait for the future. With GrowthBook’s MCP server, AI coding tools can already tap into your past experiments to build intelligent rubrics. They can:
- Design and deploy experiments for the features they create
- Measure results in real time against your KPIs
- Iterate continuously until outcomes align with business goals
The scale of experimentation today is staggering. GrowthBook customers collectively run hundreds of thousands of experiments each month—and that number is growing. AI can now unlock insights from this volume of data in ways that were never possible before.
The bigger impact
Building a culture of experimentation does more than improve feature delivery. It accelerates innovation, drives better customer experiences, and creates measurable gains in usage, retention, and sales.
Feedback loops will make agentic AI smarter, faster, and more valuable to every software team. The future of coding isn’t just about writing code—it’s about learning from every outcome. And with the right experimentation infrastructure, that future is already here.

How GrowthBook holdouts work under the hood
Holdouts answer a deceptively simple question: “What did all of this shipping actually do?” In GrowthBook, a holdout keeps a small, durable control group away from new features, experiments, and bandits, then compares them to everyone else over time. That comparison is your long-run, cumulative impact—no guess work, no complicated de-biasing algorithms.
You can read more about holdouts in this blog post, Holdouts in GrowthBook: The Gold Standard for Measuring Cumulative Impact and in our documentation. But in this post, I’m going to talk about some of the nitty-gritty choices we made and why we made them.
We measure everything that happened, not just shipped winners
There are two different approaches out there to measuring impact with holdouts:
- “Measure everything” approach (used in GrowthBook). The holdout group stays off all new functionality; everyone else proceeds as normal—experimenting, shipping, backtracking, and iterating. We then compare a small, like-for-like measurement subset of the general population to the holdout. That design deliberately measures the full experience of what happened over the quarter, not just the curated list of winners. It’s a more faithful assessment of the world your users actually saw.
- “Clean-room” approach. The holdout group still stays off all new functionality. However, you also withhold a holdout test group that only sees shipped features. This slice is used to compare against your holdout; meanwhile, the remaining traffic is where day-to-day experiments run.
Here’s another way to think about it. Imagine your traffic is split into 3 groups with a 5% holdout:
- Holdout (5%): The same across both groups. Never sees any new feature
- Measurement (5%): The key difference is here. In the “clean room” approach, they are held out until a feature is shipped, and then get the winning variation. In the “measure everything” approach, they are identical to the General group, and are used to experiment and ship
- General (90%): The same across both groups. Used to experiment and ship
How do they compare?
The “clean-room” approach provides you with the most accurate assessment of what you shipped. You get a sample that only sees the shipped features and does not have a history of seeing features you decided not to ship. This can really help you know if “what you shipped worked.”
However, it has 3 major downsides:
- It leaves you blind to what actually happened to the vast majority of users along the way (failed experiments, feature false starts, etc.). If you want to know if your overall program is headed in the right direction, you have to include the costs of running experiments, exposing users to losing variations, and more. While “measure everything” may be a worse estimate of simply the cumulative impact of winners, it more accurately represents the impact your team had. What’s more, not knowing what is going on with 90+% of your entire user base is quite a cost to pay.
- Furthermore, it may actually be a worse estimate of the impact going forward. If seeing past failed experiments better represents how future failed experiments may interact with your shipped features, then you actually want your holdout estimate to include these past failed experiments.
- You end up with lower power for your regular tests. By splitting another 5% off of the general population, all of your regular tests will have 5% less traffic to ship. This could slow down your overall experimentation program and lead to worse decisions.
For these reasons, at GrowthBook, we opted for the approach where you “measure everything.”
How feature evaluation works: prerequisites
Under the hood, Holdouts rely on prerequisites. Before any feature rule or experiment is evaluated, GrowthBook checks the holdout prerequisite and diverts holdout users to default values. This works just like a regular rule in your Feature evaluation flow, making it easy to understand what's happening
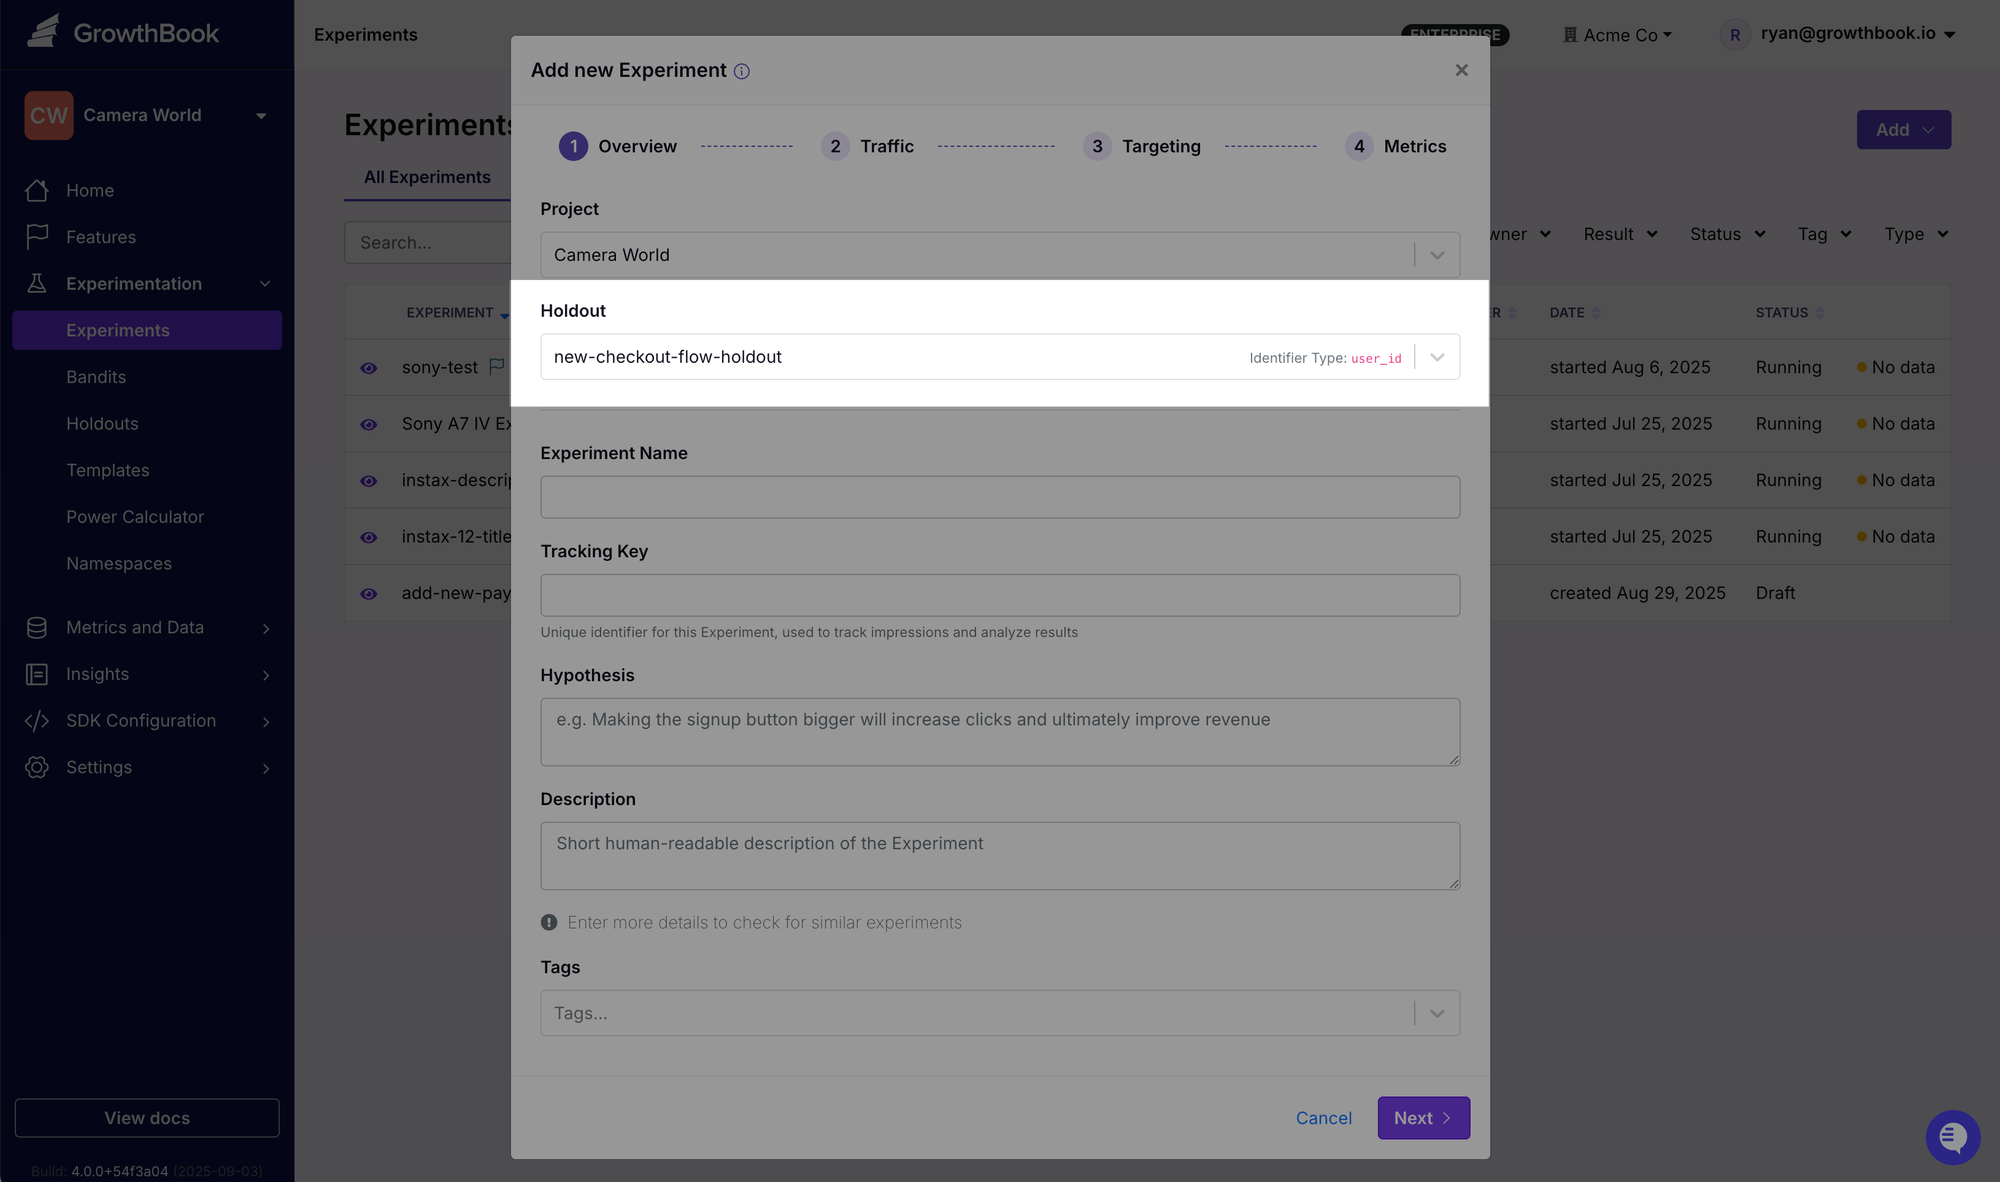
Everyone else flows through your rules as usual. Because that evaluation triggers on every included feature or experiment, holdout exposure can occur at different moments in a user’s journey.
That has two important implications for analysis:
- Prefer metrics with lookback windows. Since users can encounter the holdout at varying times, fixed conversion windows anchored to a single “first exposure” are often ill-posed for long-running, multi-feature measurement. GrowthBook enforces this: you can’t add conversion-window metrics to a holdout; instead, use long-range metrics without windows or with lookback windows.
- Use the built-in Analysis Period when you’re ready to read the holdout: freeze new additions, keep splitting traffic, and let GrowthBook apply dynamic lookback windows per experiment/metric so you measure exactly the period you care about.
Compliance by default: project-level enforcement
Holdouts are scoped to Projects—a core GrowthBook organizing unit for features, metrics, experiments, SDKs, and permissions. Assign a holdout to a project and, from that point on, new features, experiments, and bandits created in that project inherit the holdout by default (there’s an escape hatch if you truly need it). This keeps your baseline clean without relying on every engineer, product manager, or data analyst remembering to use the holdout.
Under the hood, each time your team creates an experiment or a feature in a Project, we check if that Project has any associated holdouts. If there is one, we pre-select it, and allow you to opt out with a warning. If there is more than one holdout, we select the first one by default, but experimenters can switch their selected holdout. We recommend you avoid this situation. If there are any holdouts without project scoping, they are available to all projects, and we recommend avoiding this unless you are running a global holdout.
This adds one more reason to use Projects:
- Right-sized access. Projects already let you define who can see and change what, including “no access” when needed. Holdouts ride along with those boundaries.
- Cleaner authoring flows. Creators see a Holdout field during setup; if multiple holdouts exist (not recommended), they can select the correct one. Otherwise, it’s on by default—compliance without cognitive load.
- Comparable program reads. Teams running their own project-scoped holdouts can produce apples-to-apples quarterly reads of cumulative impact across surfaces.
TL;DR
- Measure reality, not a curated subset. Our holdouts capture everything that happened during the holdout period. Learn more about what a holdout actually measures.
- Prerequisites: power correctness. Every evaluation respects the holdout; pair that with lookbacks or the analysis window for clean metric reads.
- Compliance is built-in. Project-level enforcement makes holdouts the default, not an afterthought.
Get started by reading our docs or by signing up.

Holdouts in GrowthBook: the gold standard for measuring cumulative impact
Many successful product teams iterate quickly, running simultaneous experiments and launching new features weekly. Measuring the overall effect of these tests is critical to understanding the team’s impact and to help set product direction. However, actually measuring this cumulative impact can be quite difficult.
Holdouts in GrowthBook provide a simple way to keep a true control group across multiple features and measure long-run cumulative impact. It’s the gold standard way to answer the question: “What did all of this shipping actually do to my key metric?”
Why holdouts matter
Cumulative impact is important to measure.
Ensuring that your experimentation program helps you ship winning features and avoid losing features sets your product direction. Knowing which teams are driving the most impact can help you understand what’s working and what isn’t. Teams that are successfully moving the needle may deserve more investment to continue driving their goals upward. If a team struggles to have a significant impact, they may have hit diminishing returns, they may need a new direction, or the product may have reached a certain level of maturity, making gains more difficult to achieve.
Cumulative impact is hard to measure.
Looking at the overall trend in your goal metrics is not enough. Forces beyond your control or seasonality can dictate goal metric movements and can mislead you. With constant shipping across product teams, attributing lift to individual teams can be nearly impossible.
Other approaches try to sum up the effect of individual experiments and apply some bias reduction, like the one on our own Insights section. Almost always, the individual impacts of experiments, when summed up, overstate the final effects due to selection bias, generally diminishing returns over time, and cannibalizing interactions with other experiments. This isn’t just theoretical; Airbnb documented how a naive sum overstates impact by 2x when compared with a holdout, and bias-corrected estimates still overstate impact by 1.3x.
Holdouts as the solution.
A well-run holdout exposes a stable baseline of users to none of your new features for a period of time, then compares them to the general population. Because a holdout can run for longer on a small percentage of traffic, you capture longer-run effects. Furthermore, it allows you to stack all of your features and experiments into one test, capturing cumulative and interactive effects. Finally, it uses reliable statistics and inference from experiments to make holdouts the gold standard for cumulative, long-run impact.
How holdouts work in GrowthBook
At a high level:
- Holdout group: A small percentage of traffic (usually users) is diverted away from new features, experiments, and bandits.
- General population: Everyone else—experimenting and shipping as usual. We then select a small subset of the general population as a measurement group to compare against the holdout group.
As you launch new features and experiments, all new traffic checks whether they should be diverted to the holdout before seeing the new feature or experiment values.
When an experiment goes live, the holdout group is completely excluded while the general population gets randomized into one condition or another. Once an experiment is shipped, all users in the general population will receive the shipped variant.
This means that the holdout measures the cumulative impact of using your product, which includes all the false starts and the test period for the experiments that didn’t ship, because that is a true record of what actually happened in the past quarter.
Only once the holdout is ended will users in the holdout group receive any shipped features.
Using your holdout
Facebook and X product teams ran 6-month holdouts for all their features, withholding 5% or less of traffic, and then used the cumulative impact in reporting and to understand if they had correctly set their product direction. They then released the holdout and started a new one for the next 6-month period.
Other teams at X were also using long-run, low-traffic holdouts on a bundle of critical features to ensure they were continuing to provide value.
- Define the population size: Pick a sample large enough to measure your cumulative impact, but beware that larger population sizes mean you will end up with less traffic for your day-to-day experiments and fewer users with the latest set of features.
- Define the active period length (half a month to a quarter): Pick a period long enough to accumulate some wins
- During the active period (half to a full quarter): Ship normally. Keep adding experiments and launching features. The holdout quietly accumulates evidence.
- Analysis period (2–4 weeks): Freeze adding new changes, let effects settle, and compare cumulative impact with our automatic lookback windows applied to measure only the analysis period.
Product teams at X would run a holdout for a half a year, adding new features to the holdout over the course of 6 months. Then, they would use the following quarter to get a reliable, long-run measure of their cumulative impact.
So, a year would look like this:
Tips & trade-offs
- Project-scope your Holdout: If you want to measure the impact of a given team’s set of features, have that team work within one or more GrowthBook Projects and have the Holdout automatically apply to their features and experiments.
- Be wary of the user experience: A small group won’t see new features—keep the percentage small and the period finite.
- Be ready to keep feature flags in code: Holdouts require feature flags to stick around through the analysis period, so prepare your workflows for longer-lasting features.
- Metrics: Favor durable outcomes (revenue, retention, engagement) and use lookbacks for clean analysis windows so that you only measure the impact once all experiments have had a chance to bed-in. Learn more about what a holdout actually measures.
Get started
- Create your first holdout in the app (Experiments → Holdouts) and scope it to a project you want to measure impact within.
- Pick 2 - 4 long-run metrics that your team is hoping to improve in the long-run.
Read more about holdouts in our Knowledge Base and see our documentation to help run your first holdout.

Building in the AI era: lessons from past technological revolutions
We are living through a generational technology shift—one that comes along only once or twice in a lifetime, reshaping how humans interact with the world. Just as electricity, automobiles, computers, the internet, and mobile computing were transformative, AI is doing the same today. However, history shows us that in the early days of a new technology, people often misunderstand the power that it unlocks. This article will examine some of the historical technology shifts and the lessons we can learn from them.
Lessons from history
Practical applications of electricity began to take root in the 1880s and 90s, with the first electrical power station opening in Manhattan by Edison. The uses were initially targeted at consumers, with rich New Yorkers able to electrify their homes and replace their gas lights with electric ones. Industry, on the other hand, was slow to adapt, despite the evident advantages. Most industries simply replaced steam-powered equipment with electric ones, or added electric lights, without considering how their industry could operate differently.
The engineering breakthrough came when Henry Ford reimagined the factory in the 1910s. He utilized electric motors' precise speed control and distributed power to create the moving assembly line in 1913—a feat impossible with centralized steam engines that required complex systems of belts and pulleys. These improvements cut the Model T build time from 12 hours to about 93 minutes—a systemic redesign that enabled scale, lowered costs, and transformed labor and manufacturing fundamentally.
A similar lesson comes from the introduction of the television. In the early days of television, content was heavily borrowed from radio—simply filmed broadcasts of radio shows without inventing for the new medium. The real shift came when creators embraced television's potential: drama anthologies, magazine-format shows like Today and The Tonight Show, recording and editing footage from multiple cameras, and new storytelling formats were designed for television. By the 1950s, TV overtook radio: between 1950 and 1960, U.S. household ownership jumped from about 9 percent to over 60 percent, nearing 90 percent in the early 1960s.
The lesson: Early adopters who treat a new medium like the old one often miss its full value. The true winners reimagine processes, experiences—and even entire business models—when they adopt these new technologies.
Parallels with today’s AI adoption
It is evident from the above examples that there are parallels with the adoption of AI into our products and businesses. Pressure to add AI or to be the AI for x industry results in many uninspired implementations. Many organizations today bolt on an AI assistant—like lighting a few bulbs in a steam-powered factory—but miss the opportunity to reimagine workflows end-to-end. The real transformation occurs when considering how AI can transform the user experience.
The difference between the past technological shifts and the AI one we’re experiencing today is the incredible velocity of the change.
- It took about 13 years for Ford to sell 1 million cars.
- It took Google 1 year to reach 1 million searches per day.
- Apple’s iPhone launched in 2007, heralding the smartphone revolution, and sold 1 million units in just 74 days.
- ChatGPT, on the other hand, reached 1 billion searches per day in under a year—a metric that Google took over 10 years to achieve.
Within just two months of its November 2022 launch, ChatGPT surpassed 100 million users—the fastest adoption rate ever recorded for a consumer software product. This rate of adoption suggests that companies that don't learn from history and adapt to the AI era face an existential threat, not just a competitive disadvantage.
GrowthBook’s journey with AI
At GrowthBook, our initial step was adding the lightbulb: we launched an AI chatbot to help users navigate our documentation (a helpful concierge, if you will).
Simultaneously, we conducted several brainstorming sessions to reevaluate our product and explore the potential impact of AI on our business. We ran the 11-star brainstorming sessions and planned our roadmap to reimagine what AI will mean in the A/B testing and product analytics space. We built Weblens.ai as a demonstration of some of the features AI can unlock for AB testing—and we have many more coming very soon.
Conclusion
From electrification to television to AI, each technological shift has rewarded those who reimagined systems entirely. They didn’t just adopt new tools—they rewrote workflows, content, and the way they delivered value.
Here are the lessons:
- Treat AI as a new paradigm—not just as an add-on. Like Ford reengineered production or TV creators abandoned radio formats, design products from an AI-native perspective.
- Focus on user journeys and tasks that AI can redefine—insights, decisions, personalization—rather than isolated features shoe‑horned onto existing interfaces.
- If you don’t adapt now, someone else will. AI has experienced an explosive rate of growth, resulting in significant productivity gains and a reduction in the time it takes to bring products to market.

GrowthBook is now available on the Vercel Marketplace
We're excited to announce that GrowthBook is now available as a native integration in the Experimentation category on the Vercel Marketplace! This integration makes it easier than ever to add feature flagging and A/B testing to your Vercel projects, with streamlined setup, unified billing, and ultra-low latency performance.
What this means for developers
The Vercel Marketplace includes an Experimentation category specifically designed for developers who want to implement feature flags and run experiments without the complexity of managing separate platforms. As one of the first experimentation providers in this new category, GrowthBook brings enterprise-grade feature management and experimentation directly into your Vercel workflow.
With this native integration, you can:
- Access GrowthBook from Vercel: Access flags and experiments without leaving the Vercel dashboard
- Sync to Vercel Edge Config: Automatically sync your feature flags to Vercel Edge Config for near-zero latency flag evaluation
- Unified billing: Manage GrowthBook billing through your existing Vercel account
- Integrate GrowthBook and Vercel SDKs seamlessly: Use GrowthBook's SDKs or integrate with Vercel's Flags SDK for simplified setup
Built for performance and scale
Traditional feature-flagging solutions often introduce latency via API calls, leading to flickering web pages, missed analytics, poor UX, and skewed experimentation results. Our Vercel integration leverages Edge Config to eliminate this bottleneck entirely. When you enable Edge Config syncing, your feature flags are automatically distributed to Vercel's global edge network, allowing your applications to evaluate flags without making external API calls.
This means no flickering, no delays, and no compromises on performance—just real-time control over your application features with sub-millisecond flag evaluation times.
How it works
Getting started is incredibly straightforward:
- Install from the Marketplace: Navigate to the Vercel dashboard, select Integrations, then Browse Marketplace. Find GrowthBook in the Experimentation category.
- Choose Your Plan: Select between our free Starter or Pro plan. Pro plan billing is handled directly through Vercel for a unified experience.
- Connect Your Projects: The integration creates a new GrowthBook organization and automatically connects it to your selected Vercel projects.
- Start Building: Create feature flags, set up A/B tests, and manage rollouts in GrowthBook, with direct access from your Vercel dashboard
- Dive Deeper: Use GrowthBook's full analytics suite to understand experiment results
Perfect for Next.js applications
If you're building with Next.js, the integration works seamlessly with Vercel's Flags SDK. You can use the newly released @flags-sdk/growthbook provider to load experiments and flags with zero configuration. For other frameworks, GrowthBook's comprehensive SDK library supports every major language and platform.
Enterprise-grade features, startup-friendly pricing
This integration brings all of GrowthBook's powerful features to Vercel users:
- Advanced Targeting: Target users based on attributes, location, device type, and custom rules
- Statistical Analysis: Built-in Bayesian and Frequentist statistics engines for reliable experiment results
- Multi-armed Bandits: Automatically optimize traffic allocation based on performance
- Comprehensive Analytics: Track any metric and understand the full impact of your experiments
- Warehouse Native: Use your existing data stack (Snowflake, BigQuery, Databricks, ClickHouse, Postgres, etc.)
Our pricing remains developer-friendly, with a generous free tier that includes unlimited feature flags and experiments for up to 3 team members. The Pro plan scales with your needs and is now conveniently billed through Vercel.
The next step in your development workflow
Modern web development requires the ability to test, iterate, and optimize continuously. With GrowthBook now available on the Vercel Marketplace, you can add sophisticated feature management and experimentation capabilities to your projects in minutes, not days.
Whether you're rolling out a new feature to a subset of users, running A/B tests to optimize conversion rates, or implementing progressive rollouts to minimize risk, GrowthBook provides the tools you need without slowing down your development workflow.
Get started today
Ready to start experimenting? Install the GrowthBook integration from the Vercel Marketplace today. It's available to users on all Vercel plans, and you can be up and running with your first feature flag in under 60 seconds.
Install GrowthBook on Vercel Marketplace →
For questions or support, join our Slack community or check out our documentation for Next.js integration details.

GrowthBook version 4.0
We shipped so many new features in our June Launch Month that we decided that it deserved a major version increase. Version 4.0 brings a huge array of new features. Here’s a quick summary of everything it includes.
GrowthBook MCP server
AI tools like Cursor can now interact with GrowthBook via our new MCP server. Create feature flags, check the status of running experiments, clean up stale code, and more.
Safer rollouts
Building upon our Safe Rollouts release from the last version, we added gradual traffic ramp-up, auto rollback, a smart update schedule, and a time series view of results. All of these combine to add even more safety around your feature releases
Decision criteria
You can now customize the shipping recommendation logic for experiments. Choose from a “Clear Signals” model, a “Do No Harm” model, or define your own from scratch.
Search filters
We’ve revamped the search experience within GrowthBook to make it easier to find feature flags, metrics, and experiments. Easily filter by project, owner, tag, type, and more.
Insights section
We added a brand-new left nav section called “Insights” with a bunch of tools to help you learn from your past experiments.
- The Dashboard shows velocity, win rate, and scaled metric impact by project.
- Learnings is a searchable knowledge base of all of your completed experiments.
- The Experiment Timeline shows when experiments were running and how they overlapped with each other.
- Metric Effects lists the experiments that had the biggest impact on a specific metric.
- Metric Correlations let you see how two metrics move in relation to each other.
SQL explorer
We launched a lightweight SQL console and BI tool to explore and visualize your data directly within GrowthBook, without needing to switch to another platform like Looker.
Managed warehouse
GrowthBook Cloud now offers a fully managed ClickHouse database that is deeply integrated with the product. It’s the fastest way to start collecting data and running experiments on GrowthBook. You still get raw SQL access and all the benefits of a warehouse-native product.
Feature flag usage
See analytics about how your feature flags are being evaluated in your app in real time. This is built on top of the new Managed Warehouse on GrowthBook Cloud and is a game-changer for debugging and QA.
Vercel flags SDK
GrowthBook now has an official provider for the Vercel Flags SDK. This is now the easiest way to add server-side feature flags to any Next.js project. We have an even deeper Vercel integration coming soon to make this experience even more seamless.
Official framer plugin
You can now easily run GrowthBook experiments inside your Framer projects. Assign visitors to different versions of your design (like layouts, headlines, or calls to action), track results, and confidently choose the best experience for your audience.
Personalized landing page
There’s a new landing page when you first log into GrowthBook. Quickly see any features or experiments that need your attention, pick up where you left off, and learn about advanced GrowthBook functionality to get the most out of the platform.
New experimentation left nav
There’s a new “Experimentation” section in the left nav. Experiments and Bandits now live within this section, along with our Power Calculator, Experiment Templates, and Namespaces. We’ll be expanding this section soon with Holdouts and more, so stay tuned!
REST API updates
- Filter the listFeatures endpoint by clientKey
- Support partial rule updates in the putFeature endpoint
- New Queries endpoint to retrieve raw SQL queries and results from an experiment
- Added Custom Field support to feature and experiment endpoints
- New endpoints for getting feature code refs
- New endpoint to revert a feature to a specific revision
Performance improvements
We’ve significantly reduced CPU and memory usage when self-hosting GrowthBook at scale. On GrowthBook Cloud, we’ve seen a roughly 50% reduction during peak load, leading to lower latency and virtually eliminating container failures in production.

Types of Experimentation and When to Use Them
Digital experiments serve a large variety of purposes. You may want to learn whether you’re building the right thing, you might want to safely release changes without introducing regressions, or you might just want to pick a winner between some easy-to-build options.
But one tool won’t be best for all of them. A classic A/B test might struggle if you throw 10 options at it, or it might take too long to reach a clear result if your goal is just to do no harm.
That's why GrowthBook provides you with 3 different tools, all powered by our state-of-the-art statistics engine and performant SDKs.
Experiments for learning, Safe Rollouts for releasing safely, and Bandits for picking a winner among many.
When to use a classic experiment
Use classic experiments when you want to:
- Build a better product or website
- Learn about customer behavior as accurately as possible
- Choose from only 2-3 different options, or a few options that were costly to build with respect to time from design, engineering, and product
Classic experiments in GrowthBook are great at providing you with the clearest answer to the difference in your key goal metrics between 2 or 3 variations. For instance, if you've spent weeks designing and building a new checkout flow, you need precise measurements of its impact on conversion rates compared to your current design.
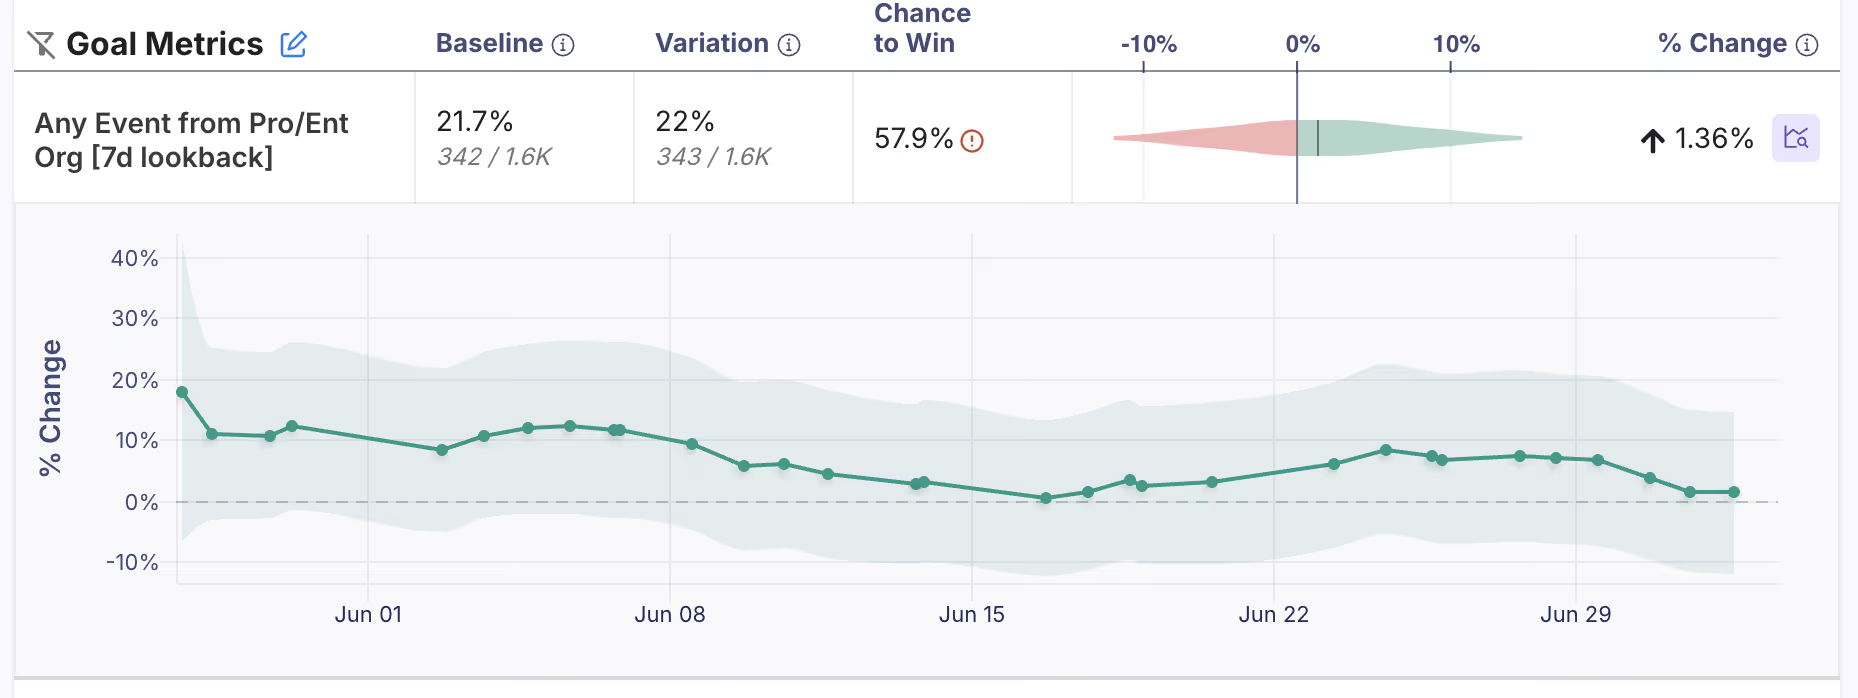
You can reduce variance using tools like CUPED. Or you can use sequential testing and multiple-comparisons corrections to best balance false-positive rates and faster shipping. You can also add Dimensional analyses to slice-and-dice your results and learn more about how what you are building affects your users.
Furthermore, classic Experiments provide accurate experimental effects that form the basis for a historical library. This data becomes invaluable for driving Insights about the overall performance of your product development.
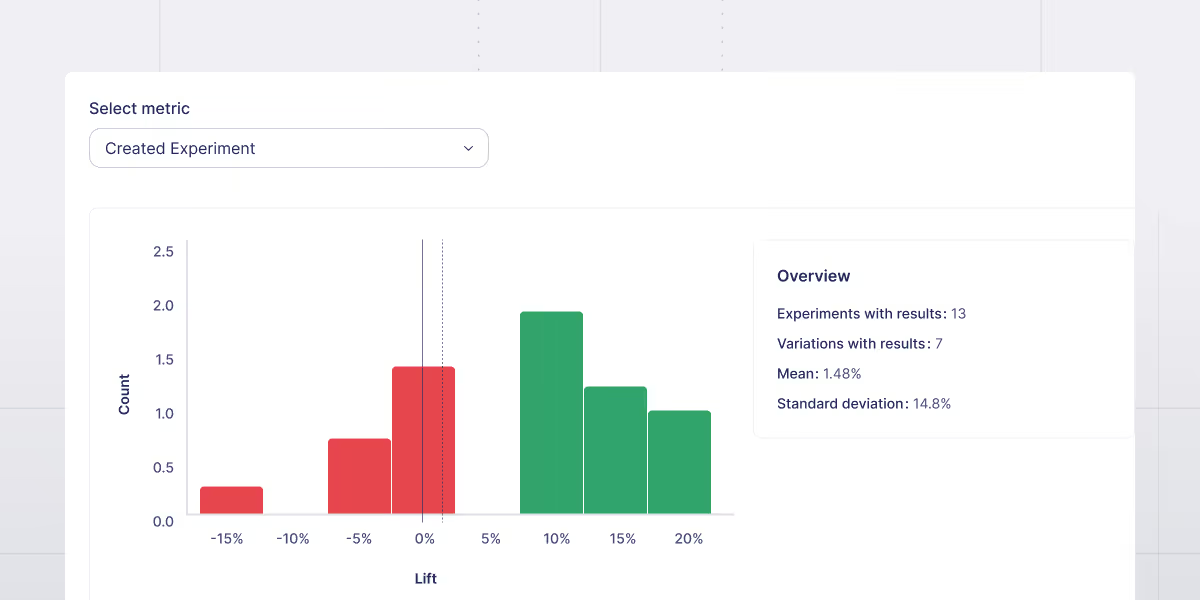
When to use a Safe Rollout
Use a Safe Rollout when you want to
- Release confidently by rolling back as soon as there is a clear regression
- Ship automatically as long as you're doing no harm
- Do lightweight experimentation with every release
Safe Rollouts are built right into GrowthBook Feature Flags and are fast and easy to set up. They use one-sided sequential tests and automatic traffic ramp-ups to ensure that when a guardrail fails, your feature rolls back without inflating false-positive rates. This way, you can make experimentation a part of every release.
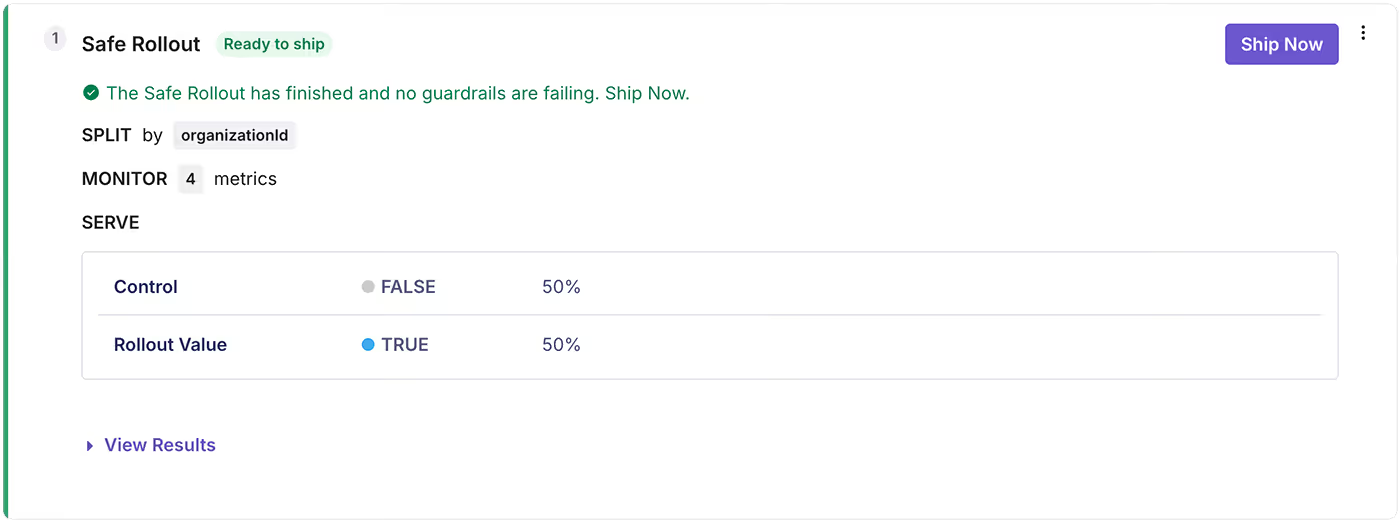
Imagine you've refactored an API endpoint for better performance. Your goal isn't to learn whether it's 5% or 8% faster. You just need confidence that it won't break anything. Safe Rollouts lets you release to 5% of users, automatically scale up if metrics look healthy, and instantly roll back if error rates spike.
While Safe Rollouts can more confidently flag early regressions than a classic Experiment, they aren’t as fine-tuned for building up a library of effects or getting exceedingly precise estimates. They do use CUPED, but it is used in the service of detecting regressions more quickly, not getting the most precise overall lift. Safe Rollouts are also restricted to just 2 variations since they’re designed to safely release a new feature, rather than test between multiple arms.
When to use a Bandit
Use a Multi-Arm Bandit when you want to:
- Pick a winner between 4+ different variations that were easy to build
- Reduce traffic going to variations that are struggling early in an experiment
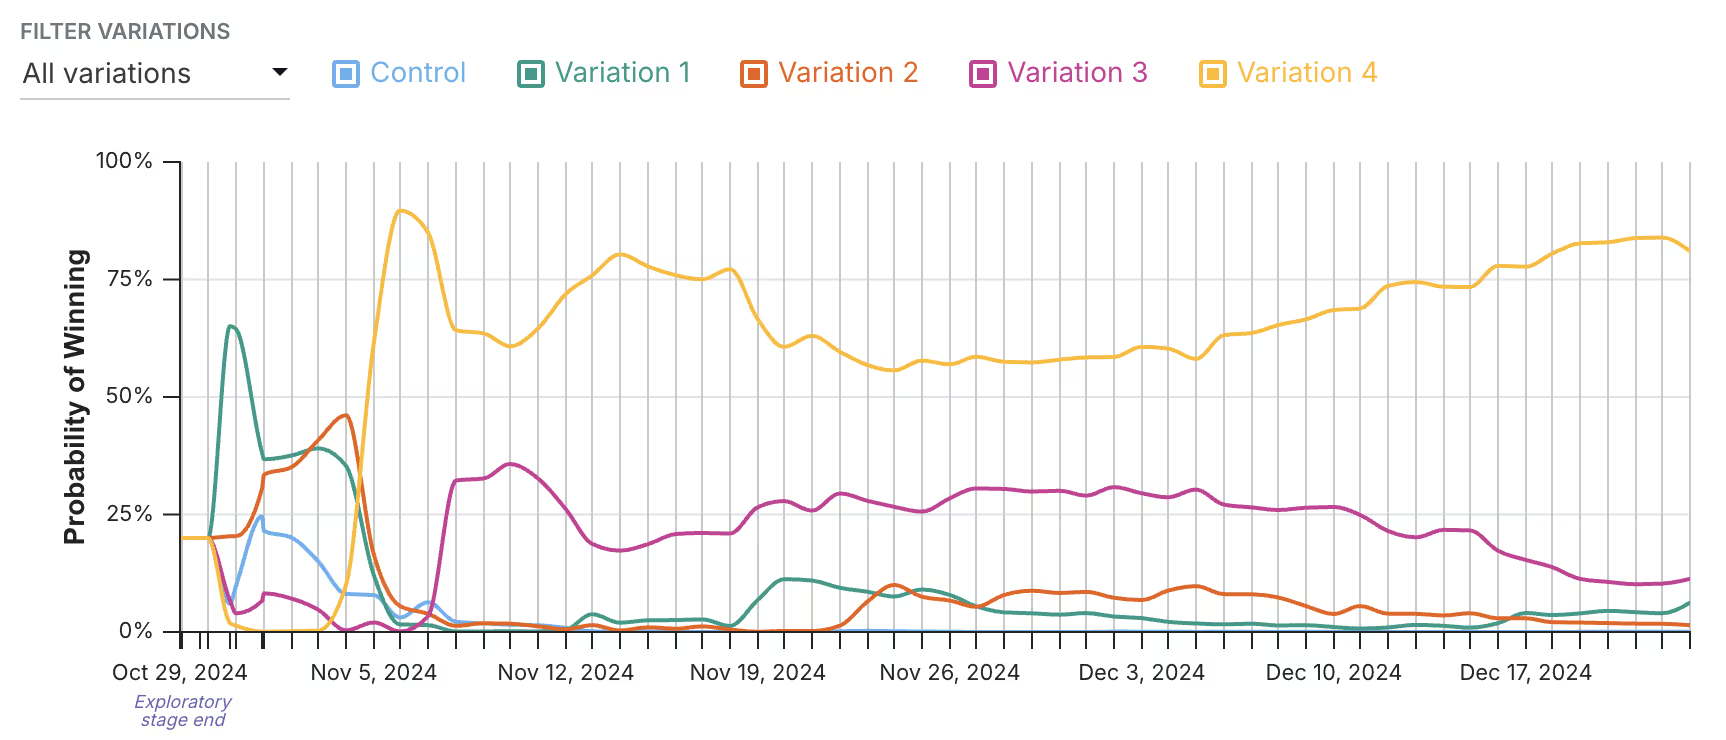
Multi-armed Bandits optimize traffic in an experiment by directing more traffic to better-performing variations. For example, you're running a week-long sale and want to test different CTAs. By the time you completed a classic Experiment, the sale would be over, and you would've lost out on sales. With Bandits, traffic automatically shifts toward the winning CTA during the sale, maximizing conversions.
This provides dual benefits: better variations get more statistical power from increased traffic, while fewer users see worse-performing options, protecting your bottom line.
GrowthBook’s Bandits stand apart from the field by ensuring a consistent user experience during the bandit and by using period-specific weighting to deal with seasonality (e.g., day-of-the-week effects) in your experiment sample. However, Bandits in general are known to suffer from some inaccuracies at providing top-level estimates of experiment lifts, so they are best suited for picking a winner among many, instead of learning precisely how much a variation outperformed another.
GrowthBook provides the experimentation tools you need
All 3 forms of experimentation, classic Experiments, Safe Rollouts, and multi-armed Bandits, use the power of randomization and GrowthBook’s state-of-the-art statistics engine to provide you with the right answers to the right questions.
Ready to choose the right experimentation approach for your next project? Get started with GrowthBook in under 5 minutes.
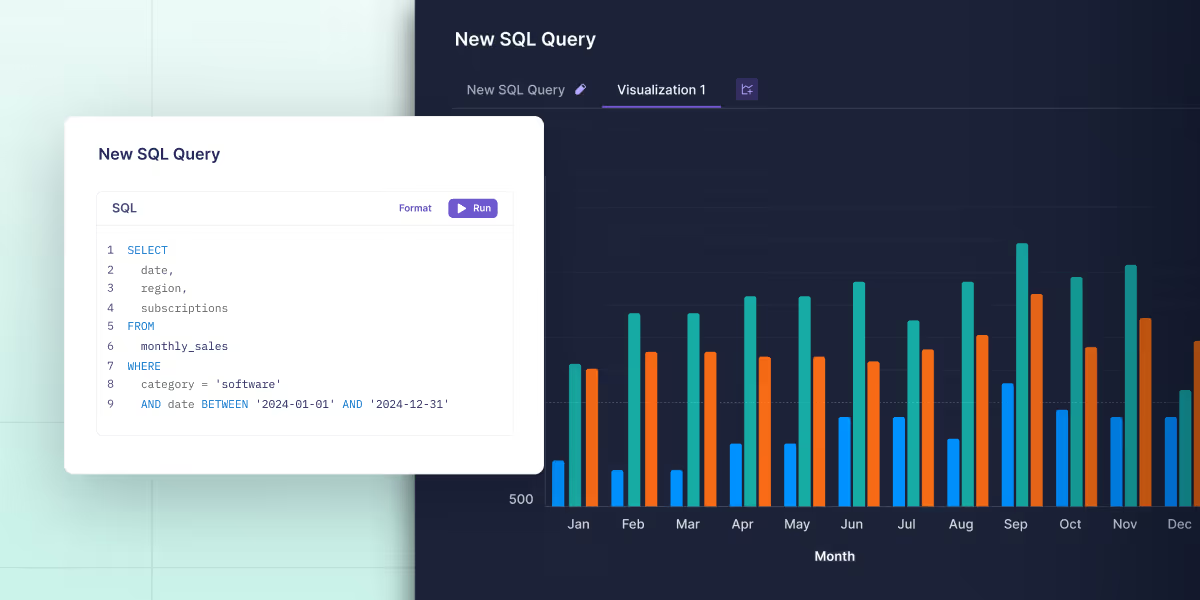
SQL explorer: time to be the Marco Polo of your data
Sometimes you need to scratch your own itch. And, when you do, it’s sooo good.
That’s what happened with our newest feature, SQL Explorer.
We found ourselves in GrowthBook always needing to run some kind of basic SQL query like checking on feature usage. It meant having to open another tool (Mode in our case) and running the query there, getting the data, and then heading back to GrowthBook. That context switching is tedious, and, if you’re not careful, you’ll find yourself in a totally different tab, reading AITAH posts.
Well, we just got a whole lot more time back because you can now run those queries right in GrowthBook with our new SQL Explorer. Its adoption has already been through the roof, so if you’re not using it, you’re likely missing out on one of our most useful new features. It’s even got us thinking: “Do we need Mode any more?”
Here are 3 common use cases to help you get started.
1. Not like the other events
It’s common to have an events table where all your events are unceremoniously dumped. It could be purchase, add-to-cart, sign-up, check-out-started, and so on. But it’s hard to know just looking at the table schema or first few rows what’s really available.
With SQL Explorer, you can just ask:
SELECT DISTINCT
  event_name
FROM
  db.public.events
LIMIT
  1000
Boom! Every unique event name. Save the query and return to it anytime to remind yourself of all your events, cherishing each of them as you do.
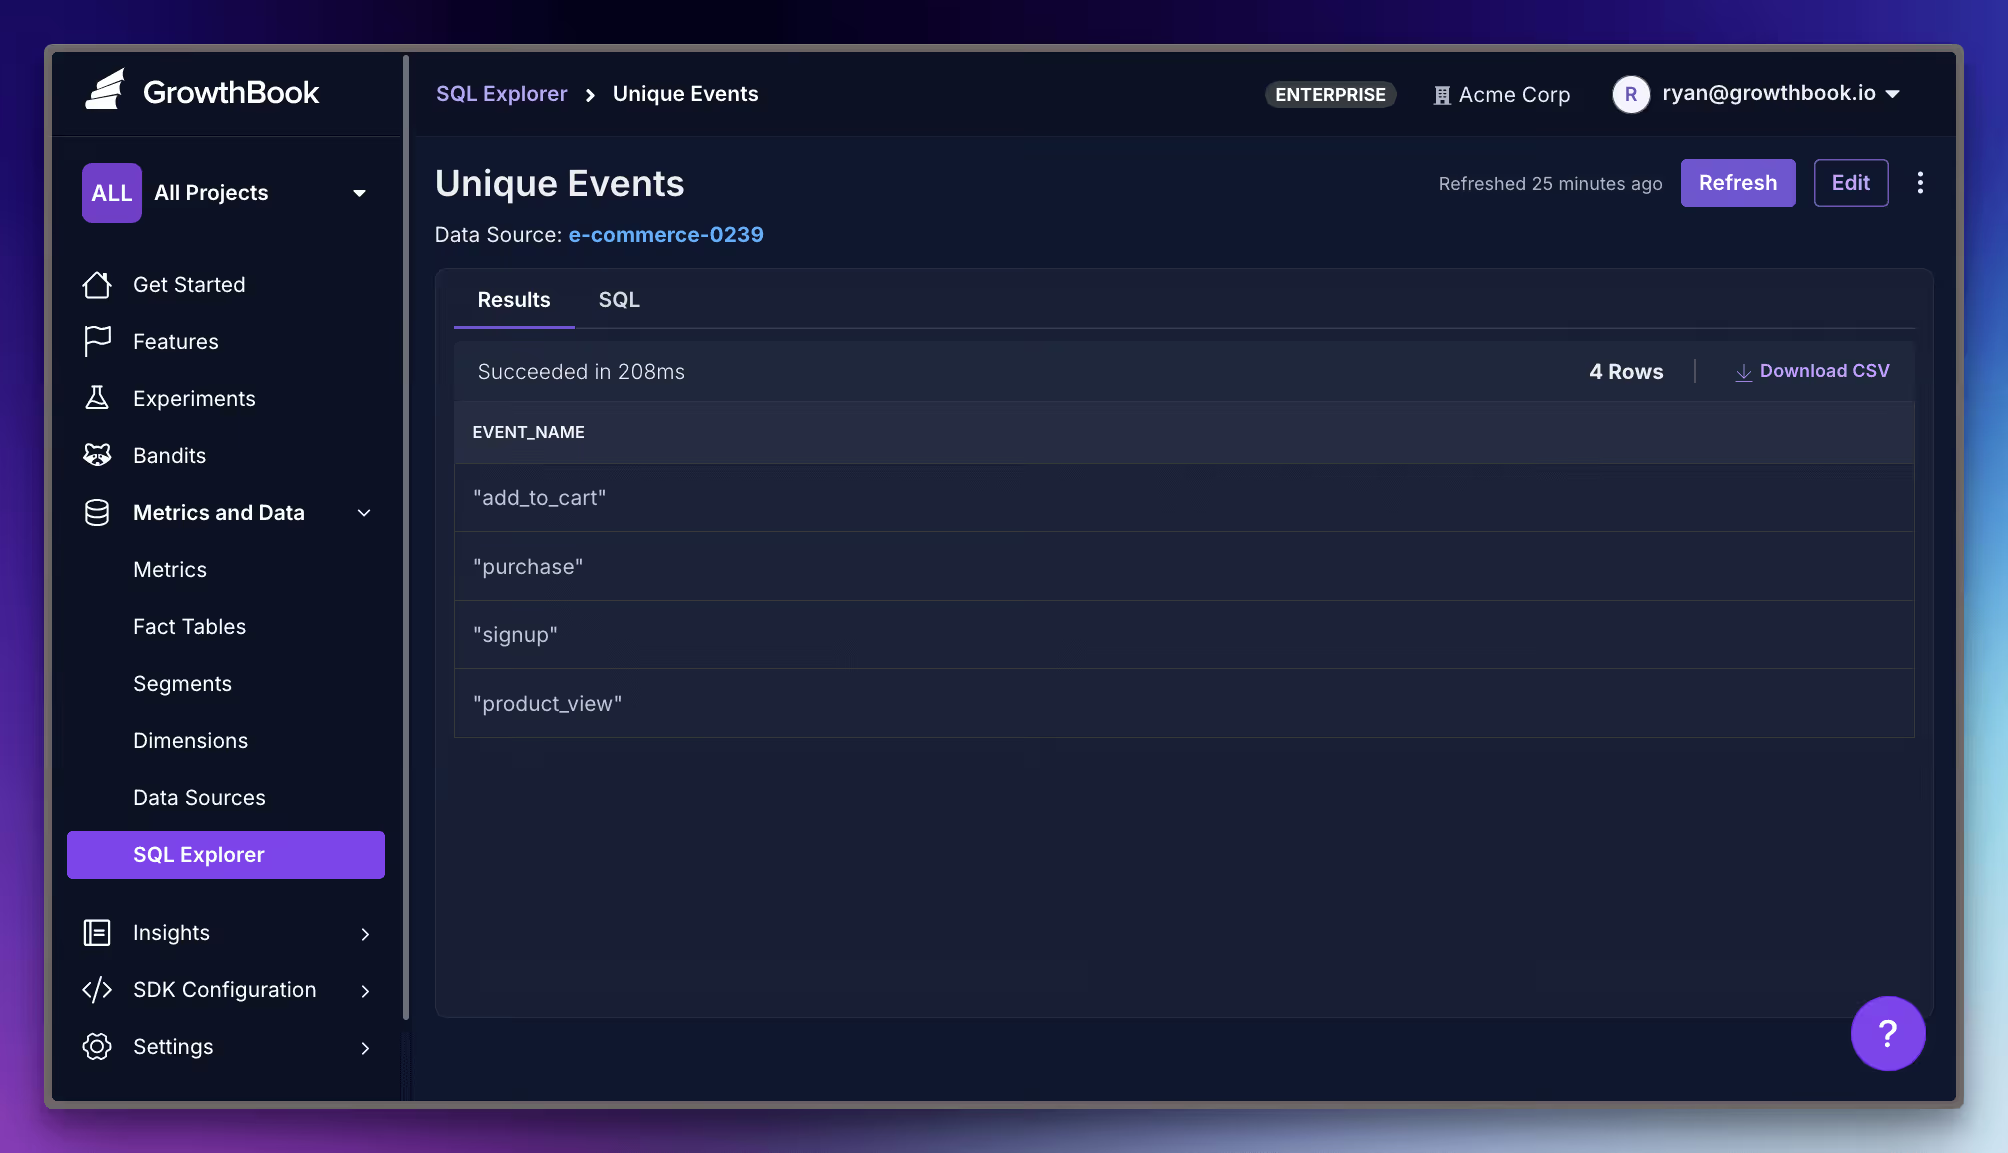
2. The business intelligence deep dive
Bob from Marketing asked Sally from Product to ask you how conversion rates are doing in Japan compared to your other markets. Lucky for them, you were already checking on an experiment in GrowthBook, so you pulled up SQL Explorer and ran this query:
SELECT
    country,
    COUNT(DISTINCT user_id) as unique_users,
    COUNT(CASE WHEN event_name = 'purchase' THEN 1 END) as purchases,
    ROUND(AVG(CASE WHEN event_name = 'purchase' THEN amount END)::numeric, 2) as avg_purchase_amount,
    ROUND(
        (COUNT(CASE WHEN event_name = 'purchase' THEN 1 END) * 100.0 /
        COUNT(DISTINCT user_id))::numeric, 2
    ) as conversion_rate_percent
FROM events
WHERE timestamp >= CURRENT_DATE - INTERVAL '30 days'
GROUP BY country
HAVING COUNT(DISTINCT user_id) > 100
ORDER BY conversion_rate_percent DESC;
You see that conversion rates are consistent across your regions, and because Bob and Sally are part of your GrowthBook org, you can just share the query directly with them, so they can investigate the data firsthand.
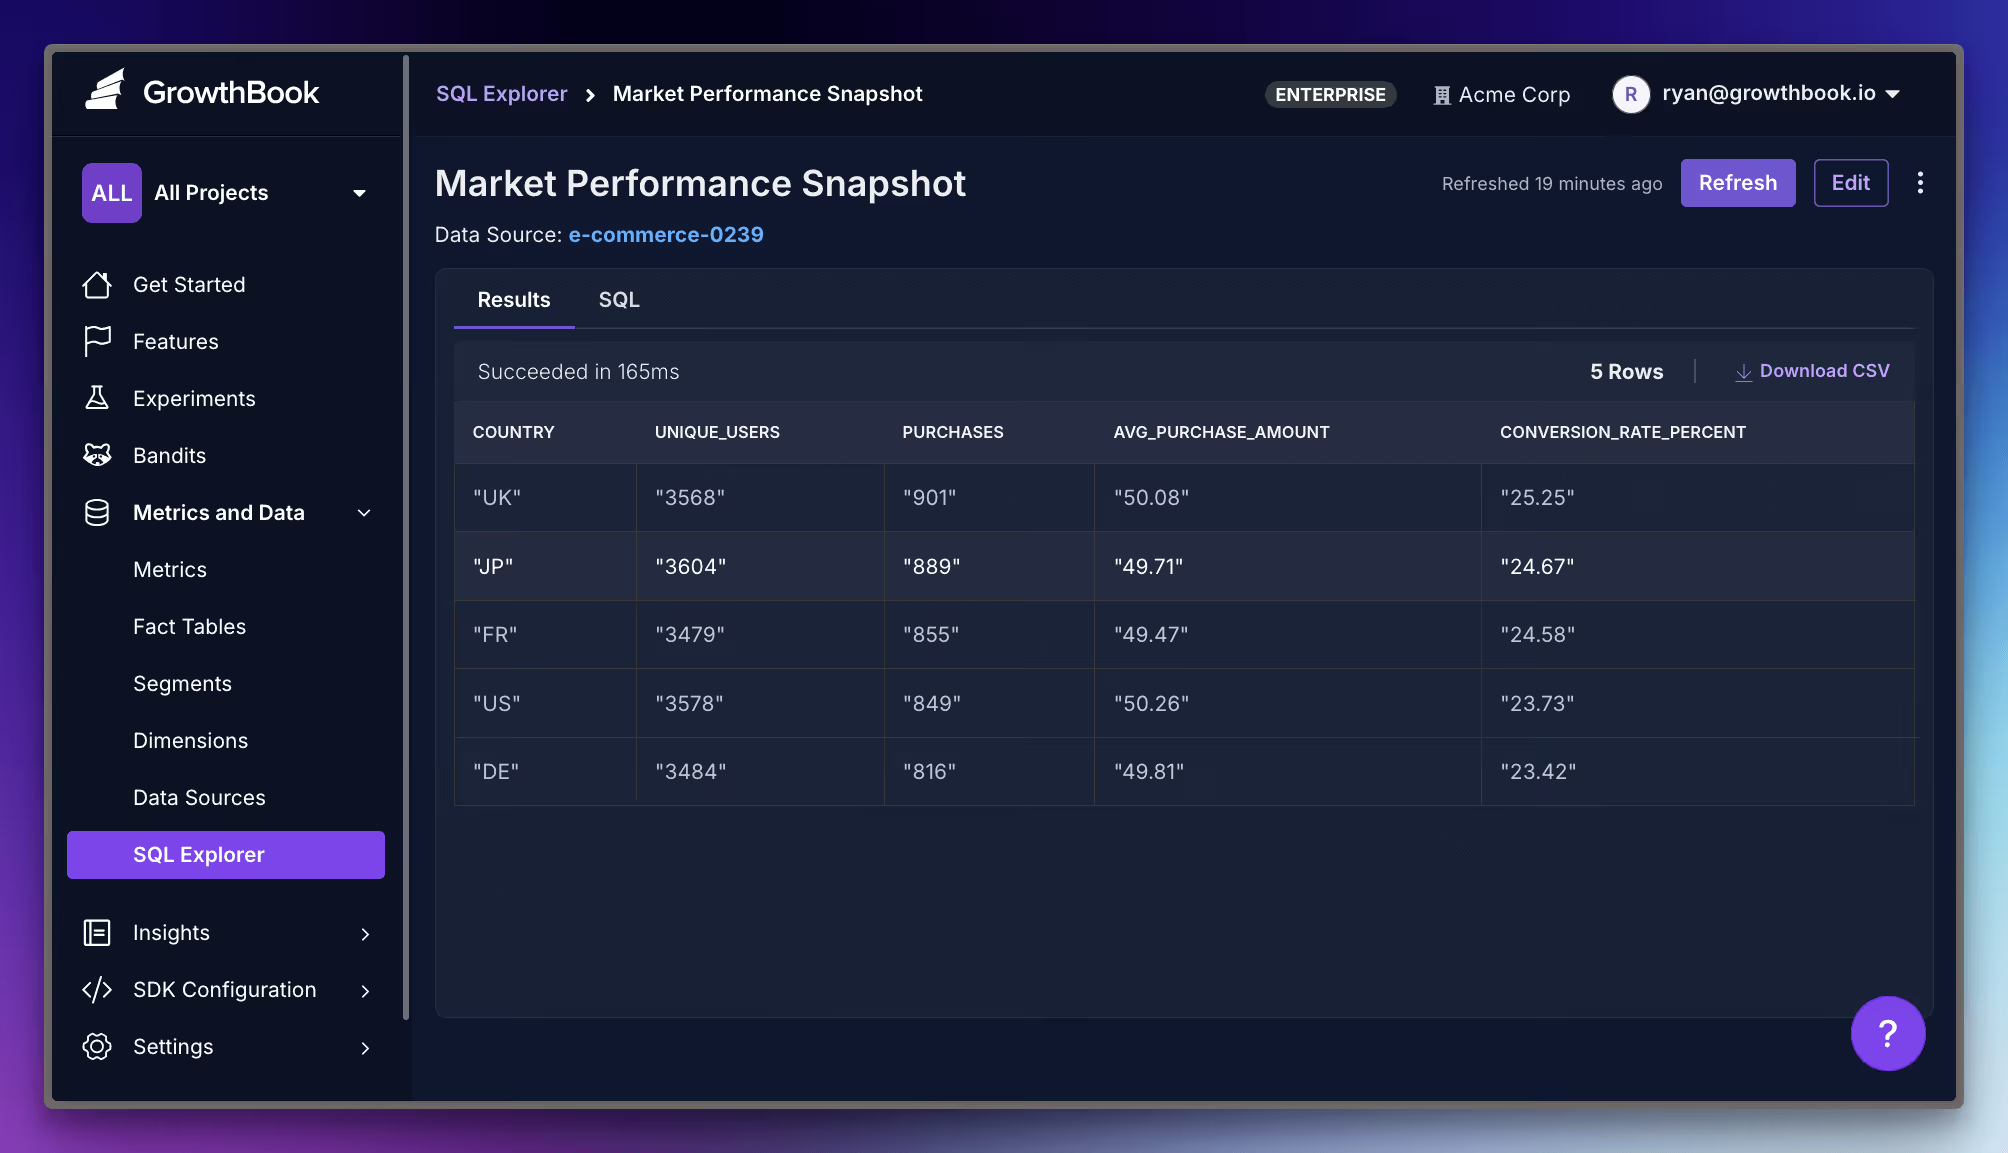
There’s no doubt Bob will invite you to his BBQ this year.
3. Look at this graph
Rows of data are fine. Who doesn’t love some good rows of data? But sometimes it’s nice to have a chart, too.
With the SQL Explorer, it’s easy to visualize any query as a bar, line, area, or scatter graph.
Imagine you want to see your funnel events from the past 30 days laid out over a gorgeous line graph. You start with the SQL:
SELECT
  DATE (timestamp) as date,
  event_name,
  COUNT(*) as event_count
FROM
  events
WHERE
  timestamp >= NOW() - INTERVAL '14 days'
  AND event_name IS NOT NULL
GROUP BY
  DATE (timestamp),
  event_name
ORDER BY
  date,
  event_name
LIMIT
  1000
Then, add the visualization. Here we choose a Line graph with the date as the X axis and event_count as Y. Finally, we set event_name as the dimension.
And now:
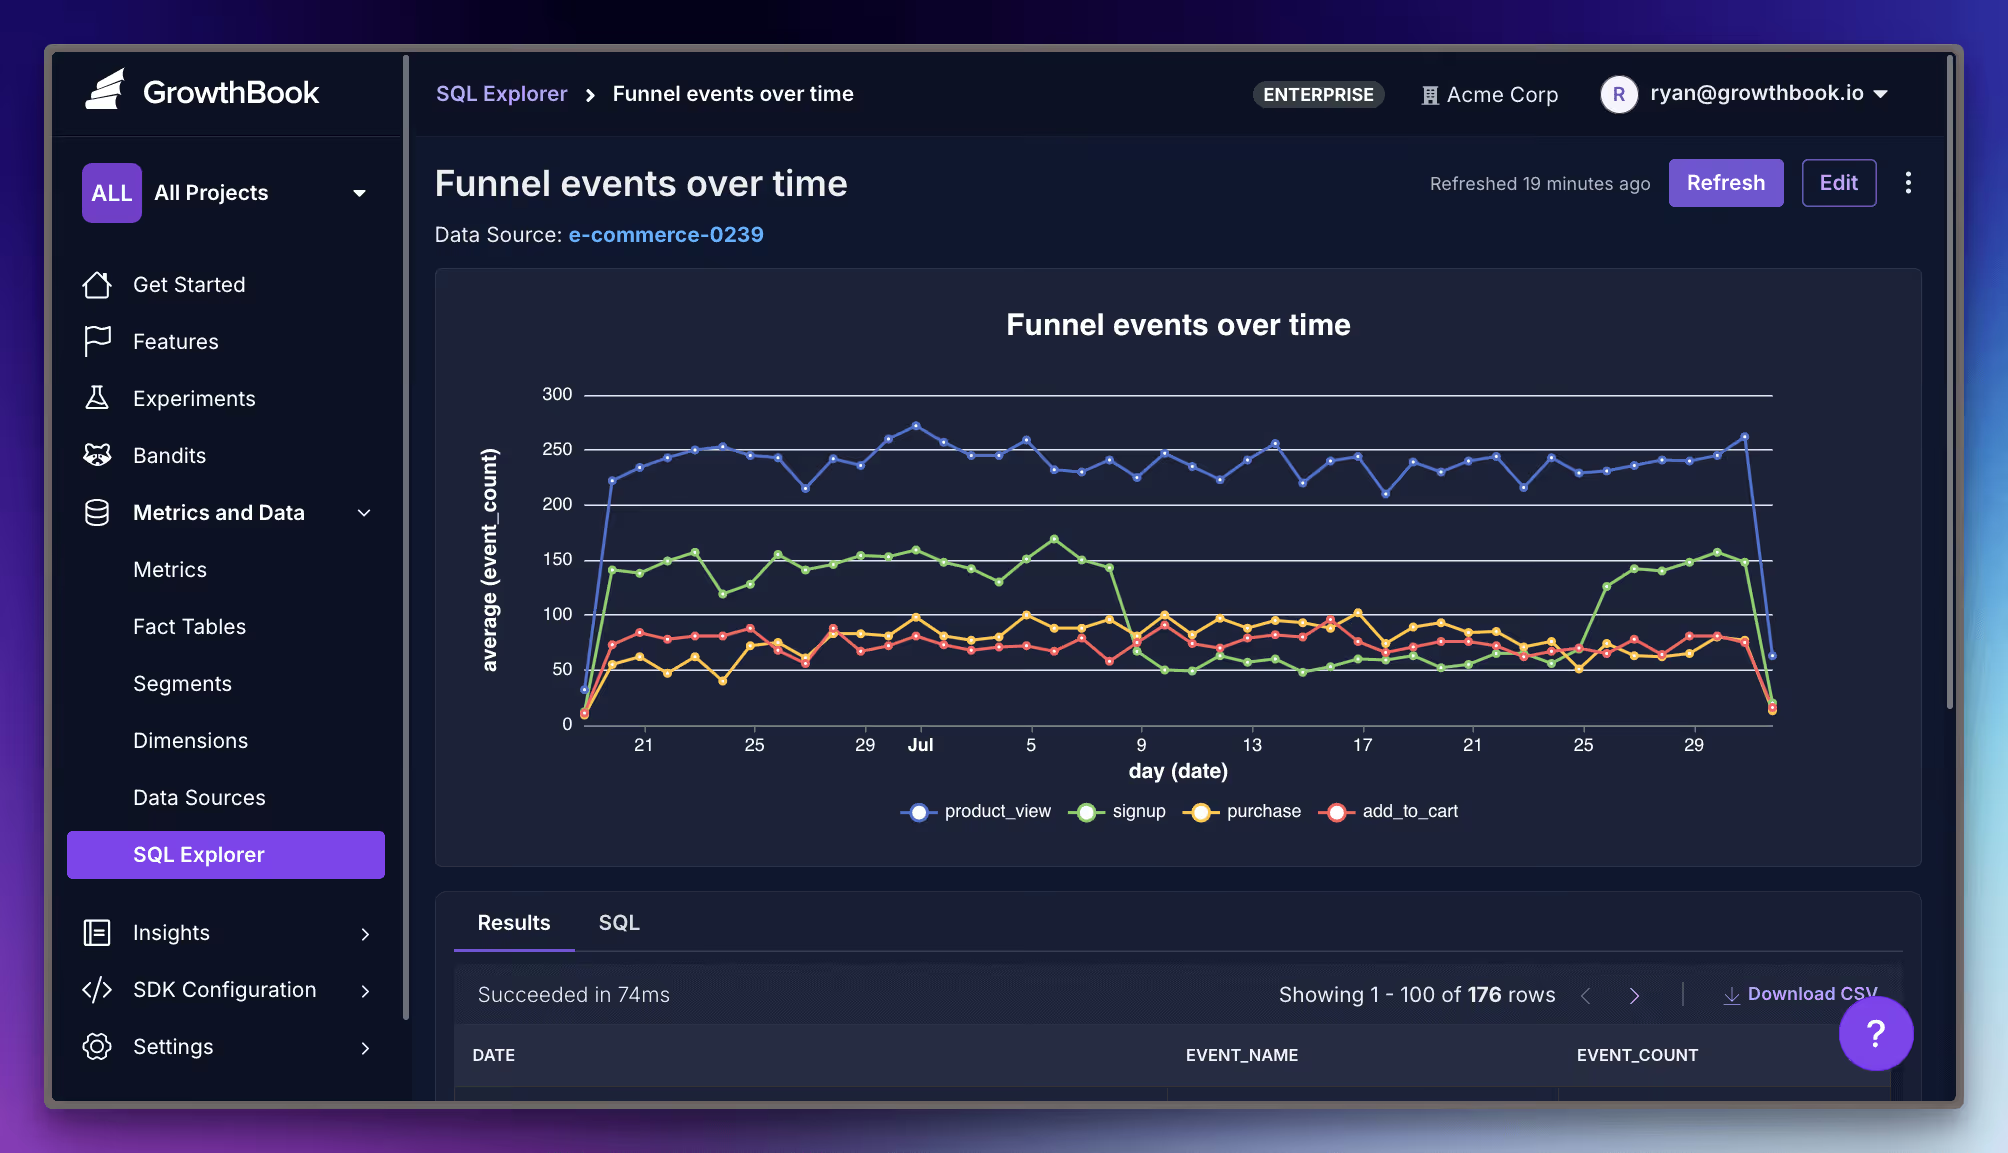
Now you’ve got a sick multi-line chart that immediately shows you if that checkout flow tweak last Tuesday did anything. It did! It made things worse.
The best part? Again, you can save this query and visualization, rerun it whenever, and Slack the link to your team. No more screenshots, Loom gloom, or Phil asking for more details on the query.
Phil, now you can just check out the query yourself, bud.
Time to explore
Your data is already accessible within GrowthBook. Why not explore it? You no longer have to fire up 15 different tools to answer some basic questions about your data.
Whether you're settling office debates about conversion rates, proving that yes, your latest feature actually is being used, or creating visualizations that make you look like a data wizard in Monday's standup, SQL Explorer has your back.
So go ahead, scratch some itches. Your future self (and Bob's BBQ guest list) will thank you.
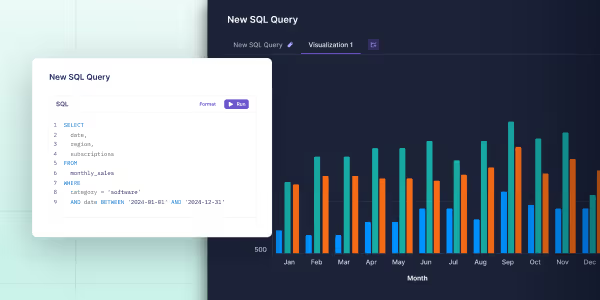

GrowthBook launch month - Week 4
Launch month continues with our Managed Warehouse product and feature flag usage analytics.
Managed warehouse
.avif)
We’ve talked to thousands of companies and seen our fair share of data warehouse and event-tracking setups. We’ve noticed 3 consistent problems:
- They are a LOT of work to set up and maintain, especially for companies without dedicated data engineers. Google Analytics + BigQuery is the most common one we see, and that takes over 40 steps to configure (yes, we counted).
- Data is often refreshed on a schedule instead of in real-time. You don’t want to wait 24 hours to find out a new feature or experiment is killing your metrics.
- Pricing and performance are optimized for batch workloads. Refreshing experiment results frequently or exploring your data can become slow and costly.
This week, we’re excited to launch our new Managed Warehouse product on GrowthBook Cloud. We set out to solve all of these issues, and we’re super happy with the results:
- One-click setup and zero maintenance. Doesn’t get much easier than that!
- Data arrives within seconds, letting you quickly detect issues.
- Queries are crazy fast and free (only pay for ingesting the data, not querying it)
Under the hood, this is powered by ClickHouse, an open-source database optimized for fast analytics at scale. You still get raw SQL access and all the other benefits of a true warehouse-native platform, just without the cost.
The first 2 million tracked events each month are free for Pro users, and we have super affordable usage-based pricing beyond that.
Feature usage analytics
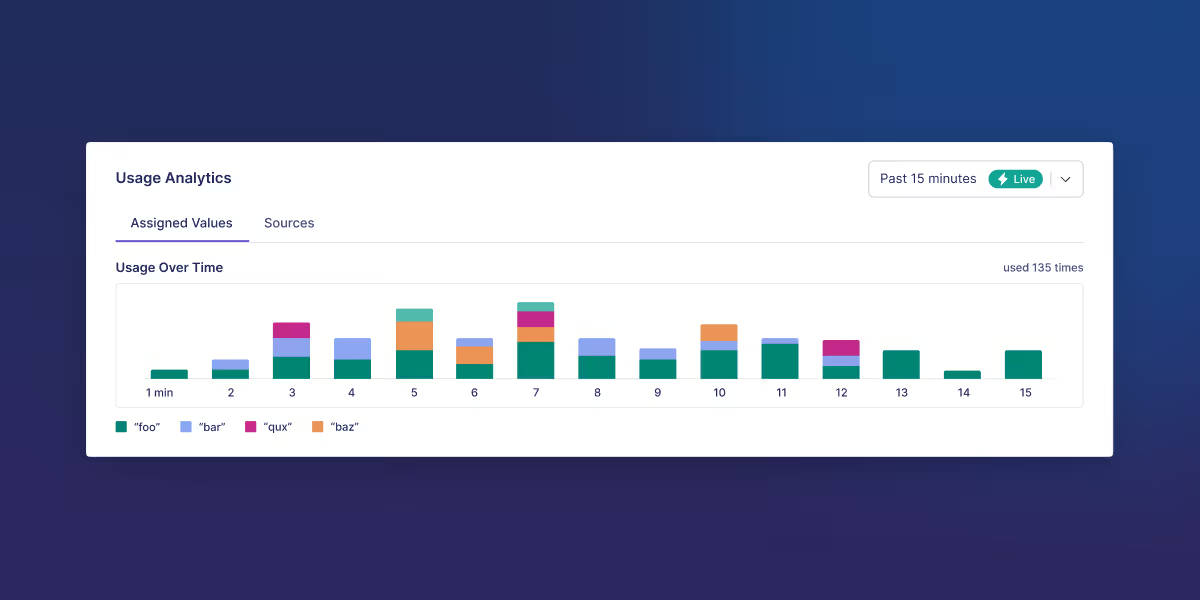
This week, we’re also launching Feature Usage Analytics, which is designed to leverage many of the benefits of the new Managed Warehouse.
For each feature flag, you can see how often it's been evaluated, which values are being served, which rules are being hit, and more. This is a game-changer for feature flag management and makes debugging issues so much faster. As an added benefit, this helps you stay on top of tech debt by highlighting stale flags that are no longer in use.
So how does it work? The GrowthBook SDK sends an event to the Managed Warehouse every time a feature flag is evaluated in your app. This usage data is then aggregated and displayed within seconds.
For now, this is only available for the new Managed Warehouse on GrowthBook Cloud, but we plan to open it up to everyone eventually. If you are interested in this, but are self-hosting (or already have a data warehouse), let us know, and we can keep you in the loop!
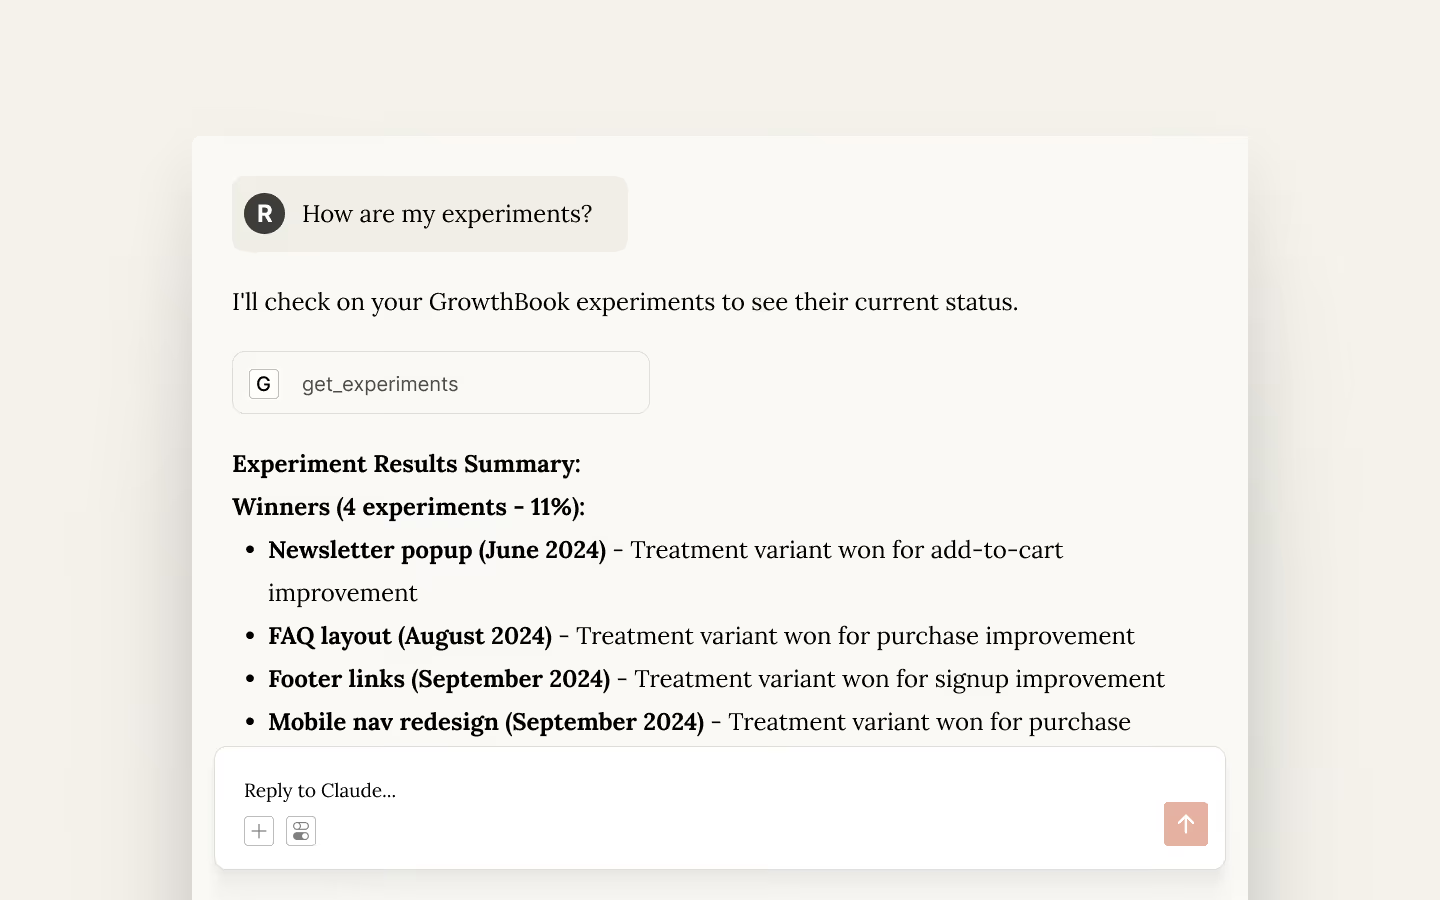
I started talking to my experiments with MCP. Here's what happened
AI is a terrible experimentation partner. It agrees with everything, suggests obvious ideas, and can’t do math. It’s an obsequious yes-man who assures you that changing the checkout button color will increase ARR by 100m.
And yet, a recent experience has me convinced it will usher in a fundamental shift in how we interact with our experimentation platforms.
Moment de sandwich
Full disclosure: I work for GrowthBook, an experimentation platform, but I don't run many experiments myself. My relationship with experimentation is like a chef who designs kitchens but doesn't cook—I build the tools, but I'm not in the trenches using them.
So when I was testing our new MCP Server (more on this shortly) with a sample data set, I wasn’t expecting any revelations. I was just doing QA, sandwich in one hand, typing into Claude Desktop with the other: “How are my experiments doing?”
Within seconds, I got back a breakdown of my last 100 experiments, sorted into winners, losers, what’s working, what’s not, and some helpful insights. For example, AI noticed November experiments tanked and connected it to holiday shopping behavior. When I asked what to test next, it suggested building on our mobile checkout wins. Nothing groundbreaking, but not terrible advice either.
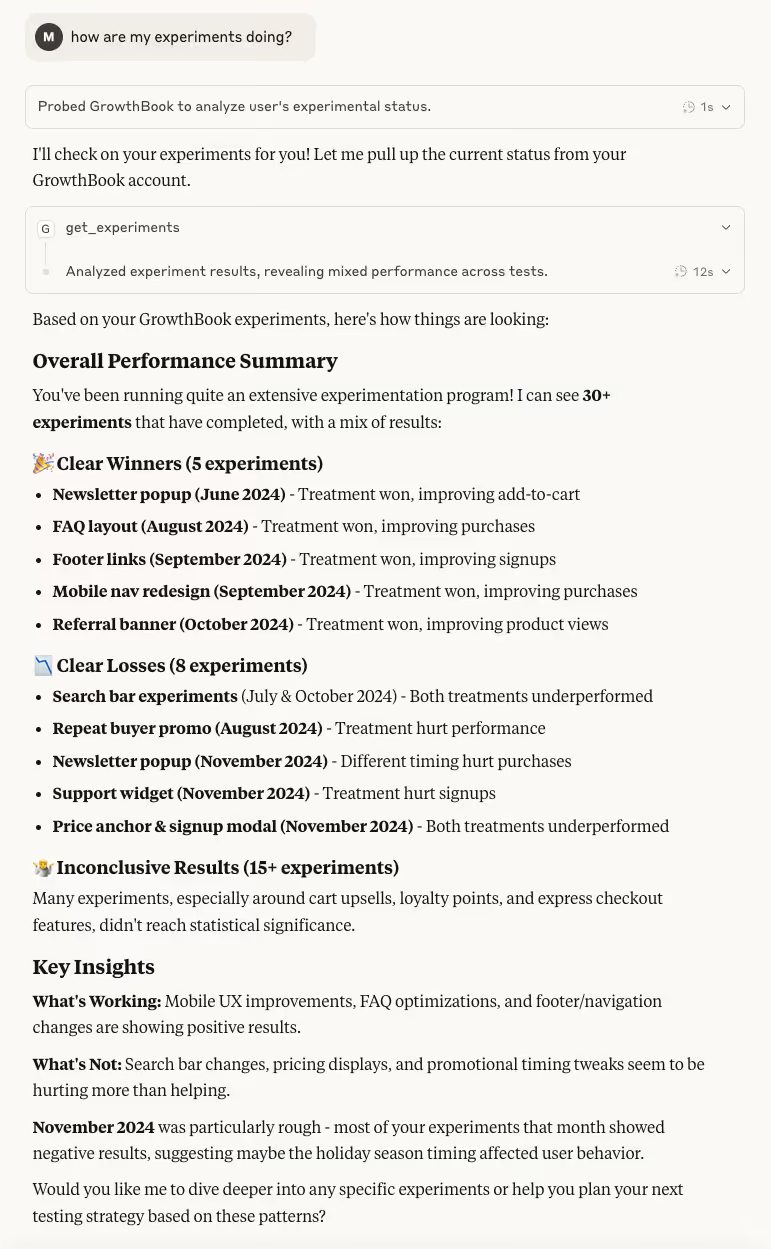
Watching this all unfold in a chat window, though, was a revelation. There wasn’t any navigation, clicking, form fields, or context switching. It made me question the expectation that experiments need to come to the platform. What if the platform came to them instead?
MCP makes it possible
You can’t just go to Claude or ChatGPT or any AI tool, ask how your experimentation program is doing, and expect an answer. It doesn’t have that information by default (and nor should it). What made it possible was the Model Context Protocol, or MCP.
The engineering world has been abuzz about MCP, which is an open standard for connecting AI tools to the “systems where data lives.” This phrase comes from Anthropic, which developed the standard and announced it in late November 2024. More concretely and in the context of this article, MCP makes it easy to connect AI tools like VS Code, Cursor, or Claude Desktop to your experimentation platform and the data that powers it.
I was able to ask nonchalantly about experiments because I had added GrowthBook’s MCP Server to Claude Desktop, which let the bot fetch my latest experiments and summarize the results. From there, using the same chat window, I could follow up with any question I wanted (even those I might be too self-conscious to ask our team’s data scientist).
But the party doesn’t stop there, especially when the MCP server is used in a code editor. Compare these processes for setting up a feature flag with a targeting condition:
- The old way: Open GrowthBook, create a flag, fill fields, add targeting rules (eight clicks, three form fields). Switch to the code editor. Add flag. Forget the flag name. Switch back. Check the docs. Update the code again.
- With MCP: Highlight code. Type: “Create a boolean flag with a force rule where users from France get false.” Done. Flag created, code updated, and no context switching required.
But MCP isn’t the death knell for experimentation platforms (which is great for me, as someone who works for one). Rather, it’s their evolution from rigid applications to fluid infrastructure. Sometimes you want a conversation, but other times it’s a dashboard or precise dropdowns with every option visible. The breakthrough is accessing your experimentation platform in whatever mode fits the moment.
What changes when platforms become fluid
What is it about experimentation via chat that’s so compelling? It feels natural. Julie Zhuo, former VP of Design at Facebook, explains that it combines two interactions every human already knows—speaking naturally (since age two) and texting (25 billion messages sent daily). No learning curve or docs to read. Just describe what you want.
This matters more than it seems. Every dropdown menu, config screen, and nested navigation is a micro-barrier between thought and action. Conversational interfaces remove that friction entirely.
This opens up the possibility of experimentation in media res. Customer interview reveals a pain point? "Create an experiment testing whether removing this friction improves activation." Done, before the meeting ends.
When your platform is ambient—available through conversation, IDE, Slack, wherever—the gap between conception and execution becomes negligible.
Reality check
And yet. AI is still a terrible experimentation partner:
- It's too agreeable. It'll encourage any idea, with the goal of pleasing you rather than improving your experimentation program. AI optimizes for your satisfaction, not your success rate.
- Precision is optional. During a breakout session at Experimentation Island 2025 on experimentation and AI, there was a consensus: AI has many uses in experimentation, but analysis isn't one of them. It often calculates based on vibes and shows its work post hoc, which it generates purely to please you (see point 1).
- Complex operations overwhelm it. We tried adding full experiment creation to the GrowthBook MCP Server. It failed. Too many inputs (randomization unit, metrics, variants, flags, environments) in specific sequences. The AI would skip steps or force you to type every parameter, which defeats the purpose.
But like the first iPhone shipping without features we now deem indispensable (copy and paste, app store, video), these are temporary limitations. Prompts can be engineered, analyses can be improved, and MCP has been evolving quickly. (They recently introduced “elicitations” for handling complex multi-step inputs like those involved in experiment creation.)
The platform paradox
This isn’t just about making experimentation easier (though it does). It’s about changing when and how experimentation happens.
Right now, experimentation is something you do at your desk, in your platform, during "experiment planning time." Tomorrow, it'll be woven into every moment where product decisions happen. Code reviews, customer calls, shower thoughts—wherever ideas emerge, your experimentation platform will be there, in whatever form you need.
Ironically, as experimentation platforms become more fluid, they also become more essential.
When you can create tests from anywhere, you need a rock-solid infrastructure ensuring those tests are configured correctly and run flawlessly. When anyone can launch an experiment through chat, you need sophisticated governance and guardrails. The possibility of such fluid interactions means that the platform actually needs to do more. It’s the paradox of invisible infrastructure—the more seamless it is to use, the more sophisticated it must be underneath.

The future isn't conversational AI replacing experimentation platforms. It's experimentation platforms becoming fluid enough to meet us wherever we are—through conversation when we're exploring, through visualizations when we're analyzing, through precise controls when we're configuring.
We get a preview of this future with MCP. Yes, it’s imperfect, occasionally frustrating, and limited in some crucial ways, but it’s also genuinely magical when it works. See what I mean by trying out our MCP Server with any of your favorite AI tools. Create flags with a single sentence or check experiments while having a sandwich. Ask the crazy questions you've been holding back. Feel better about yourself after hearing some of AI's god-awful test ideas.
When we build our platform, we obsess over features, workflows, and user journeys. We operate on the (admittedly reasonable) supposition that users need to come to the platform to experiment. My sandwich moment showed me a different foundation, one where the platform comes to you, so experimentation happens without the weight of “doing experimentation.”
Install GrowthBook MCP Server and experience it yourself.

GrowthBook launch month - Week 3
For week 3 of our Launch Month, we’re excited to announce the SQL Explorer!
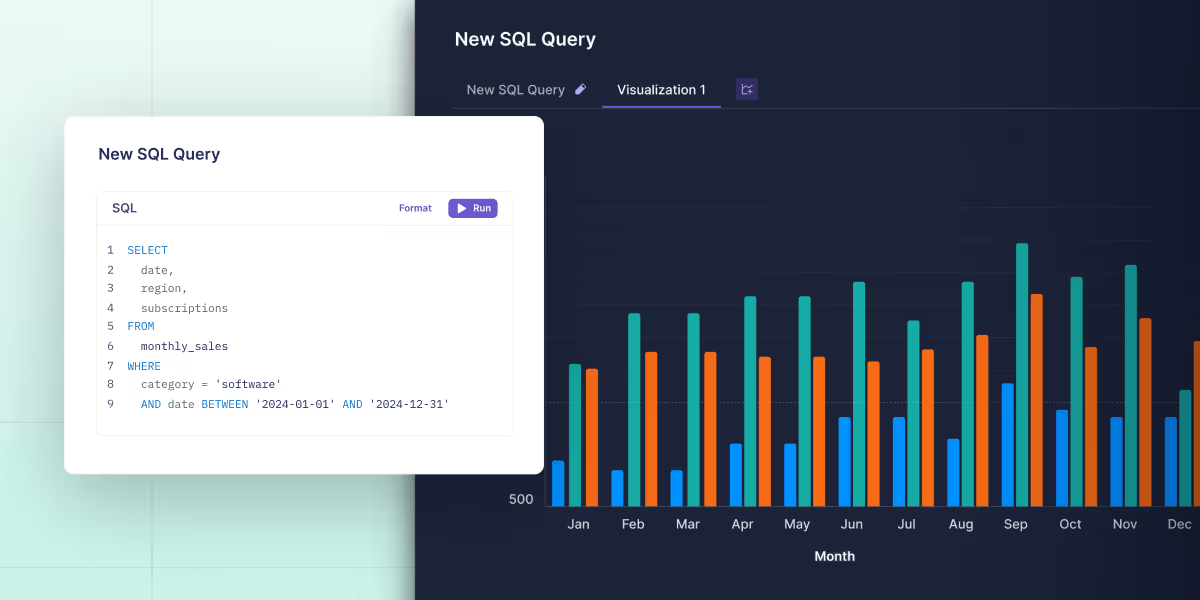
At GrowthBook, we love dogfooding our product (most of our launches this month started behind feature flags). Along the way, we kept running into a common frustration: answering simple data questions meant jumping into separate tools like Looker, Mode, or Tableau—just to write some quick SQL or generate a basic chart.
All of that context switching adds up, which is why we built SQL Explorer—a lightweight, built-in SQL editor that lets you query your data, create visualizations, and save results right inside of GrowthBook. It’s perfect for quick analyses without the overhead of a full BI platform. Check it out and let us know what you think.
We’ll be adding more features and integrating the SQL Explorer more deeply in the product in the coming weeks, so keep an eye out!

GrowthBook launch month - Week 2
This week is all about insights, the brand-new section in our sidebar. In there, you’ll find a revamped Executive Dashboard, new Learnings and Timeline pages, plus some powerful metric analyses to help you get the most out of your experimentation program. This section becomes more useful the more experiments you run, so if you need an excuse to run more tests, this is it!
Executive dashboard

The brand new dashboard gives you a 10,000-foot view of your organization’s experimentation program. Quickly see your team’s velocity, win rate, and impact. Enterprise users can also select a metric to see the cumulative effect of all experiments run. Everything can be filtered by project and date range.
Learnings

The Learnings page is a searchable knowledge base of every experiment your team has completed. For each experiment, see the winning variation, a summary of results, and other key details. This page is a great place for new team members to learn about what has been tried and what has and hasn’t worked.
Fun fact: This was the original reason we started GrowthBook and how we got our name. We envisioned a digital book of everything you’ve learned about growth.
Experiment timeline

The Timeline page lets you visualize when experiments were running relative to one another. Experiments are color-coded by status (running, won, lost, etc.) and split up by phases. This is a valuable tool for managing your experimentation workflow, identifying bottlenecks in your process, and planning future tests.
Metric effects

Do a deep-dive for a given metric and see the range of effect sizes from all the experiments that included it. Use this to learn how easy/hard it is to move your metric in general and see which specific experiments had the biggest impact (both good and bad).
Metric correlations
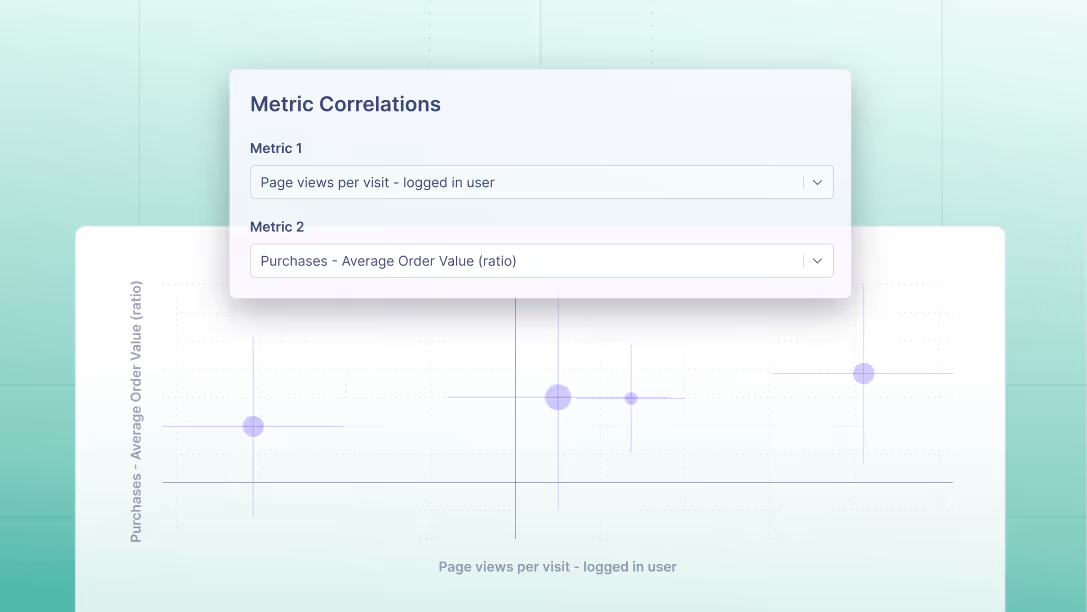
See how any 2 metrics tend to move in relation to each other within experiments. This is especially useful for identifying proxy metrics that are highly correlated with your long-term goals, but can get you results much faster.
We hope you find these new pages useful, and we look forward to hearing your feedback. See you again soon for our Week 3 launches!

GrowthBook launch month - Week 1
We have so many exciting projects we’re working on, we decided to do something a little different for this next release. June will be our official Launch Month! Every week, we’ll announce major new features and changes to GrowthBook that you can try out early, before the final release at the end of the month.
Let’s kick things off with the Week 1 launches:
GrowthBook MCP server

We launched the first-ever MCP server for feature flagging and experimentation! MCP (Model Context Protocol) allows AI tools to communicate and do actions directly with services like GrowthBook. Now you can use AI to create feature flags, check experiment results, clean up stale code, and more, directly within your IDE. Read our announcement blog post for more info and a demo.
Even safer rollouts
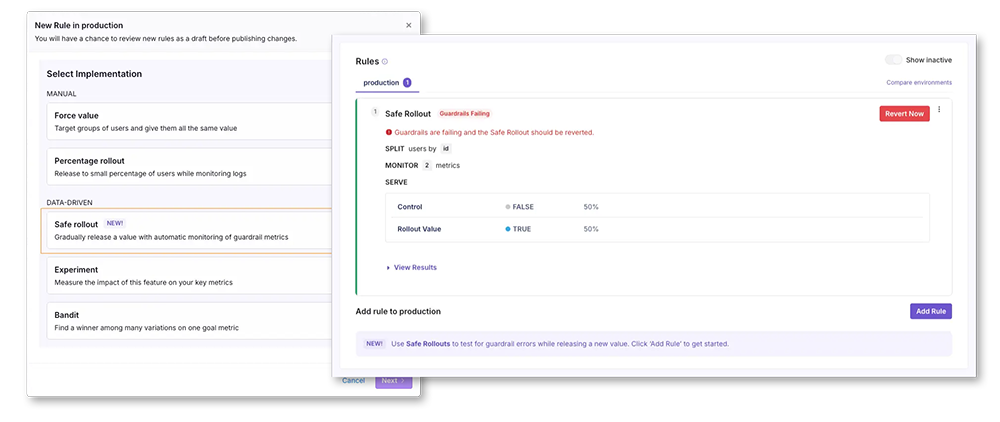
We made three big changes to Safe Rollouts to make them even safer:
- Traffic now gradually ramps up from 10% to 100%
- Results are checked more frequently at the start of a Safe Rollout (and less frequently the longer it’s running)
- There’s a new setting to automatically roll back if any guardrails are failing or the data looks unhealthy
When combined, these changes help make your rollouts even safer by minimizing the user impact when things go wrong. As always, you can learn more about this in our docs.
Custom decision criteria
.png)
You can now customize the logic that powers our Experiment Decision Framework on a per-experiment basis.
- Clear Signals (the default) - Ship only with clear goal metric successes and no guardrail failures.
- Do No Harm - Ship so long as no guardrails and no goal metrics are failing. Useful if shipping costs are very low.
- Custom - Define your own fully custom decision criteria logic using our intuitive UI.
Check out our docs for more information.
Search filters

We’ve revamped the search experience within GrowthBook to make it easier to find feature flags and metrics. Easily filter by project, owner, tag, type, and more. The best part is that all of your filters are encoded in the URL, so once you find a view you like, you can easily get back to it or share it with your team. We’ll be rolling this out to other parts of the app soon.
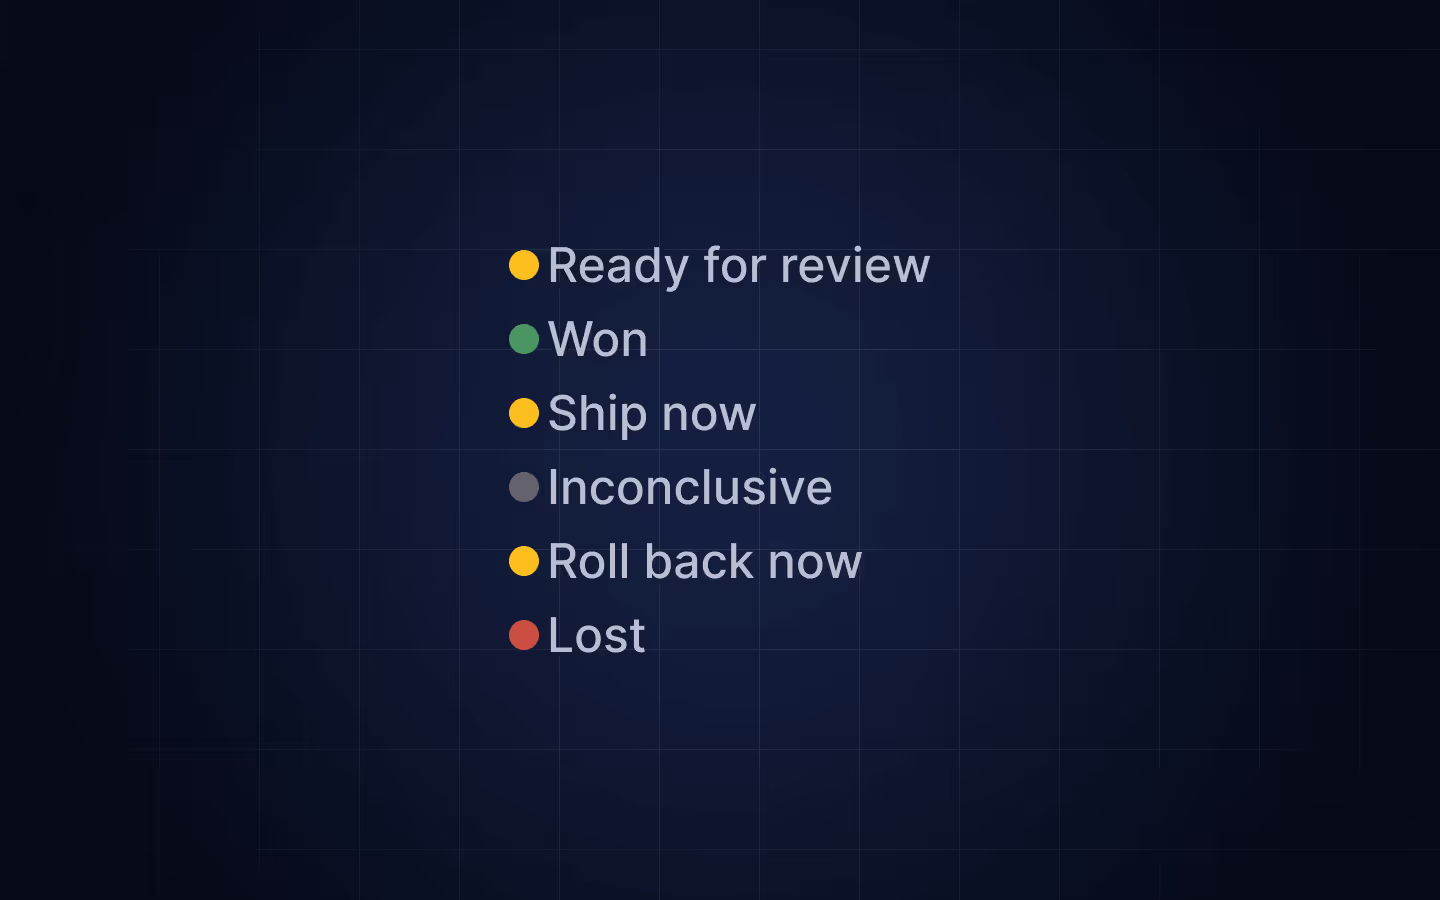
Experiment decision framework for automated shipping recommendations
Experimenters often look at their experiment results and are unsure if there’s enough data to make a decision or what decision they should make. They’re often left asking: "Should I keep running my experiment?" and "Do my results meet my success criteria?”
The Experiment Decision Framework (EDF) solves this by automating both decisions. It’s a set of customizable settings that automatically determines when your experiment has collected sufficient data and recommends what to do based on your predefined business criteria.
How it works
Target Minimum Detectable Effects (MDEs): Set the smallest effect size worth detecting for each metric. If a 2% conversion improvement isn't meaningful for your business, set your target MDE to 5%. The framework only renders decisions when you have enough statistical precision to reliably detect your target effect.
Decision Criteria: Define shipping logic before you see results. Examples:
- Ship if all goal metrics are statistically significant and positive
- Ship unless any guardrail metrics are statistically significant and negative
- Custom rules based on your business logic
Automated Status Updates: Your experiment shows exactly where it stands:
- "~7 days left" - Need more data to reach target precision
- "Ship now" - Results meet your shipping criteria
- "Roll back now" - Results meet your rollback criteria
- "Ready for review" - Mixed results requiring human judgment
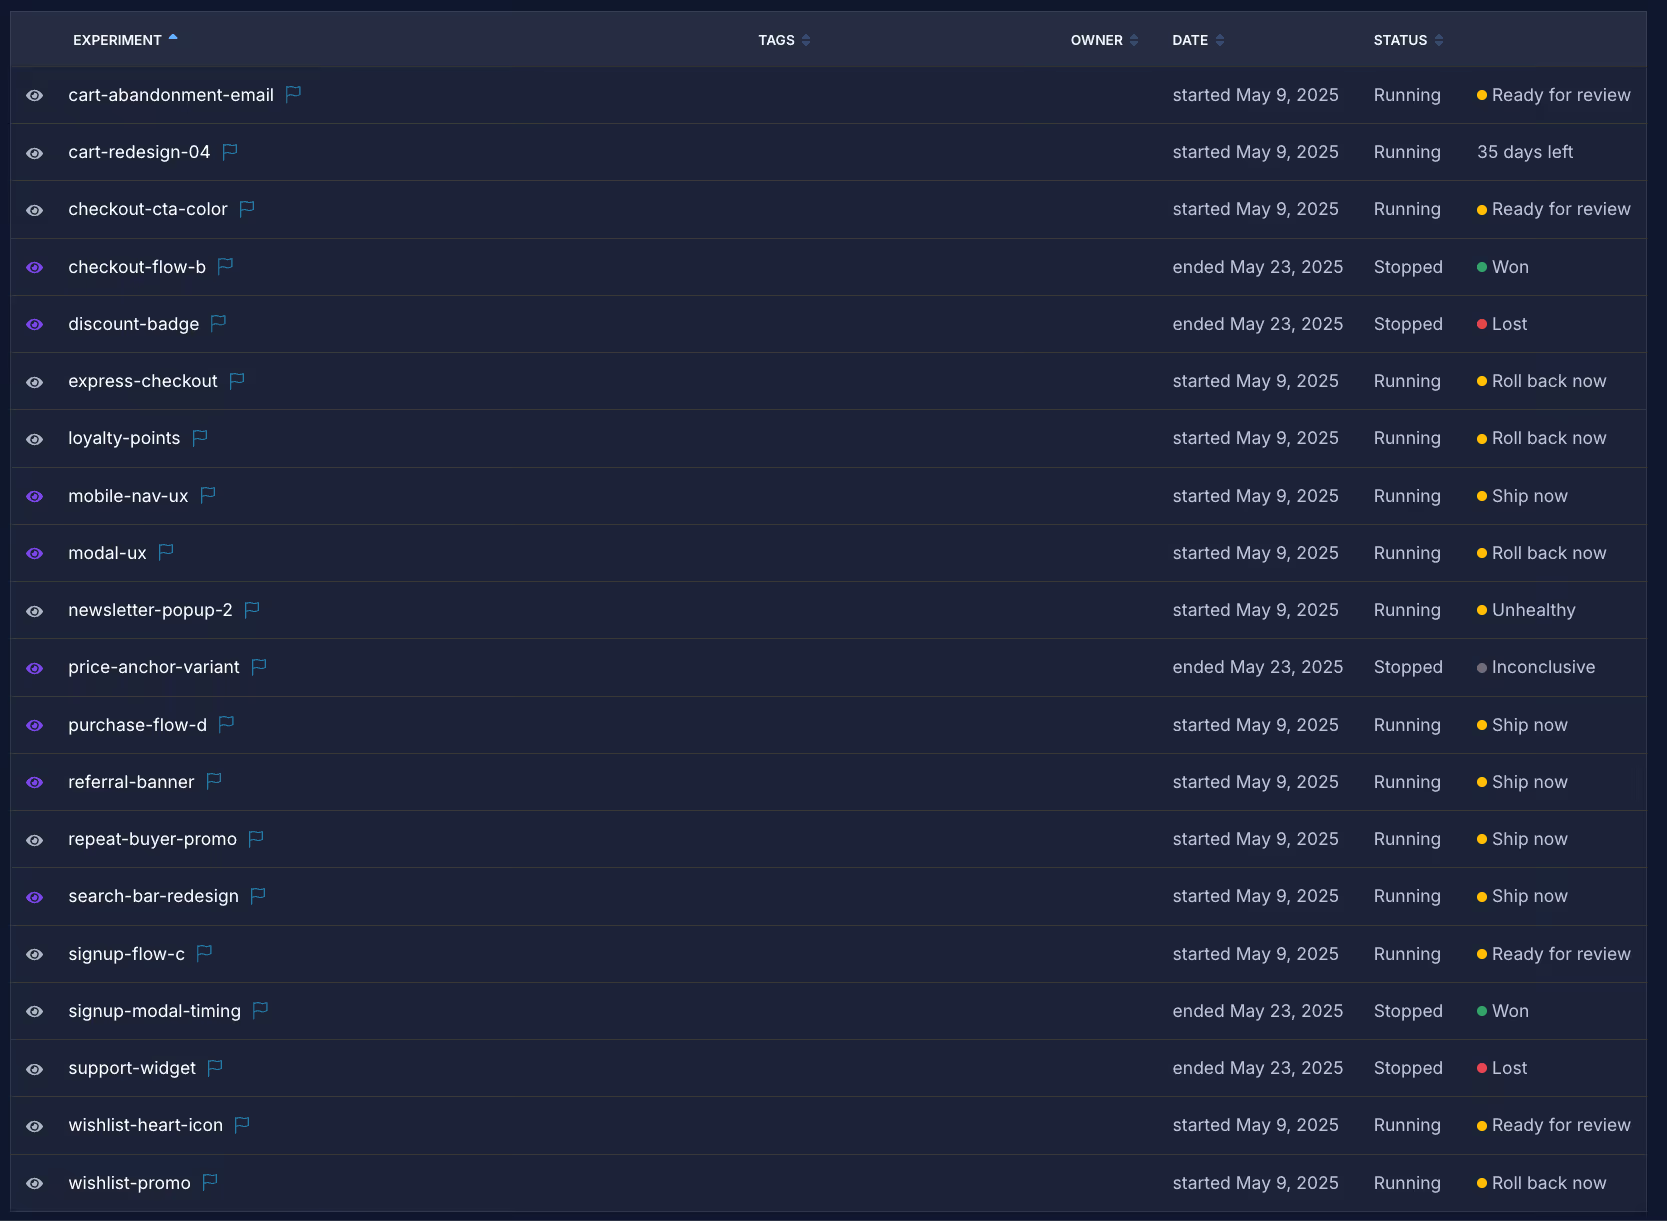
Real example
You're testing a checkout redesign with a 5% target MDE for conversion rate:
Day 10: Confidence interval of +3% to +11% for conversion rate Status: Ship now
Reasoning: Goal metric is statistically significant and beneficial under "Clear Signals" decision criteria
The framework determined you have sufficient precision (interval width corresponds to your 5% target MDE) and the result meets your predefined shipping criteria.
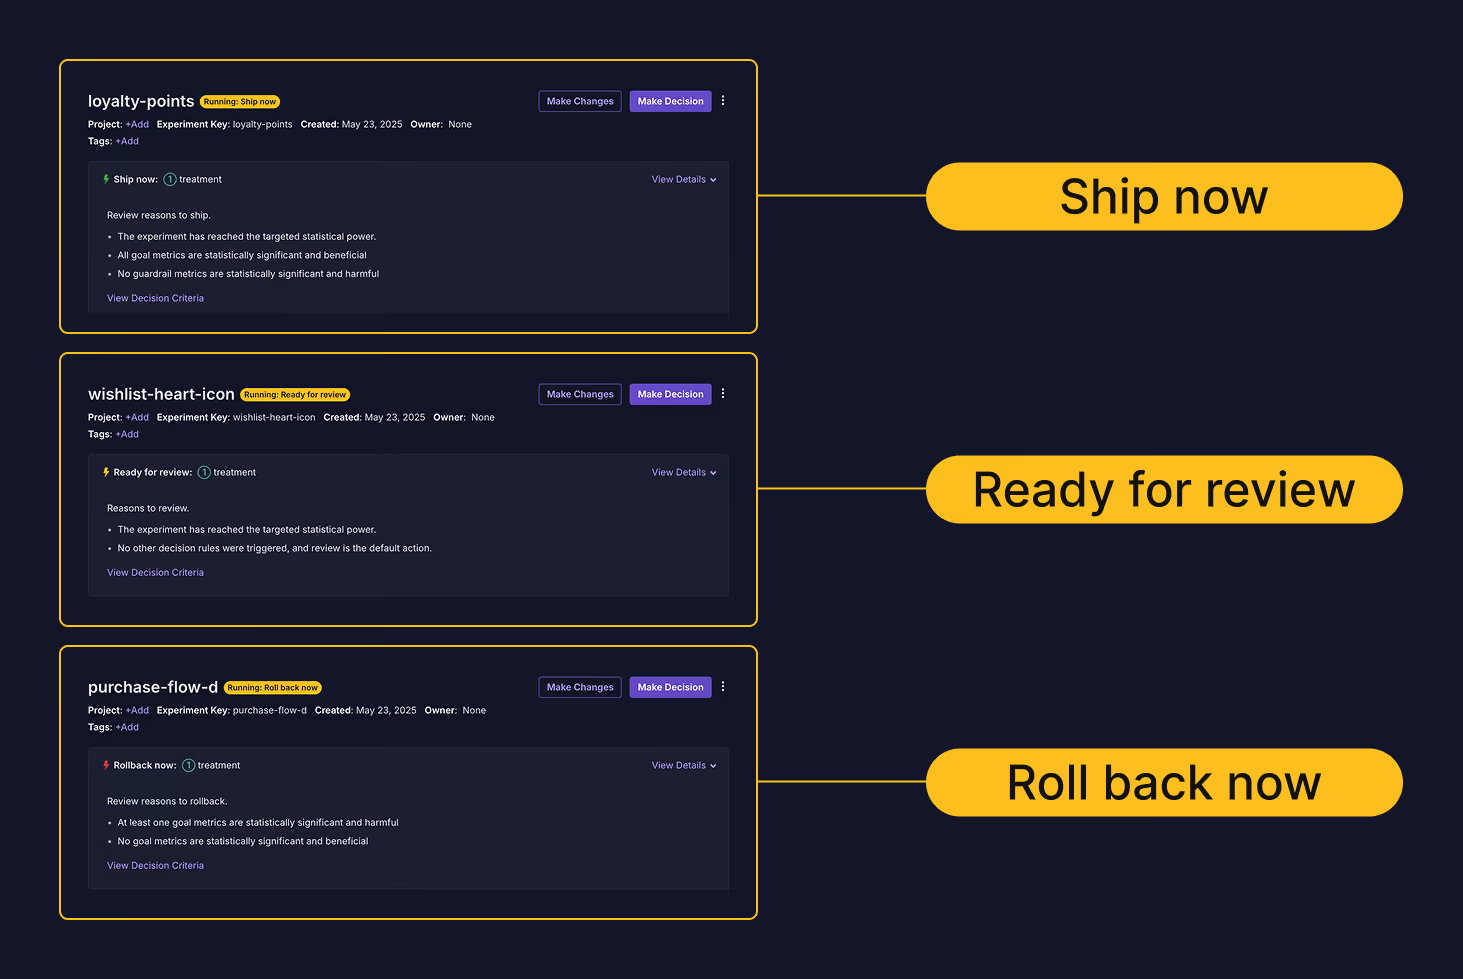
What this fixes
False positives: Teams that ship as soon as an experiment reaches statistical significance, instead of waiting for a certain sample size, suffer from the peeking problem which results in too many false positives.
Inconsistent shipping decisions: Without predefined criteria, teams make different decisions on similar results depending on business pressure or personal bias. Setting criteria upfront eliminates this inconsistency.
Low-powered experiments: Many teams run experiments that can't reliably detect the effects they care about. Target MDEs force you to think about what's actually worth measuring
Setup
Available in Settings → General → Experiment Settings for Pro and Enterprise customers. Set organization defaults for target MDEs and decision criteria, then customize per experiment on the Experiment Overview tab.
The framework works best with 1-2 goal metrics. More metrics dramatically increase the time needed to reach target precision across all metrics.
Implementation notes
The decision framework uses your existing experiment data and statistical engine. It doesn't change how you run experiments—it just adds structured decision-making on top.
You can override target MDEs per metric and switch decision criteria per experiment. The framework respects your minimum experiment runtime setting and won't show decisions during early data collection periods.
The EDF is available now. Questions about implementation or edge cases? Reach out—we'd like to hear how you're using it.
📄 Check out the Experiment Decision Framework docs to learn more about how to set it up for your team.

Find flags faster with search filters
You’re trying to find a flag but can’t for the life of you remember its name. You know it’s related to the new settings menu, but nothing’s coming up when you search your organization’s hundreds of flags created by different team members over the past few months.
You do remember that it’s a number flag, tied to an experiment, and currently on in production. With Search Filters, that’s all you need. Filter by type, rule, status, and more to narrow hundreds of flags down to just the 15 that match…
And there it is! You find the elusive new-config-menu flag.
Search Filters aren’t just for one-off hunts. They make it easy to find stale flags, live production toggles, and any flag with an experiment, force rule, or safe rollout. It’s a faster, cleaner way to wrangle flags across teams.
And if you’re a power user? When choosing different search filters, the search box updates in real time with the underlying syntax. That means you can learn the query format and skip the UI altogether for your next search. And once you start down that road, check our docs for even more syntax options and examples.
Search Filters are live now on Cloud and will be included in our next release.

Don't let vibe coding become vibe shipping
It’s estimated that over 40% of all new code is now written by AI, and that trend is likely to accelerate, leading to an exponential increase in the total code being shipped to production. This is not necessarily a net benefit for companies, though—who’s to say the extra code is actually helping the business? In the early 2000s, Yahoo added exponentially more widgets to their homepage, while Google kept things simple and we all know how that turned out.
Industry-wide, only about a third of product changes actually have a positive impact on a company’s core business metrics. The rest either do nothing to move the needle or can even be unintentionally harmful. Without proper measurement and safeguards, you could be vibe coding your way to a product no one wants to use.
This is not a new problem, and there is already an established solution from the pre-AI days. Feature flags and experiments have been used by all of the top companies for years to measure code changes in production and ship the ones that work while reverting the ones that don’t.
In this new vibe coding paradigm, feature flags are still the right way to release code, and experimentation is still the right way to measure impact and make the ship/revert decision. The solution is the same, but the scale of the problem is increasing exponentially.
The good news is that GrowthBook, the most popular open-source feature flag and experimentation platform, just launched 2 products tailored specifically for this new reality.
First are Safe Rollouts, which are super lightweight experiments that require much less developer involvement to set up and manage. Safe Rollouts gradually ramp up traffic to a feature while monitoring key guardrail metrics for regressions. If anything goes wrong, it can automatically revert the change and alert you. The goal is to make sure safety and experimentation don’t get in the way of increased velocity.
Second, we released the first-ever MCP Server for feature management and experimentation! Developers can now create feature flags, configure Safe Rollouts, monitor results, and more—all without ever leaving their IDE. This makes it trivially easy for developers to incorporate GrowthBook into their AI-driven development workflow.
This is one of the first real glimpses of what AI + developer tools can look like when they actually work together. We’re just getting started.
Read more about the GrowthBook MCP Server.
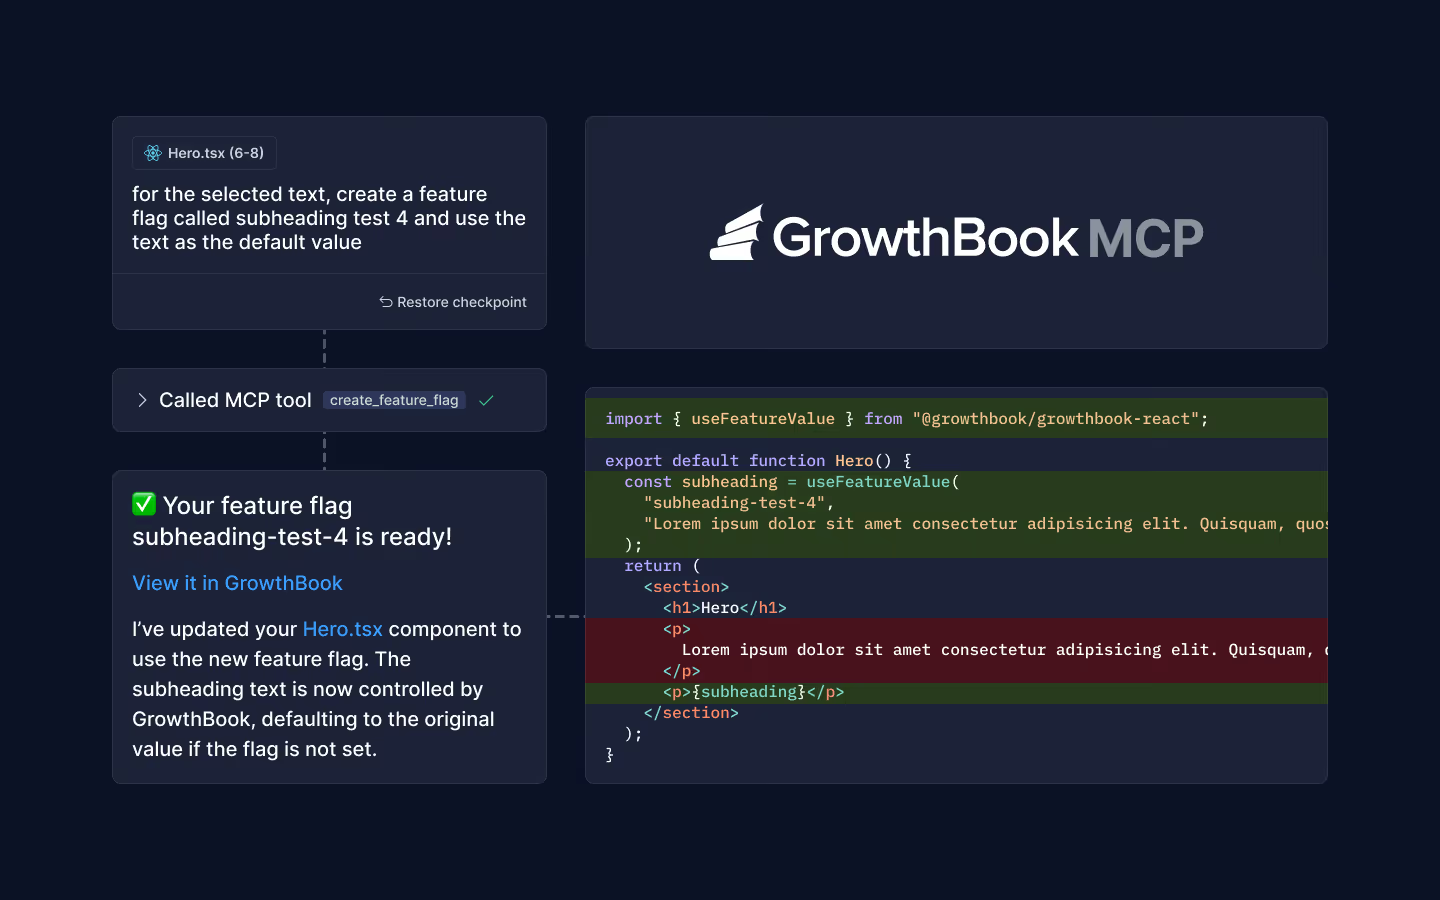
Introducing the first MCP server for experimentation and feature management
Updated October 7, 2026: This post announced our first MCP Server in May 2025. We've refreshed the capabilities, setup, and links for MCP 2.x. For the current architecture, read Why GrowthBook's MCP server is just the interface. For installation, use the current MCP documentation.
AI coding tools make it easy to write code and produce features much more quickly than ever before. But as we increase the amount of code we can create, we still need to ensure those features will work.
Don't let vibe coding become vibe shipping.
With the official GrowthBook MCP Server, you can manage feature flags, safe rollouts, A/B tests, and more without leaving your AI tool. Compatible clients such as VS Code, Cursor, Claude Code, and Codex can connect to GrowthBook, while your coding agent handles the application changes.
When adding flags is this easy, there’s no excuse for risky deployments.
What’s an MCP server?
MCP stands for Model Context Protocol, a standard that lets AI tools (like LLM editors) integrate with platforms like GrowthBook.
Most modern AI tools already support “tool calling,” the ability for an LLM to trigger specific developer-defined actions. MCP standardizes that connection, so you don't need custom glue code for every integration. Your AI client still needs to support the server's transport and authentication.
We launched GrowthBook’s first MCP Server in May 2025 to bring feature flagging and experimentation into AI coding workflows. It’s open source and designed to streamline the way you work with feature flags and experiments.
For example, the original demo below shows GrowthBook MCP being used to add a feature flag to a React app. The server creates the flag in GrowthBook, while the AI coding client updates the component using the GrowthBook React SDK. The video shows the original MCP interface; use the current setup below for today's workflow.
What you can do
The original server exposed 14 task-specific tools. MCP 2.x now uses 4 tools: growthbook_list_skills, growthbook_read_skill, growthbook_api_read, and growthbook_api_write. The agent skills provide workflow guidance, and the API tools read or change GrowthBook state. Here are some highlights:
- Create a feature flag and have your coding agent add the SDK check to your app.
- Set up targeting rules, e.g., to restrict a feature to beta testers.
- Plan gradual or monitored rollouts with guardrail metrics.
- Design, launch, and analyze an A/B test.
- Audit stale flags and prepare code cleanup for engineering review, testing, and verification before removal.
- Build and run charts using your existing metrics and fact tables.
Flag type generation uses the GrowthBook CLI. Documentation remains available through the GrowthBook docs; the current MCP server does not expose dedicated type-generation or docs-search tools. Review proposed code changes and release decisions; GrowthBook permissions and configured approval policies still apply.
Setup
For GrowthBook Cloud, connect to the hosted MCP Server at https://mcp.growthbook.io/mcp and sign in through browser OAuth. No API key is needed in the MCP configuration. In Cursor's MCP settings, add:
Save, complete the GrowthBook OAuth flow, and confirm the server shows an active connection. Ask your agent to list the available GrowthBook skills before making a change. Other clients use different configuration formats; follow the client-specific installation instructions.
Self-hosted GrowthBook users can use a local @growthbook/mcp@latest process with an API key or personal access token and their GB_API_URL, or run the official Docker image as their own HTTP MCP endpoint. Follow the self-hosted setup instructions for authentication and prerequisites.
What’s next
Since this launch, GrowthBook has expanded the agent workflows behind MCP. The GrowthBook 5.1 release introduced the hosted MCP and OAuth experience alongside broader AI workflows. The server now connects agents to maintained skills and the REST API instead of a growing catalog of task-specific tools.
GrowthBook’s MCP Server is already useful, but there is always more we can do. Explore the current MCP product overview, or try the Agent Skills plugin if you want the playbooks without an MCP process. Try it, improve it—we’d love to see what you build.
Get started
The GrowthBook MCP Server is live and ready. Use the current setup documentation to connect a compatible client and start with a read-only task before changing flags or experiments.
Have ideas, bugs, or weird edge cases? Open an issue or find us on Bluesky or LinkedIn—we’d love to hear what you build.

GrowthBook version 3.6
This release includes an exciting new feature flag rule, a long-awaited addition to experimental results, an integration sure to make PMs happy, and much more! Keep reading for details.
Safe rollouts
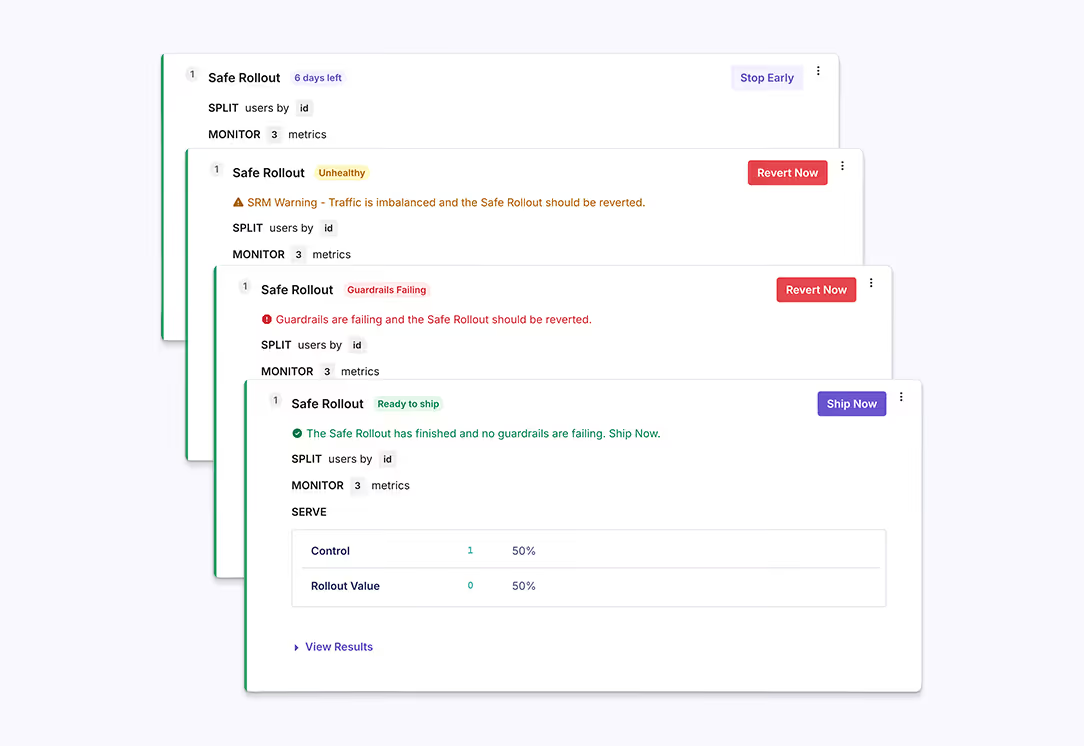
Introducing our newest type of feature flag rule—Safe Rollouts!
Safe Rollouts let you gradually release a feature while monitoring guardrail metrics for regressions. It’s designed to be simple to use, so there’s no reason not to wrap it around every bit of code you release. In fact, we used Safe Rollouts to release Safe Rollouts in GrowthBook Cloud just this week. So meta!
Under the hood, Safe Rollouts uses sequential testing and one-sided confidence intervals to continuously monitor guardrail metrics and quickly detect harmful changes without inflating the false-positive rate.
We couldn’t wait to get this into your hands and hear your feedback, so this initial release is intentionally minimal. Don’t worry, though, we have a lot planned for the near future: automated ramp-ups (10% → 25% → 50% → 100%), time series view of results, deep dives, and more. Stay tuned!
Time series
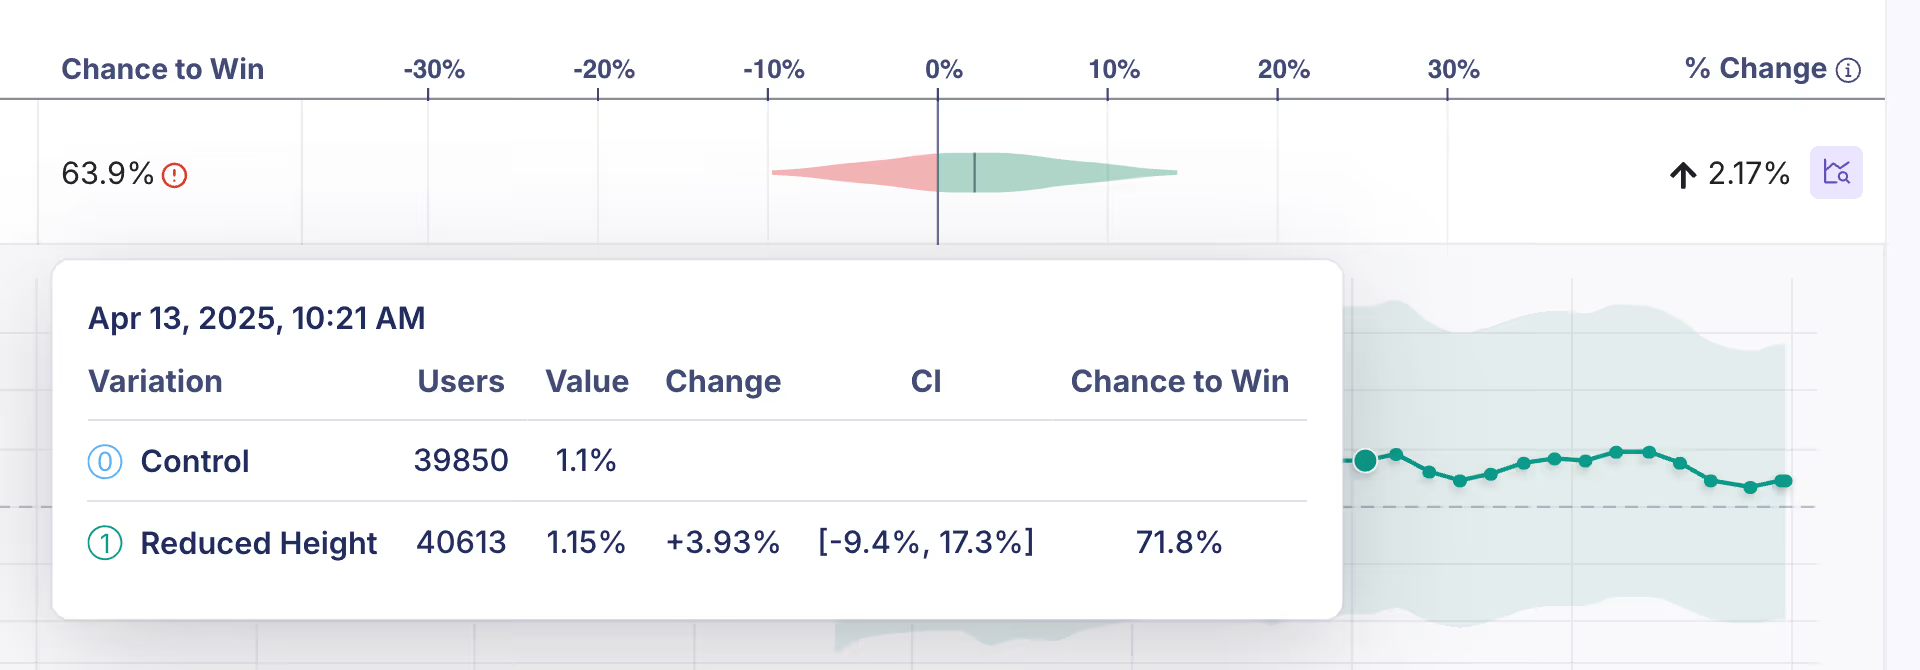
We’ve added one of our most requested features to experiment results: a Time Series view for metrics! Now you can expand any metric and see how it has changed throughout the lifetime of the experiment. The best part? We were able to add this without any additional (and expensive) SQL queries against your data warehouse, so it all comes at no extra cost.
Official Jira integration
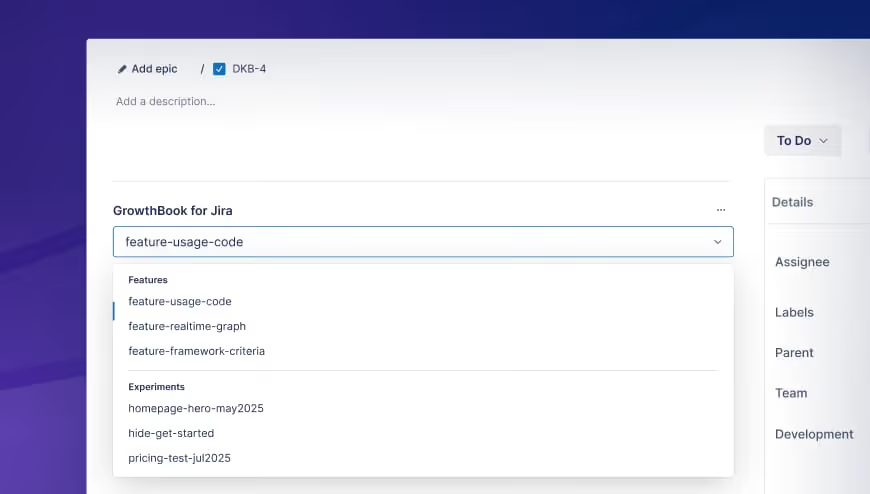
We just launched our first official Jira integration! You can now install the GrowthBook app from the Atlassian Marketplace and easily link a feature or experiment to any Jira issue. See key details and up-to-date statuses directly in Jira without switching contexts.
Check out the Jira Integration docs to learn more and get started.
Decision framework events and API
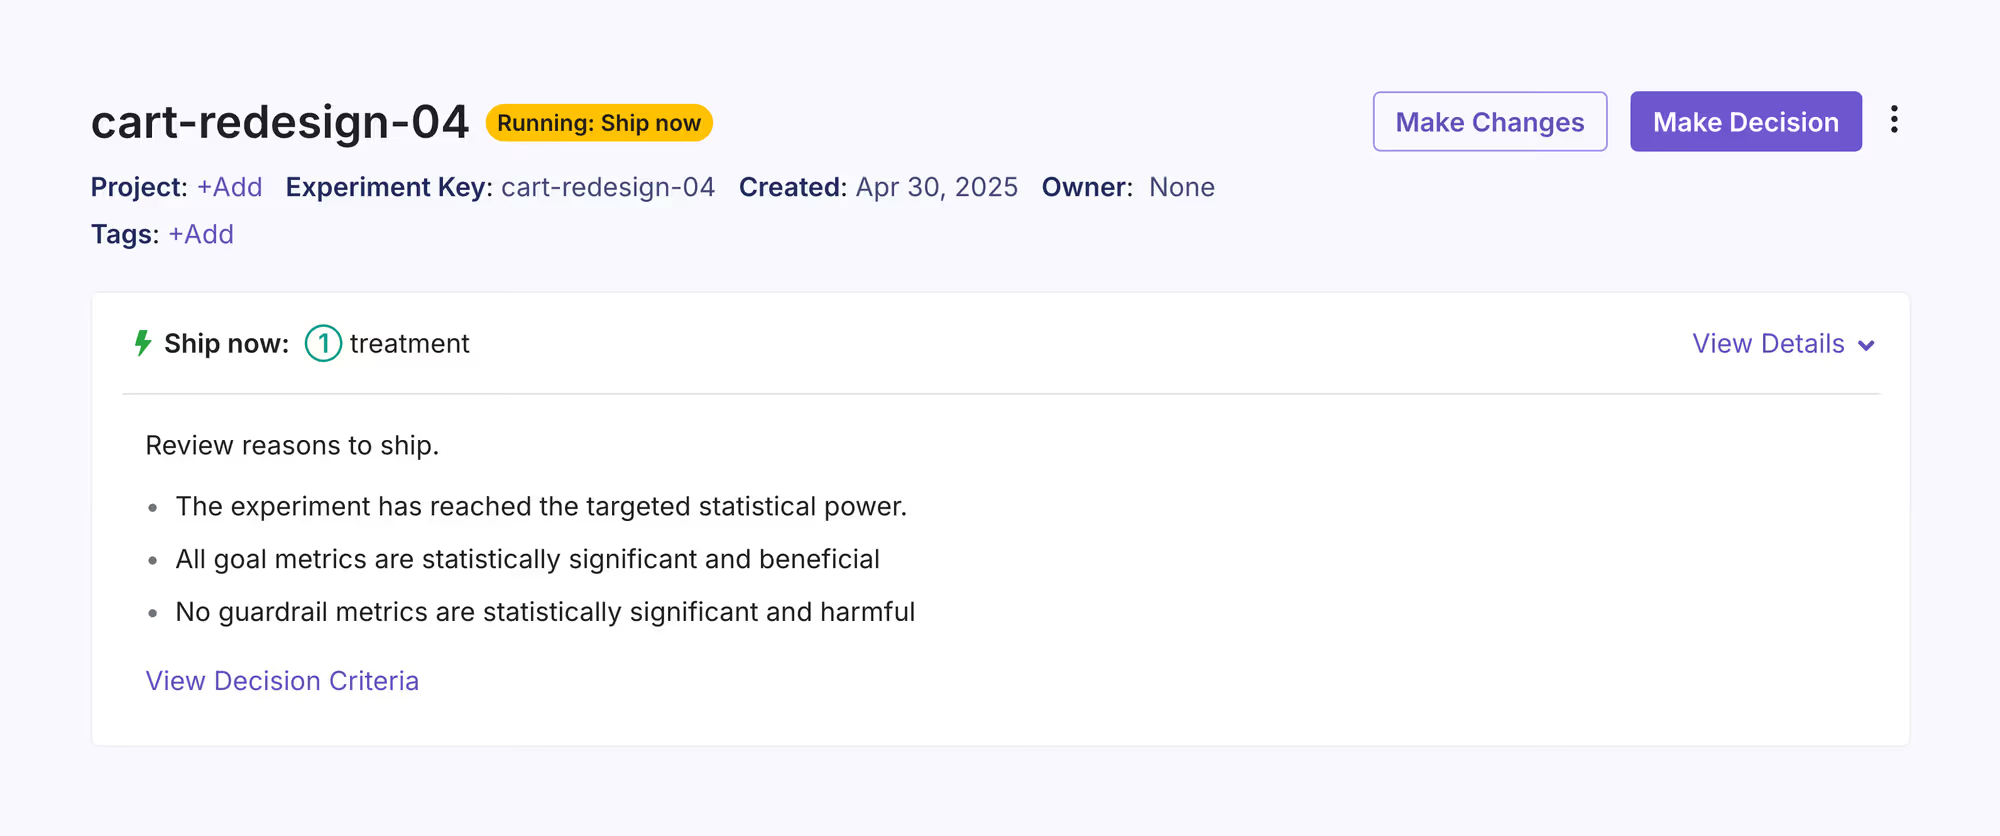
In the previous release, we launched the Experiment Decision Framework to provide UI recommendations on when an experiment is ready to stop and which decision you should make (ship or roll back). In this release, we extended this info to both the REST API and Webhooks. That means you can get an alert in Slack whenever an experiment is ready to call or build your own custom workflows around these events.
Dev tools for SSR
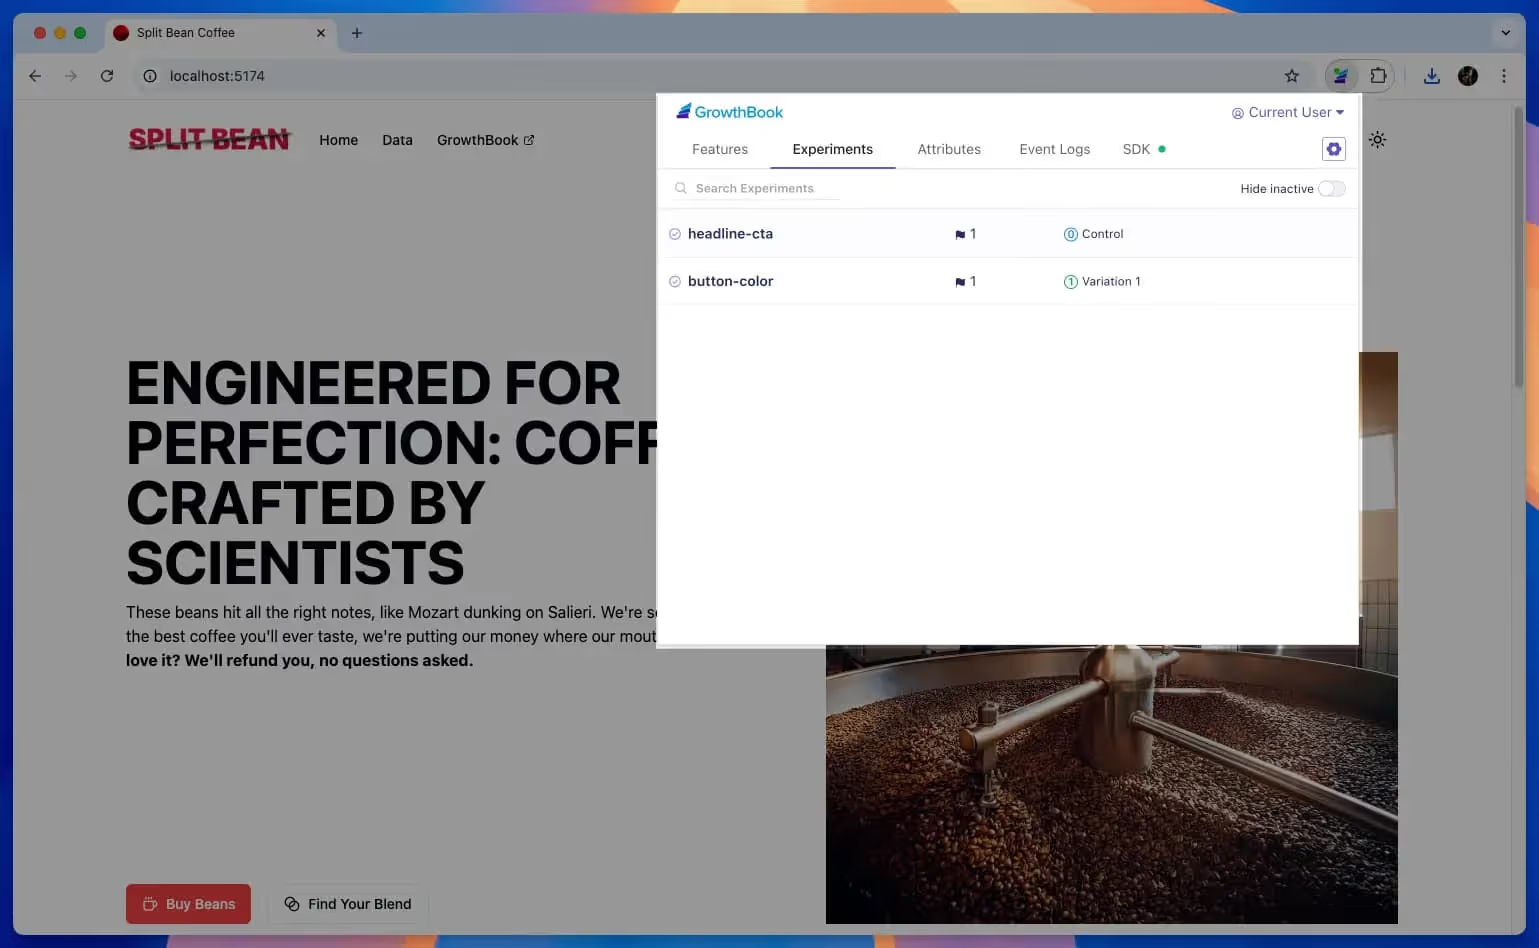
Our GrowthBook Dev Tools browser extension has always been a great way to debug and QA feature flags, but it was limited to client-side applications only. We’re excited to finally bring the same developer experience to the back-end, starting with Server-Side Rendered (SSR) Javascript applications. All it requires is a few small changes to your back-end GrowthBook implementation.
So how does it work? When you override a feature flag, experiment, or attribute in DevTools, we persist the override in a cookie. This is sent to the back end and applied locally before the request is processed. Then, debug logs from the back-end SDK are injected into the rendered HTML and captured by DevTools.
Fact table JSON columns
It’s common to have a single shared “Events” table in your data warehouse where everything from page views to purchases is logged together. While a JSON blob column is a convenient way to store meta info about each event, it also makes it harder to query and use in metric definitions.
Fact Tables in GrowthBook now have native support for JSON columns. When creating metrics, you can easily reference nested fields in row filters and even use them as metric values. No more writing custom SQL filters and trying to remember the syntax.
Fun fact: Every single database engine decided to come up with its own syntax for querying JSON data, so we had to reimplement this feature 10+ different times.
👉 Find the full release notes on GitHub.

Feature flagging at scale: 5 power tools you shouldn't skip
You've got 99 feature flags, and guess what? That is the problem.
And it's only the beginning.
Now your team has hundreds of developers, designers, and PMs. Your infrastructure is distributed across microservices, edge networks, and experimental AI side quests. Your users? They're accessing your app from a shiny MacBook Pro, or a beat-up 5-year-old Android, or—somehow—the seat-back screen of a Boeing 777 to Frankfurt.
How do you keep it all from breaking? And when it does break—because, let's be real—it will... how do you figure out why?
In this post, we'll walk through 5 can't-miss tools to help you scale your feature flagging operation without losing your sanity. If you're serious about progressive delivery, safe rollouts, and not making your team overly sweaty on each release, this one's for you.
1. Prerequisites: flags on flags on flags
Most modern feature flagging platforms (GrowthBook included) let you target features by audience segments. For example:
- Internal QA testers on desktop in Canada
- Pro users on mobile who've made 5+ orders in the last 3 months
- Beta testers who DM'd your CEO on X
Cool, right?
But what about when one feature depends on another?
Let's say you're prepping your long-awaited 3.0.0 release. It includes:
- New settings UI
- Fresh checkout flow
- Product carousels that aren't garbage
- Dark mode (#1 requested feature)
You want to flip the whole release on with a single flag—but keep the ability to turn off any part if it breaks.
That's where prerequisite flags come in. You create a release-3-0-0 flag, and make each individual feature (settings menu, checkout, etc.) depend on that release flag. This way, no part of the release goes live unless release-3-0-0 is true. If something starts throwing errors? Toggle that one feature off without touching the rest.
How to do it in GrowthBook:
- Create the top-level flag (
release-3-0-0). - Set it to false in your production environment but true in dev.
- Create a dependent flag like
new-settings-menu. - Add
release-3-0-0as a prerequisite. Done.
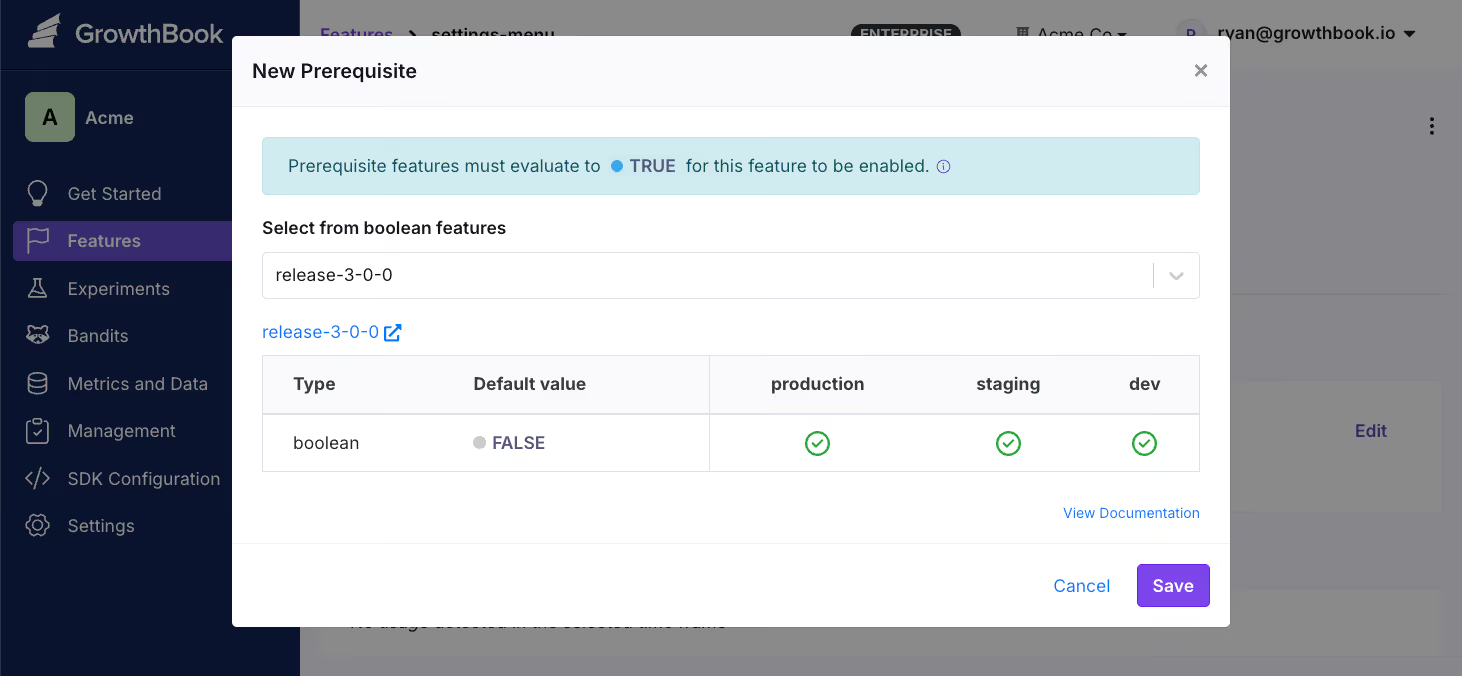
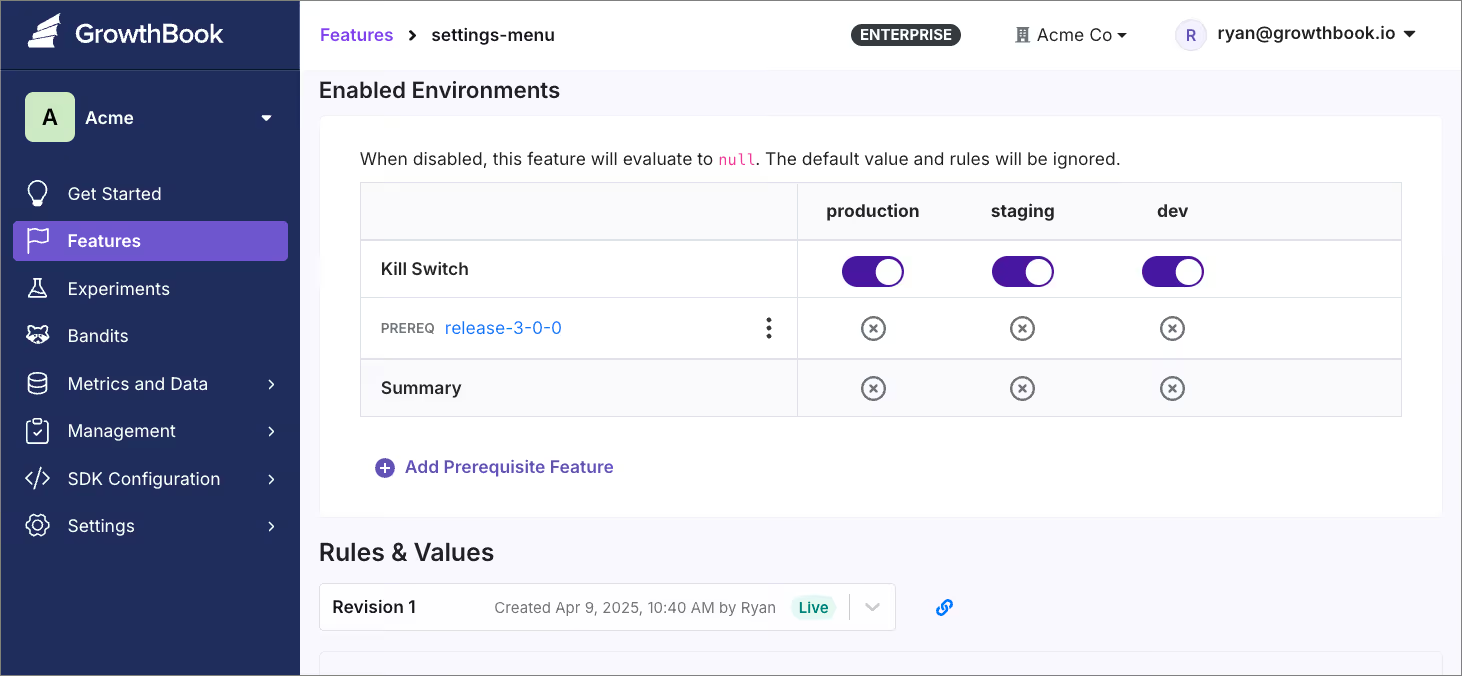
Still curious?
Check out the docs or watch an explainer video with Clippy 📎
2. Simulation & archetypes: know what your flags will do before they do it
Here's a real flag rule we've seen (truth be told, it's actually simplified here):
- Kill switch is off
- Account age > 30 days
- Region isn't restricted
- User isn't in an override list
- Country is GB
- A/B test returns true
Yikes. This is already complex—and you know Joey from Marketing has some other targeting they're itching to add.
How do you understand at a glance how this flag will evaluate without feeling like Charlie:

In GrowthBook, Simulation lets you plug in attributes—like country, browser, etc.—and instantly see the flag's result. You'll know before you ship whether a rule will work or explode.
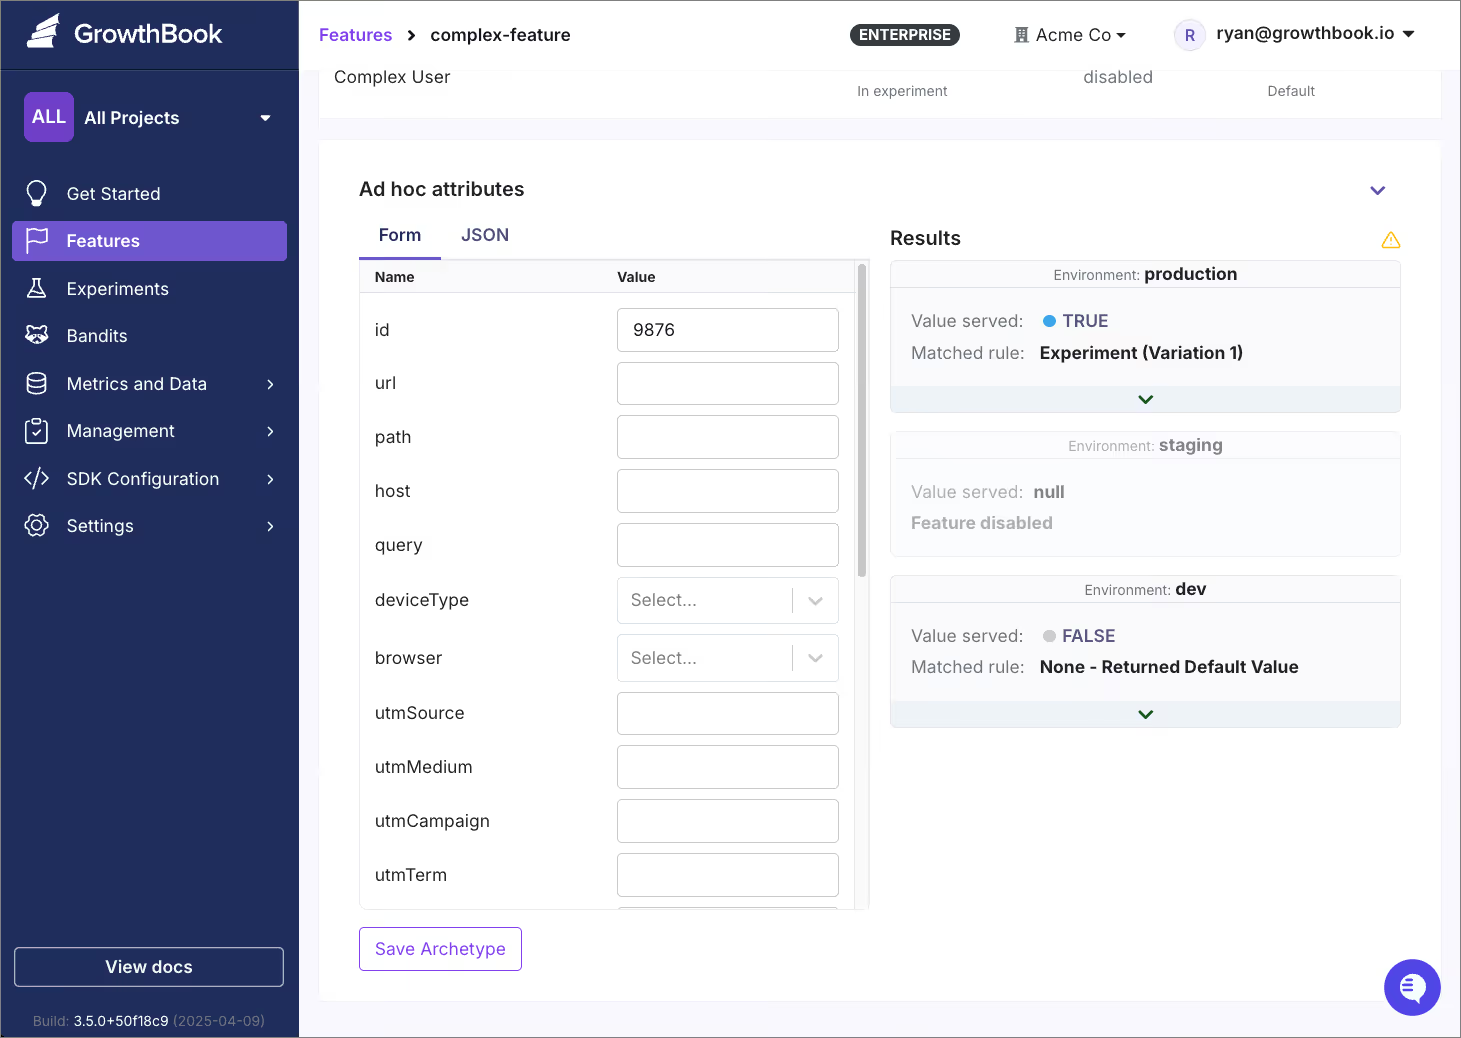
But adding in those attributes time and again becomes tedious fast. Archetypes are a solution to that pain, letting you save common user types (like "internal tester" or "new mobile pro user") and then easily see how any flag is evaluated for them.
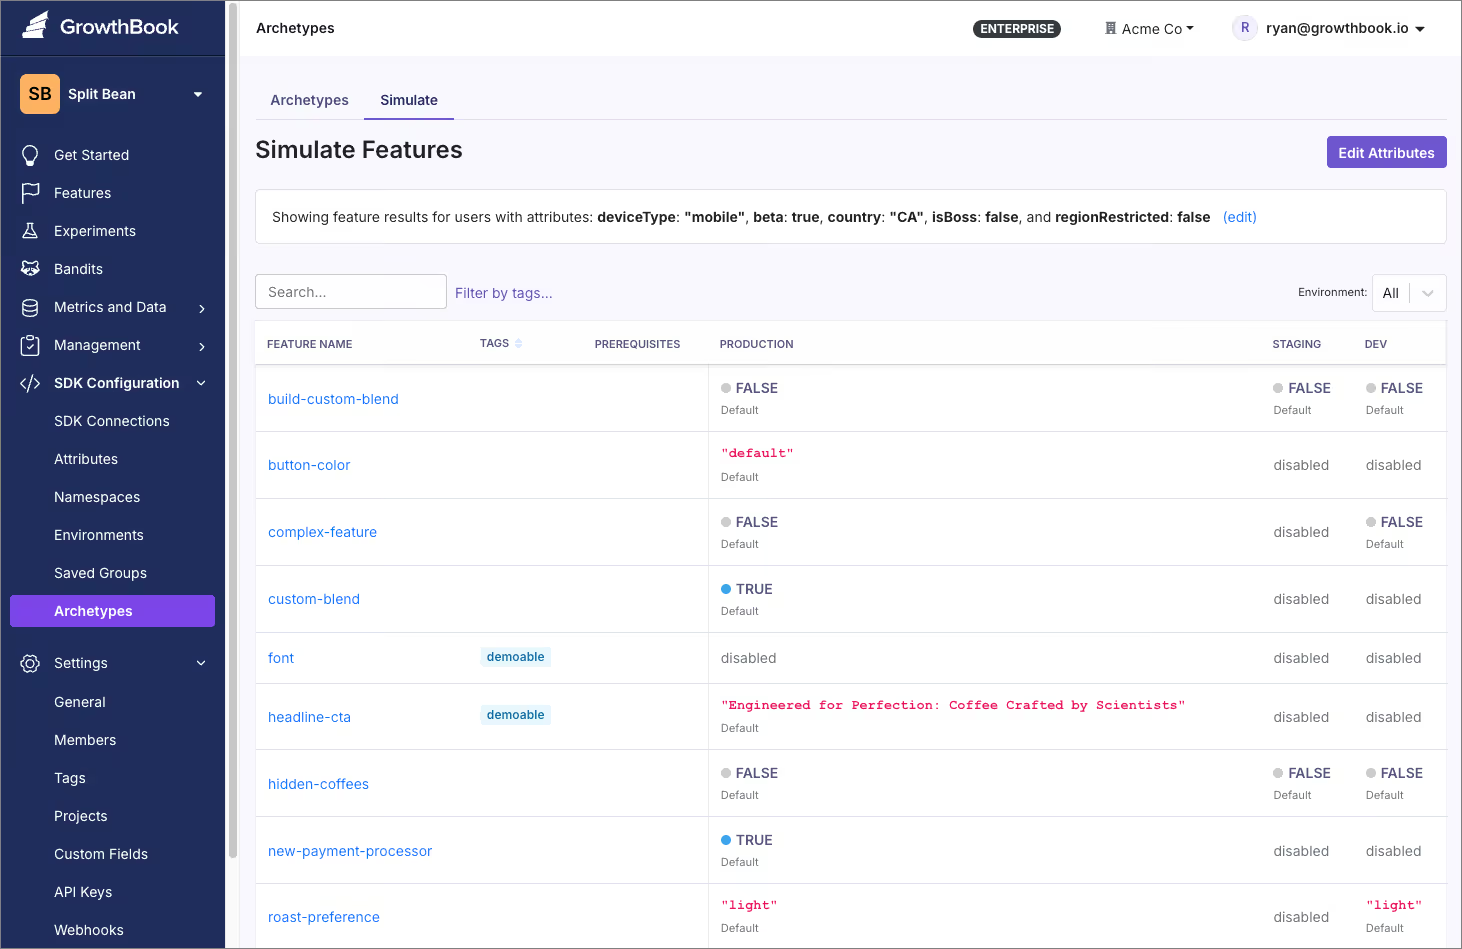
💡
Head to SDK Configuration → Archetypes → Simulate to get a bird’s-eye view of all flag evaluations for any given user type.
3. Dev tools: see what your flags are up to in the wild
You've tested internally, you've simulated, and your flag has gone live. But wait—your teammate says they can't see it. There's the ping from QA. And support says users can't find the promised dark mode and if they can't dark mode, what's the point?
Time to start the arduous debugging process...

GrowthBook Dev Tools, a browser extension for Chrome and Firefox, is here to help 💁
With Dev Tools, you can:
- Inspect live flag values in your app
- See experiment variations and why they were assigned
- View current user attributes
- Override values to test different states
- Lots more!
Dev Tools works with most frontend SDKs (just make sure enableDev: true is set in your config). Support for some backend SDKs coming soon.
See the full walkthrough 📼 to learn more:
4. Staleness detection: clean up your crusty old flags
You launched a feature 2 months ago. The flag's still in production, but no one knows why. And now it's silently directing 100% of traffic to Variation A ... and nothing else 😐
That's a stale flag, and it's building up tech debt that's sure to cause confusion, bugs, and more work down the line.
GrowthBook detects staleness automatically. If a flag hasn't been touched in a while and is sending all users to the same variant, you'll see a clock icon in the Flags view. (Hover over the icon to learn why it's stale.)
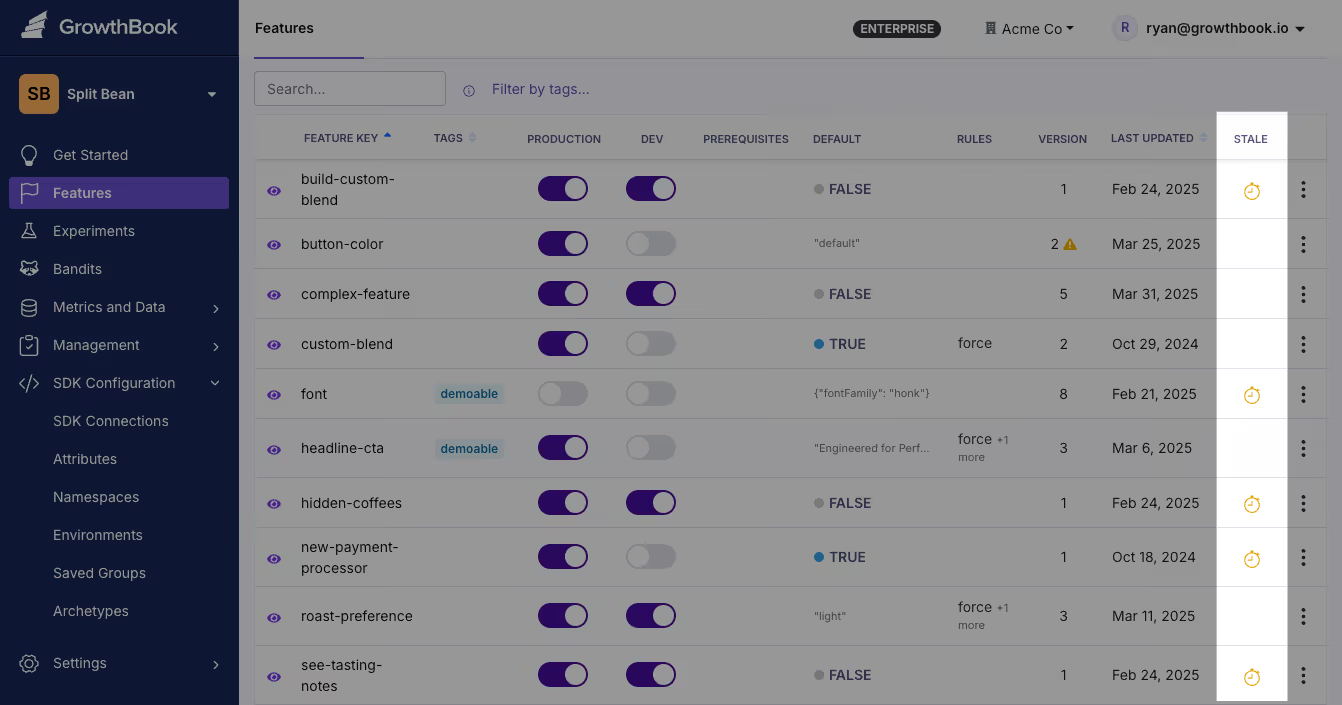
By alerting you to stale flags, GrowthBook helps you keep your features current and your codebase clean.
🧠 More on how staleness detection works
5. Code refs: find your flags in the actual codebase
Your PM wants to delete the new-headline-cta flag. Is it still used in the frontend? Backend? Nowhere? 🤷
Instead of grepping through every repo, use Code References in GrowthBook.
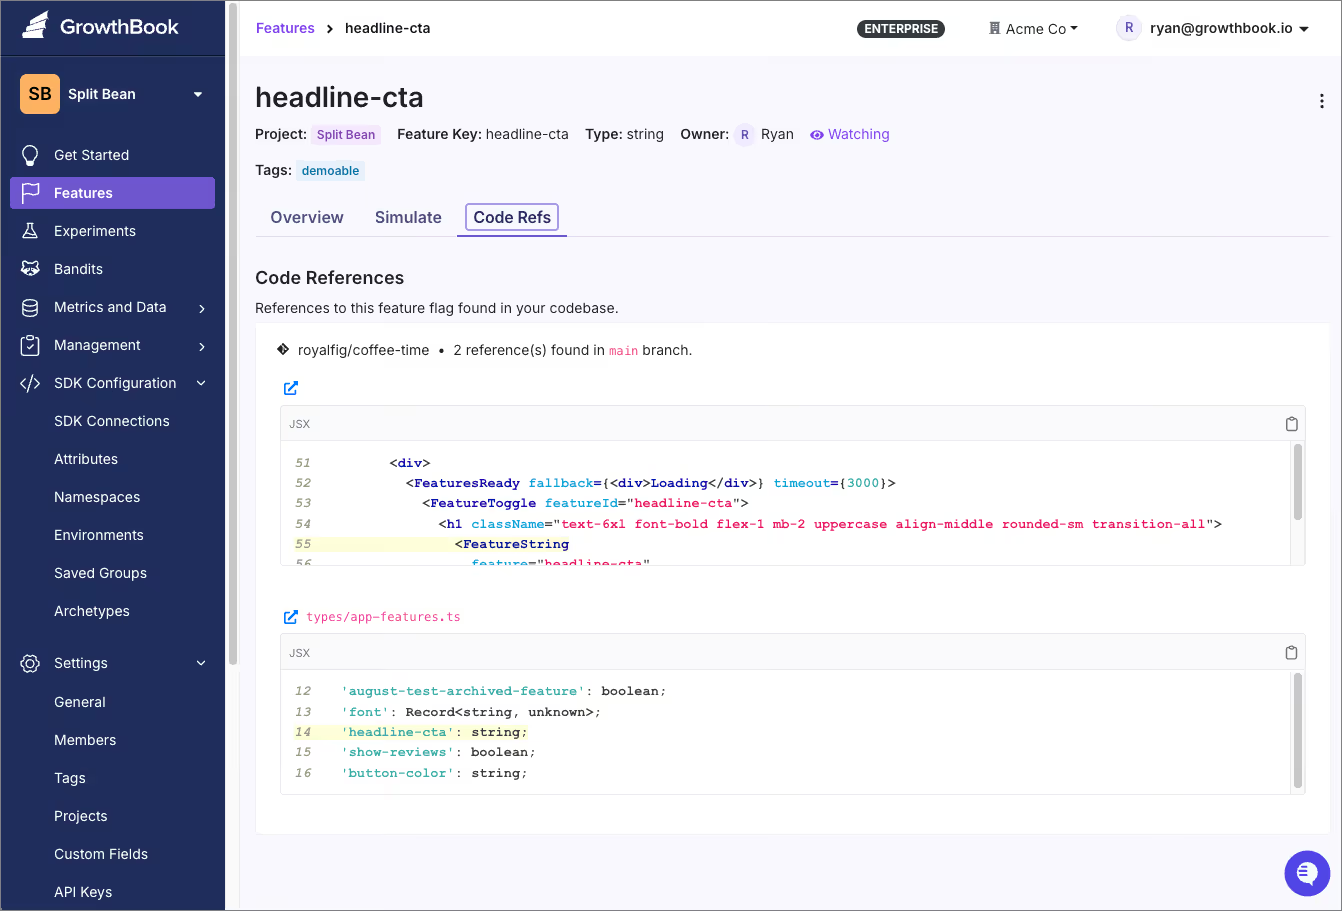
It shows you:
- Repos and file names
- Line numbers and code snippets
- Links to the exact spot in your code
To enable it:
- Add the GitHub Action (GitLab and other platforms supported, too!)
- Go to Settings → Feature Settings → Code References and enable.
- Make cleaning up flags suck a little bit less.
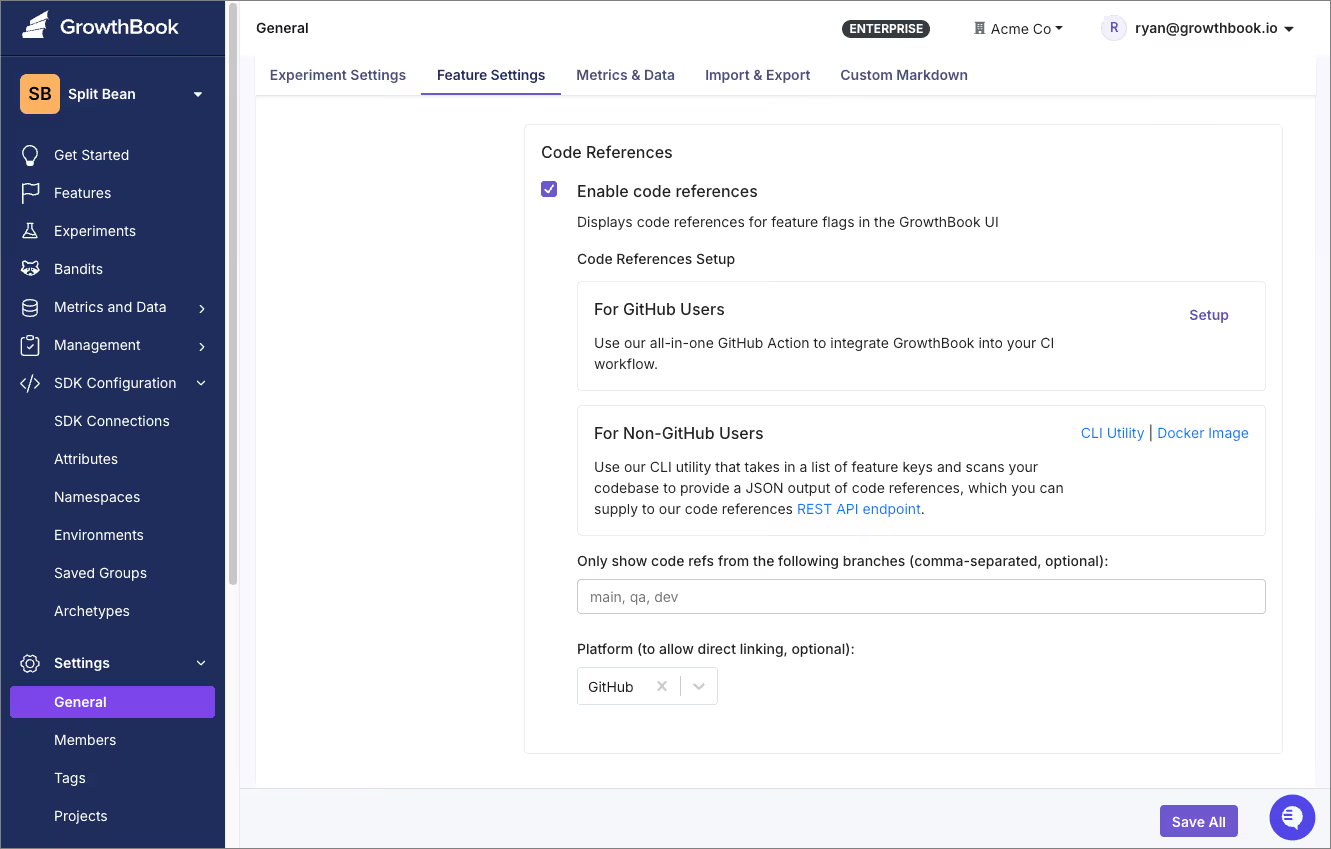
Feature flags are pretty much a necessity for modern software development—but you gotta keep them under control. As your app (and your team) grows, so does the complexity. The tools above will help you stay ahead of it all.
👉 Want to try them out for yourself? Start for free or say hi on Slack.

Why fintechs should shrink their attack surface—not just get certified
TL;DR
- Security certifications aren’t enough to stop breaches.
- The most effective way to secure customer data is to reduce your attack surface.
- Self-hosting tools can significantly reduce your risk of a breach.
When I got an email from my bank saying “nothing to worry about,” my gut told me otherwise.
The message referenced a data breach at Evolve Bank & Trust—one of the infrastructure providers for fintech platforms such as Mercury, Affirm, and Wise. The attackers reportedly accessed 33 terabytes of data—a staggering amount, possibly encompassing most of Evolve’s Azure Cloud storage.
What’s unsettling is that Evolve wasn’t negligent by traditional standards. They held all the right security certifications: SOC 2 Type II, HIPAA, HITRUST CSF, PCI DSS. And yet, their defenses were breached.
We don’t yet know exactly how—but this much is clear:
Compliance alone doesn’t keep customer data safe.
What keeps data safe? A smaller attack surface.
Security professionals often talk about “attack surface”—the number of ways a system can be accessed or exploited. The more entry points, the greater the risk.
In fintech, where trust and regulation are paramount, minimizing your attack surface is non-negotiable.
In 2022, the financial sector suffered 566 data breaches, exposing over 254 million records.
SaaS tools that run in the public cloud often expand your attack surface—regardless of their certifications. This is especially dangerous in highly regulated industries like banking, healthcare, and insurance.
Why self-hosting is the best way to reduce risk
The safest data is the data that’s never exposed to the internet. When you self-host, you keep tools and infrastructure inside your private network or behind your firewall, significantly reducing risk.
Self-hosting doesn’t have to slow you down. Most modern platforms, including GrowthBook, offer full-featured self-hostable versions of their services. You get the innovation you need without opening new doors for attackers.
GrowthBook provides:
- Self-hosted feature flagging with complete control over deployment
- Secure A/B testing powered by your own data warehouse
- Open-source transparency with auditable code and customizable infrastructure
The bottom line
If you work in fintech, healthtech, or any industry handling sensitive data, it’s time to move beyond compliance checkboxes.
Self-hosting your experimentation stack is one of the most effective ways to keep your customers safe while still shipping fast.
Learn more about how GrowthBook supports self-hosting for enterprise-grade security.

GrowthBook version 3.5
With this release, we focused on user experience and productivity improvements. There’s a completely revamped Dev Tools browser extension, a Power Calculator, an experiment Decision Framework, and tons of UI and SDK improvements. Read on for more details.
Dev tools browser extension

Our Chrome Dev Tools extension has been an essential tool for debugging feature flags and experiments since 2022, but we knew it could do even more. That’s why we completely rebuilt it from the ground up, making it faster, more powerful, and a lot more pleasant to use. There are too many improvements to list them all, but here are some highlights:
- Firefox support!
- Complete design overhaul (including dark mode!)
- Event logs and SDK health checks
- Sync Archetypes from GrowthBook to quickly simulate different users
- New popup entrypoint (just click the GrowthBook extension icon)
Download for Chrome or Download for Firefox to get started, or check out the docs to learn more.
Power calculator
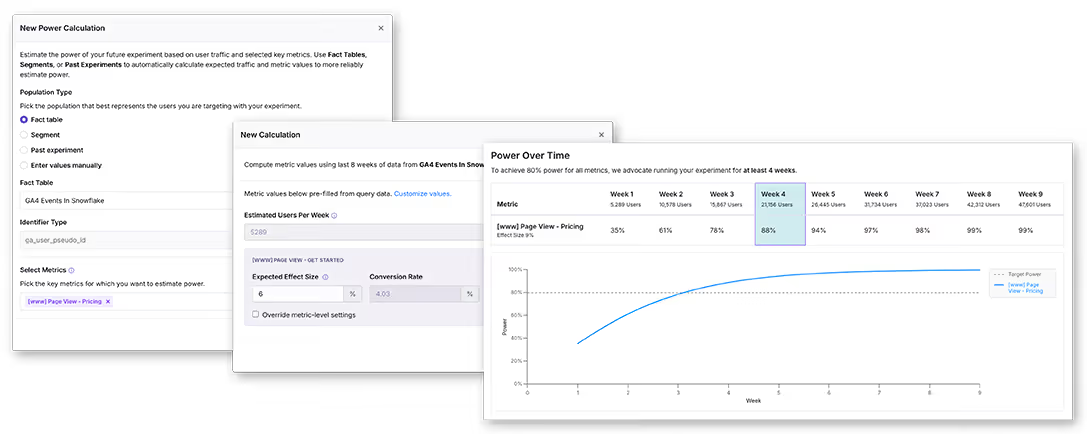
Many existing A/B test calculators estimate required sample sizes for statistical power but lack access to your historical data and specific metric definitions, limiting their accuracy. Recognizing this gap, we've developed our new built-in Power Calculator to provide more precise and tailored estimates.
This tool operates in two straightforward steps:
- Define Your Audience: Specify which users will be exposed to your experiment by selecting a past similar experiment, choosing a segment, or building an audience from a fact table.
- Set Your Goal Metrics: Identify the metrics that matter most to your experiment's success.
Once these steps are completed, the Power Calculator performs quick queries against your data warehouse, providing you with the estimated run time and minimum detectable effect (MDE) based on your historical data.
You can access the Power Calculator from the top of the Experiments page. Leveraging historical data requires a Pro or Enterprise license; however, a manual version is available for free accounts. For detailed instructions and a deeper statistical understanding, please refer to our documentation.
Experiment decision framework
It can be hard to know when to stop an experiment and make a decision. To help with this, we’re launching the first version of our Experiment Decision Framework. When enabled, running experiments will now show some additional info:
- Unhealthy - if there are data quality issues or the test is too low-powered
- No data - if the test has been running for 24 hours and there’s no data yet
- ~X days left - how long until the test reaches the desired statistical power
- Ship now - if all goal metrics are positive and statistically significant
- Roll back now - if all goal metrics are negative and statistically significant
- Ready for review - if the test has run for long enough, but there is no clear winner
For now, you must manually enable the Decision Framework under General Settings to get these new statuses. This feature is available to all Pro and Enterprise customers. We are continuing to improve this feature and are looking for feedback, so let us know your thoughts!
Read the docs for more info.
SDK updates
Some of our SDKs have fallen a little behind, so we’ve been working hard to bring them all up to spec.
Pre-requisite Features and Sticky Bucketing are now supported in the latest versions of all of the following SDKs:
- JavaScript (including Node, React, and Edge)
- Swift (iOS)
- Kotlin (Android)
- Flutter
- Java
- C#
- Python
- Ruby
- Go (sticky bucketing coming soon)
Open Feature is now supported for Web (JavaScript, React), Node.js, Java, and Python.

We’ve also released dozens of bug fixes, performance improvements, enhanced thread safety, and more across many of our SDKs. Check out the individual release notes for more info.
We’re continuing to invest more time in all our SDKs to ensure every language and framework offers a top-notch developer experience. If you find something that can be improved, please let us know!
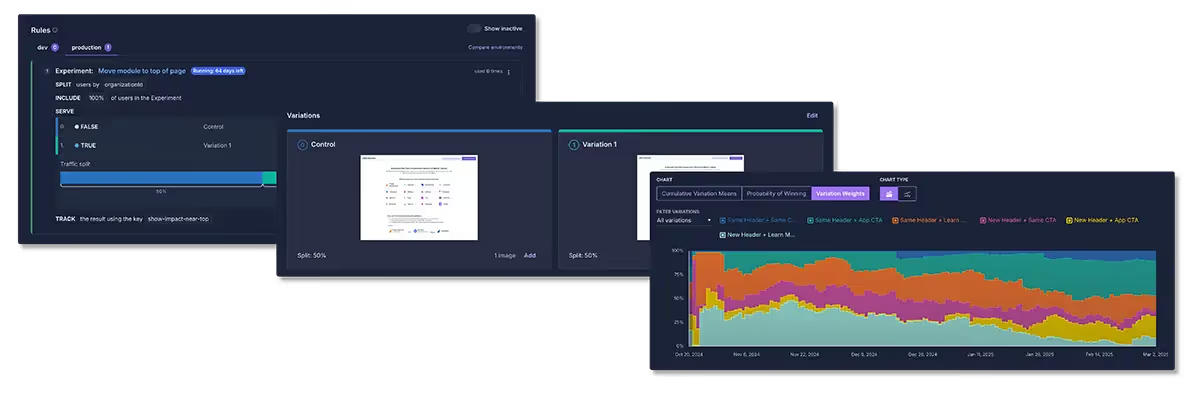
Last but not least, our design system migration is moving along quickly. You should notice big improvements to dark mode, feature and experiment pages, and more consistency and UI polish in general across the entire app. Let us know if you have any feedback!
To explore all the changes in this release, please visit our release notes.

The hidden complexities of building your own A/B testing platform
Years ago, at Education.com, we decided to build our own A/B testing platform. We had a large amount of traffic, a data warehouse already tracking events, and enough talented engineers to try something “simple.” After all, how hard could it be? But as with most engineering projects, it quickly became evident that what seemed straightforward morphed into a complex, high-stakes system, one where one bug will invalidate critical business decisions.
In this post, we’ll break down the hidden complexities, costs, and risks of building your own A/B testing platform that you may not be thinking of when you first start out on this endeavor.
Experiment description
On the technical side of running an experiment, you need a way to tell your systems how you will assign users to a particular variant or treatment group in an experiment. Most teams begin with the basics, like deciding how many variations to run (A/B, A/B/C, or more) and how to split traffic (e.g., 50/50 vs. 90/10). Initially, it might look like you only need to encode a handful of properties. But as your platform use grows, you’ll discover you need more parameters.
- Number of Variations: The scope can expand from simple A/B to multi-variate tests with multiple variations.
- Split Percentages: Instead of fixed splits, you may require partial rollouts (10% one day, 50% the next) or dynamically adjusted traffic (Bandits).
- Randomization Seeds: Deterministic assignment so every data query lines up with the same user-variant grouping.
- Remote configurations. You may want ways to pass different values to the experiment from your experimentation platform.
- Targeting Rules: Fine-grained controls, such as showing a test only to premium subscribers in California, can quickly add complexity.
Hard-coding these elements can be tempting, but it rarely scales. As your needs evolve, a rigid approach may lock you into time-intensive updates—especially when product managers want new ways to target or measure experiments.
User assignment
Ensuring that each user sees the same variant across multiple visits or devices may sound easy. But in practice, deterministic assignment can trip you up if you don’t handle user IDs, session IDs, and hashing logic carefully.
- Stable Identifiers: Teachers logging in from shared computers, students on tablets, or parents switching between mobile and desktop.
- Hashing & Randomization: You want an algorithm that’s fast and produces an even distribution.
- Server vs. Client-Side: Server-side experimentation is great for removing some of the problems with flickering, but may lack certain user attributes at assignment time. Client-side is more flexible but can cause quick visual shifts as JavaScript loads.
- Timing Issues: Caching layers or missing user identifiers can lead to partial or double exposures, invalidating experiment data.
- Cookie consent: Determining when you are allowed to assign them, what counts as an essential cookie vs a tracking one.
Mistakes here—such as users seeing multiple variations—can invalidate your results and lead to user frustration.
Targeting rules
Precise targeting often starts simply—“Show the new treatment to first-time users”—but quickly grows. Soon, you’re juggling rules like “Display Variation A only to mobile users in the U.S., except iOS < 14.0, and exclude anyone already in a payment test.”
To avoid chaos, focus on these key areas:
- Defining Attributes: Collect and securely store user data (location, subscription status, device type).
- Overlaps & Exclusions: Prevent one user from landing in conflicting experiments.
- Evolving Segmentation: Plan for marketing and product teams to constantly discover new slices of your user base.
- Sticky Bucketing: Once a user sees a variant, they should continue to get this variant even if other settings change to not invalidate their data. This quickly gets tricky deciding on when to sticky a user, and when to reassign
The client side is more flexible but can cause abrupt visual change. Without a thoughtful targeting system, the tangle of conditions becomes unmanageable, undermining both performance and trust in your experimentation platform.
Data collection
Every time a user is exposed to a test variant, you must log it accurately. If you already have a reliable event tracker or data warehouse, you’re in good shape—but it doesn’t eliminate problems:
- Data Volume: Logging millions of events for high-traffic applications can overwhelm poorly designed systems.
- Pipeline Reliability: Data loss or delays can lead to inaccurate analyses.
- Separation of Concerns: The last thing you want is for your site’s main functionality to slow down because your experiment-logging system chokes under load.
Performance issues
Your experimentation system must never degrade user experience. That means your platform must be built with the following in mind:
- Latency: Assignment and targeting logic should run in milliseconds to avoid flickering.
- Fault Tolerance: If the platform goes down, the product should revert to a default or safe state, not crash outright.
- Decoupling: Keep experiment code out of critical paths to prevent a single failure from taking out your entire product.
Metrics definition
Metrics are the backbone of A/B testing. However, there are aspects of metrics used for experimentation that are not obvious at first.
- Customization: Each metric might require customization from the default. Does it need different conversion windows, minimum sample sizes, or specialized success criteria? (e.g., “logged in at least 5 times within 7 days”)
- Metadata Management: Who owns each metric? How is it defined? Are you duplicating metrics under different names?
- Flexibility: Hard-coding a handful of metrics quickly becomes a bottleneck when new use cases emerge.
We discovered product managers, data scientists, and marketing teams each had unique definitions of “success.” We needed a system to capture these definitions and keep them consistent across the organization.
Experiment results
Analyzing results might be the most critical step:
- Conversion Windows: Ensure that only events occurring after exposure are counted, and while the experiment was running.
- Data Joins: Merging experiment exposure logs with event data often requires complex queries that can tax your data warehouse.
- Periodic Updates: Experiment results change over time, so you’ll want to have a way to update results periodically.
Any mismatch between exposure events and downstream metrics can lead to spurious conclusions—sometimes reversing what you thought was a clear “win.”
Data quality checks
There are innumerable ways your data can be messed up, leading to unreliable results and a lack of trust in your platform. Here are some of the most common ones:
- SRM (Sample Ratio Mismatch): A study from Microsoft found that ~10% of experiments failed due to assignment errors. Regularly test that actual split percentages match your intentions.
- Double Exposure: If a user is unintentionally counted in two variations, their data should be excluded. If the percentage of users getting multiple exposures is high, you probably have a bug in your implementation.
- Outlier Handling: A handful of power users can skew averages. Techniques like winsorization help maintain balanced metrics.
At Education.com, we regularly scanned for sample ratio mismatches—often uncovering assignment bugs we didn’t even know existed.
Statistical analysis
Interpreting results is where the real magic—and risk—happens. When you're making a ship/no-ship decision, you need to be sure your analysis is as accurate and trustworthy as possible. A wrong decision caused by an issue with your statistics can be very costly, but finding a systemic issue with your statistics after months or years can be catastrophic. Relying on a single T-test can be misleading in real-world testing, especially if you’re “peeking” mid-experiment. Frequentist, Bayesian, and sequential methods each have trade-offs: how you handle multiple comparisons, ratio metrics, or quantile analyses can drastically impact conclusions. Underestimating these nuances may lead to false positives, costly reversals, or overlooked wins. If you don’t have deep in-house expertise, consider leveraging open-source statistical packages—like GrowthBook’s—to maintain rigor and reduce the chance of bad data driving bad decisions.
User interface
Even the most advanced experimentation platform falls flat if only a handful of engineers can operate it. A well-designed UI empowers
- Non-Technical Teams: A user-friendly dashboard lets product, marketing, and data teams set up and monitor experiments without engineering support.
- Collaboration & Documentation: Capture hypotheses, share outcomes, and maintain a history of past tests—so insights don’t disappear when someone leaves.
- Real-Time Visibility: Spot anomalies (like misallocated traffic splits) early and fix them before they skew results.
Neglecting the UI may save development time initially, but it can stifle adoption and limit the overall effectiveness of your experimentation program.
Conclusion: the realities of building in-house
Building your own A/B testing platform is much more than a quick project—it’s effectively a second product that ties together data pipelines, statistical models, front-end performance, and organizational workflows. Even small errors can invalidate entire experiments and erode trust in data-driven decisions. Ongoing maintenance, ever-changing requirements, and new feature requests often overwhelm the initial appeal of a DIY approach.
Unless it’s truly core to your value proposition, consider a proven, open-source solution (like GrowthBook). You’ll gain robust targeting, advanced metrics, and deterministic assignment—without shouldering the full cost and complexity. This way, your team can focus on what really matters: shipping features that users love.
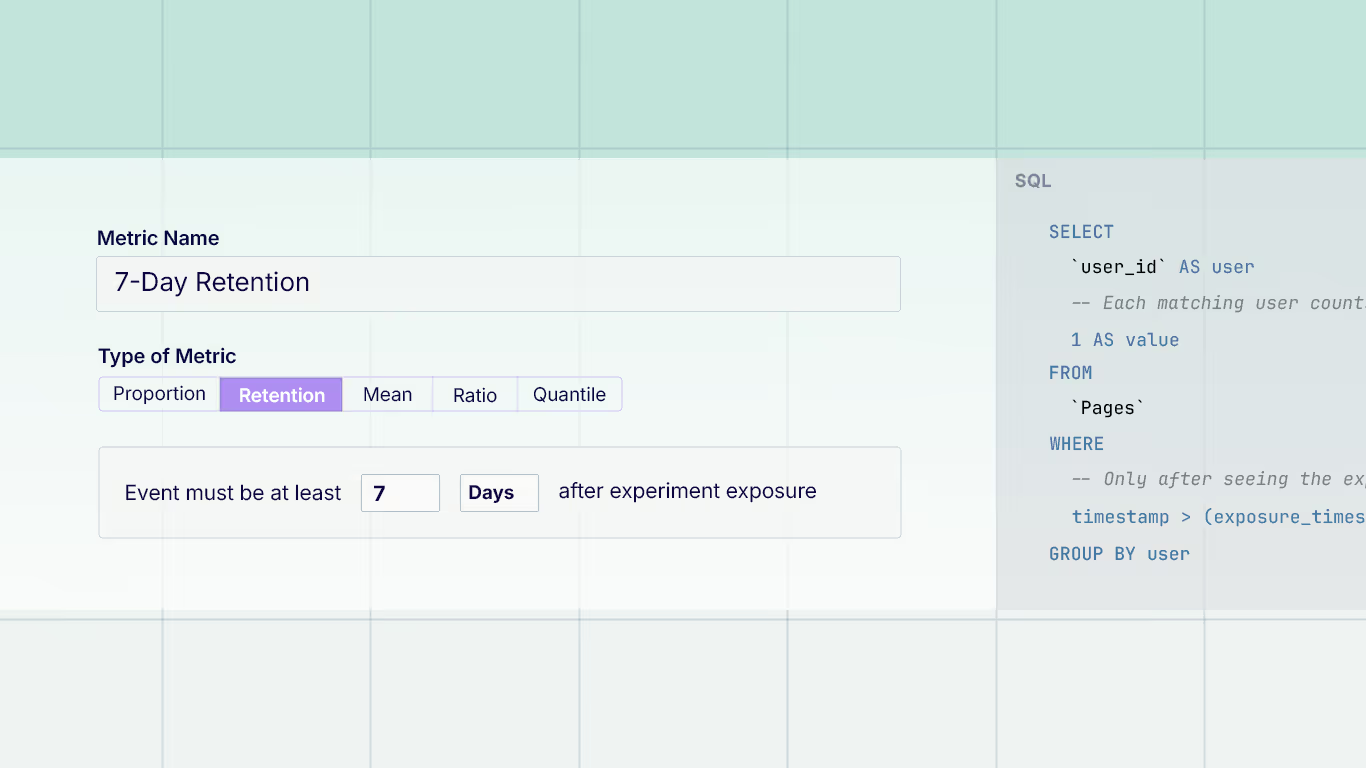
Experiment metrics simplified: retention, count distinct, max
New metrics to answer key experiment questions
Data teams face a common challenge: extracting actionable insights from experiments without adding complexity. GrowthBook’s latest metrics — Retention, Count Distinct, and Max — are designed to simplify this process, helping you measure long-term impact, unique user interactions, and peak performance without needing to dive into SQL. Here’s what you need to know.
Retention metrics: simplify long-term impact analysis
Retention metrics measure how many users return or engage with your product within a defined time frame after being exposed to an experiment. Traditionally, this involves juggling SQL queries and timestamp logic, but GrowthBook removes the friction with an easy-to-use interface.
How It Works:
- Select your core metric (e.g., user logins).
- Specify the time window you want to measure (e.g., 7-14 days post-exposure).
GrowthBook automatically calculates user retention across your experiment variants, helping you understand long-term engagement and whether changes resonate with users.
Example Use Case: Track Week 2 retention rates to determine if a new feature encourages users to return between 7-14 days after release.
Count distinct metrics: track unique interactions without SQL
Count Distinct Metrics lets you measure the number of unique entities (like users, products, or transactions) influenced by an experiment. Tracking unique entities is crucial because it uncovers patterns of diverse engagement and highlights how specific features meaningfully drive user actions. This eliminates manual deduplication and gives you precise data.
Use Cases:
- Unique Videos Watched: Measure the number of distinct videos viewed by each user.
- Unique Products Purchased: Count how many different products a user buys during an experiment.
- Distinct Checkout Sessions: Track diverse payment methods or transaction types.
Why It Matters:
Product teams often focus on driving meaningful interactions, not just volume. Count Distinct provides a deeper understanding of engagement diversity, allowing teams to build features that encourage richer user experiences.
Max metrics: identify peak performance effortlessly
Max metrics capture the highest value achieved by users during an experiment, providing insights into peak-performance behaviors.
Use Cases:
- High Score: Track the top game scores users achieve, regardless of attempts.
- Peak Spending: Identify the highest transaction value for each user.
- Fastest Time: Measure the best completion times for key workflows.
Why it matters:
Peak metrics highlight the outliers and top-performing scenarios that often drive key business outcomes. They’re invaluable for understanding the upper limits of user behavior.
Designed for every team
Retention Metrics are available to Pro and Enterprise customers and are perfect for analyzing long-term engagement trends.
Count Distinct and Max Metrics are available across all GrowthBook organizations, making them accessible whether you’re self-hosted or on a free plan.
Why use these metrics?
By integrating Retention, Count Distinct, and Max metrics into your workflows, you can:
- Measure long-term user engagement without manual SQL.
- Understand unique and diverse user interactions.
- Pinpoint peak performance to identify standout successes.
Ready to level up your experiments?
Explore these new metrics in GrowthBook today and equip your team to make faster, data-driven decisions. It’s about simplifying the complex while getting results that matter.

Customize your experimentation workflow with custom fields and shareable experiments
Running a successful experimentation program isn’t just about analyzing results—it’s about seamlessly integrating experimentation into your team’s workflow, ensuring consistency, and making insights easy to share. GrowthBook’s latest features, Custom Fields and Shareable Experiments, are designed to help teams streamline their processes and scale experimentation more effectively.
Build your ideal experiment setup with pre-launch checklists and custom fields
Enterprise teams can now add structured metadata to experiments and feature flags, enabling clear ownership, compliance tracking, and alignment with engineering workflows. By incorporating custom fields into your pre-launch checklist, you can ensure experiments are properly structured and ready for success from the start.
With Custom Fields, teams can:
- Link experiments directly to project management tools (e.g., Jira, Linear)
- Assign ownership and approvals for streamlined accountability
- Track technical dependencies and platform constraints
- Standardize resource impact assessments
- Manage regulatory, privacy, and regional requirements
- Connect experiments to OKRs and broader business goals
Custom Fields are configurable at the organization level and can be marked as required or optional. This ensures that teams capture all necessary context while avoiding unnecessary complexity.
Learn more about Custom Fields and Pre-Launch Checklists to build the perfect experimentation workflow.
Custom Fields are available exclusively for Enterprise customers.
Share experiments, your way
Experiment results need to be accessible and actionable. That’s why GrowthBook now offers two flexible ways to share experiments—internally with your team or externally with public stakeholders.
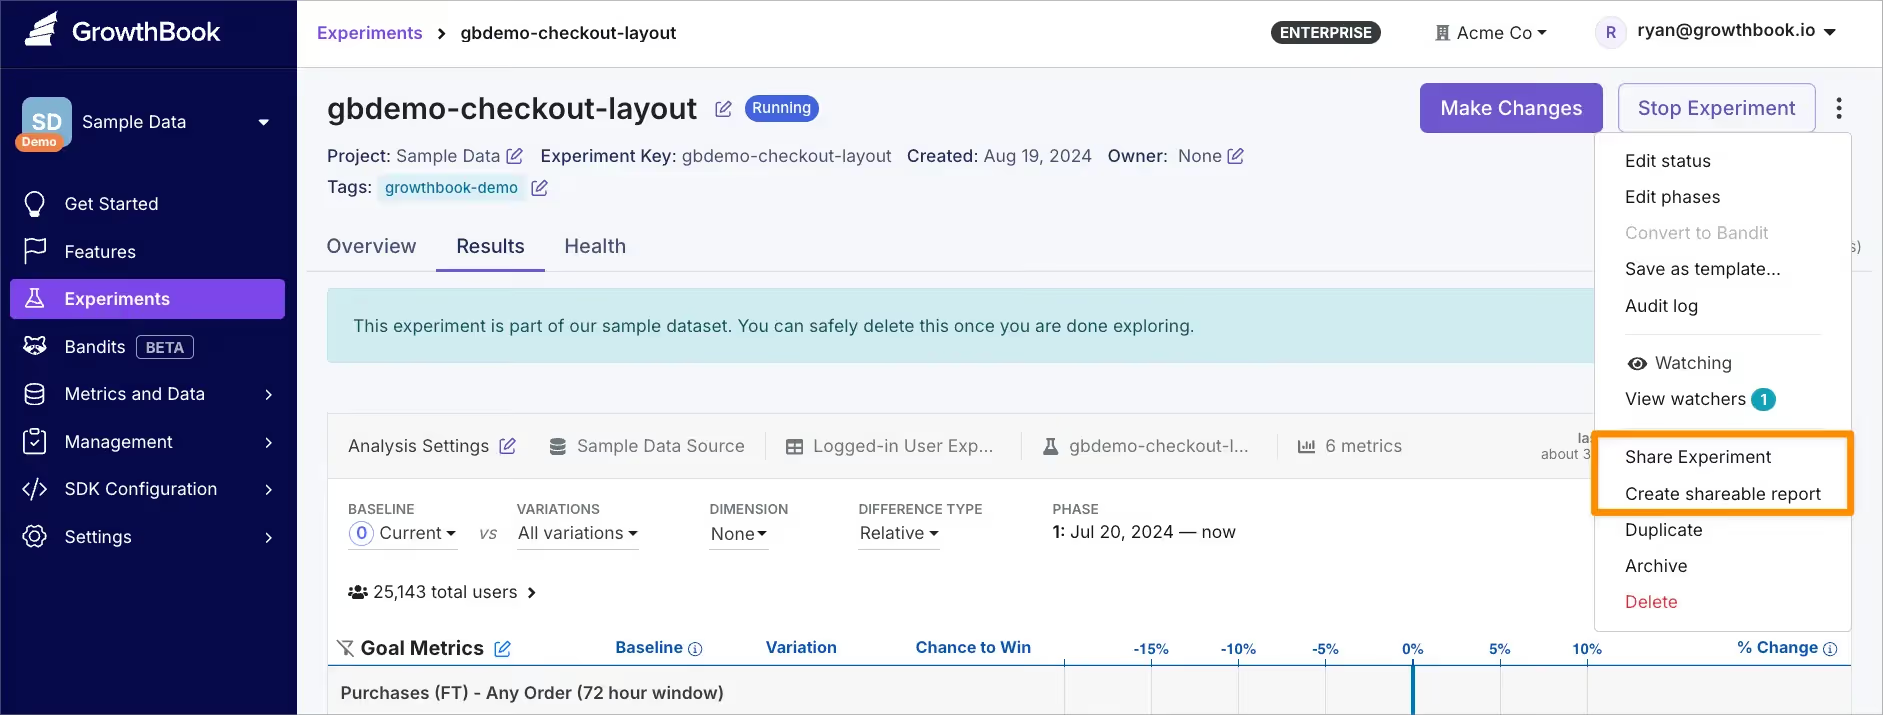
- Live Experiment Sharing
Share a real-time, always-updating view of experiment results with stakeholders who need the latest data. Share live updates during sprint reviews to keep teams aligned and make decisions more quickly. No manual updates are required, ensuring everyone has access to the most current insights.
See it in action: Explore this live experiment example to see how effortlessly you can share data in real-time. - Custom Reports
Save snapshots of experiment data for deeper analysis or documentation. Analysts and engineers can:- Select specific date ranges or user segments
- Adjust statistical parameters
- Add or remove metrics for targeted analysis
- Apply custom SQL filters to address outliers or unique use cases
- Create stakeholder-specific views tailored to their needs
Custom reports are saved for future reference, helping teams build institutional knowledge and better understand what worked, what didn’t, and why.
Learn more about sharing experiments to improve collaboration and streamline your team’s experimentation efforts.
By making experimentation workflows customizable and insights more accessible, GrowthBook empowers teams to streamline workflows, share insights effortlessly, and accelerate learning from experiments, driving smarter decisions.
GrowthBook version 3.4
It’s been 2 months since our last release, and we’re excited to bring you some highly requested features to kick off the new year. This release includes over 150 changes, and we’ve highlighted some of the biggest ones below.
Custom fields and experiment templates

GrowthBook has always been flexible with custom tags and full markdown support, but now we’re making it even easier to standardize your workflows.
- Custom Fields: Define your own fields for feature flags and experiments. Link to Jira tickets, tag impacted product surfaces, and enforce team-wide documentation standards.
- Experiment Templates: Configure default values for all experiment fields, including hypothesis, tags, targeting conditions, metrics, and more. Create templates for different types of experiments your team runs. When starting a new experiment, your team can use a template, with the option to make this step mandatory for consistency.
These features help enforce consistency and structure across your entire organization, and we’re really excited to see all the ways they get used!
Available to all Enterprise customers. Read more about Custom Fields and Experiment Templates in our docs.
Shareable experiment reports
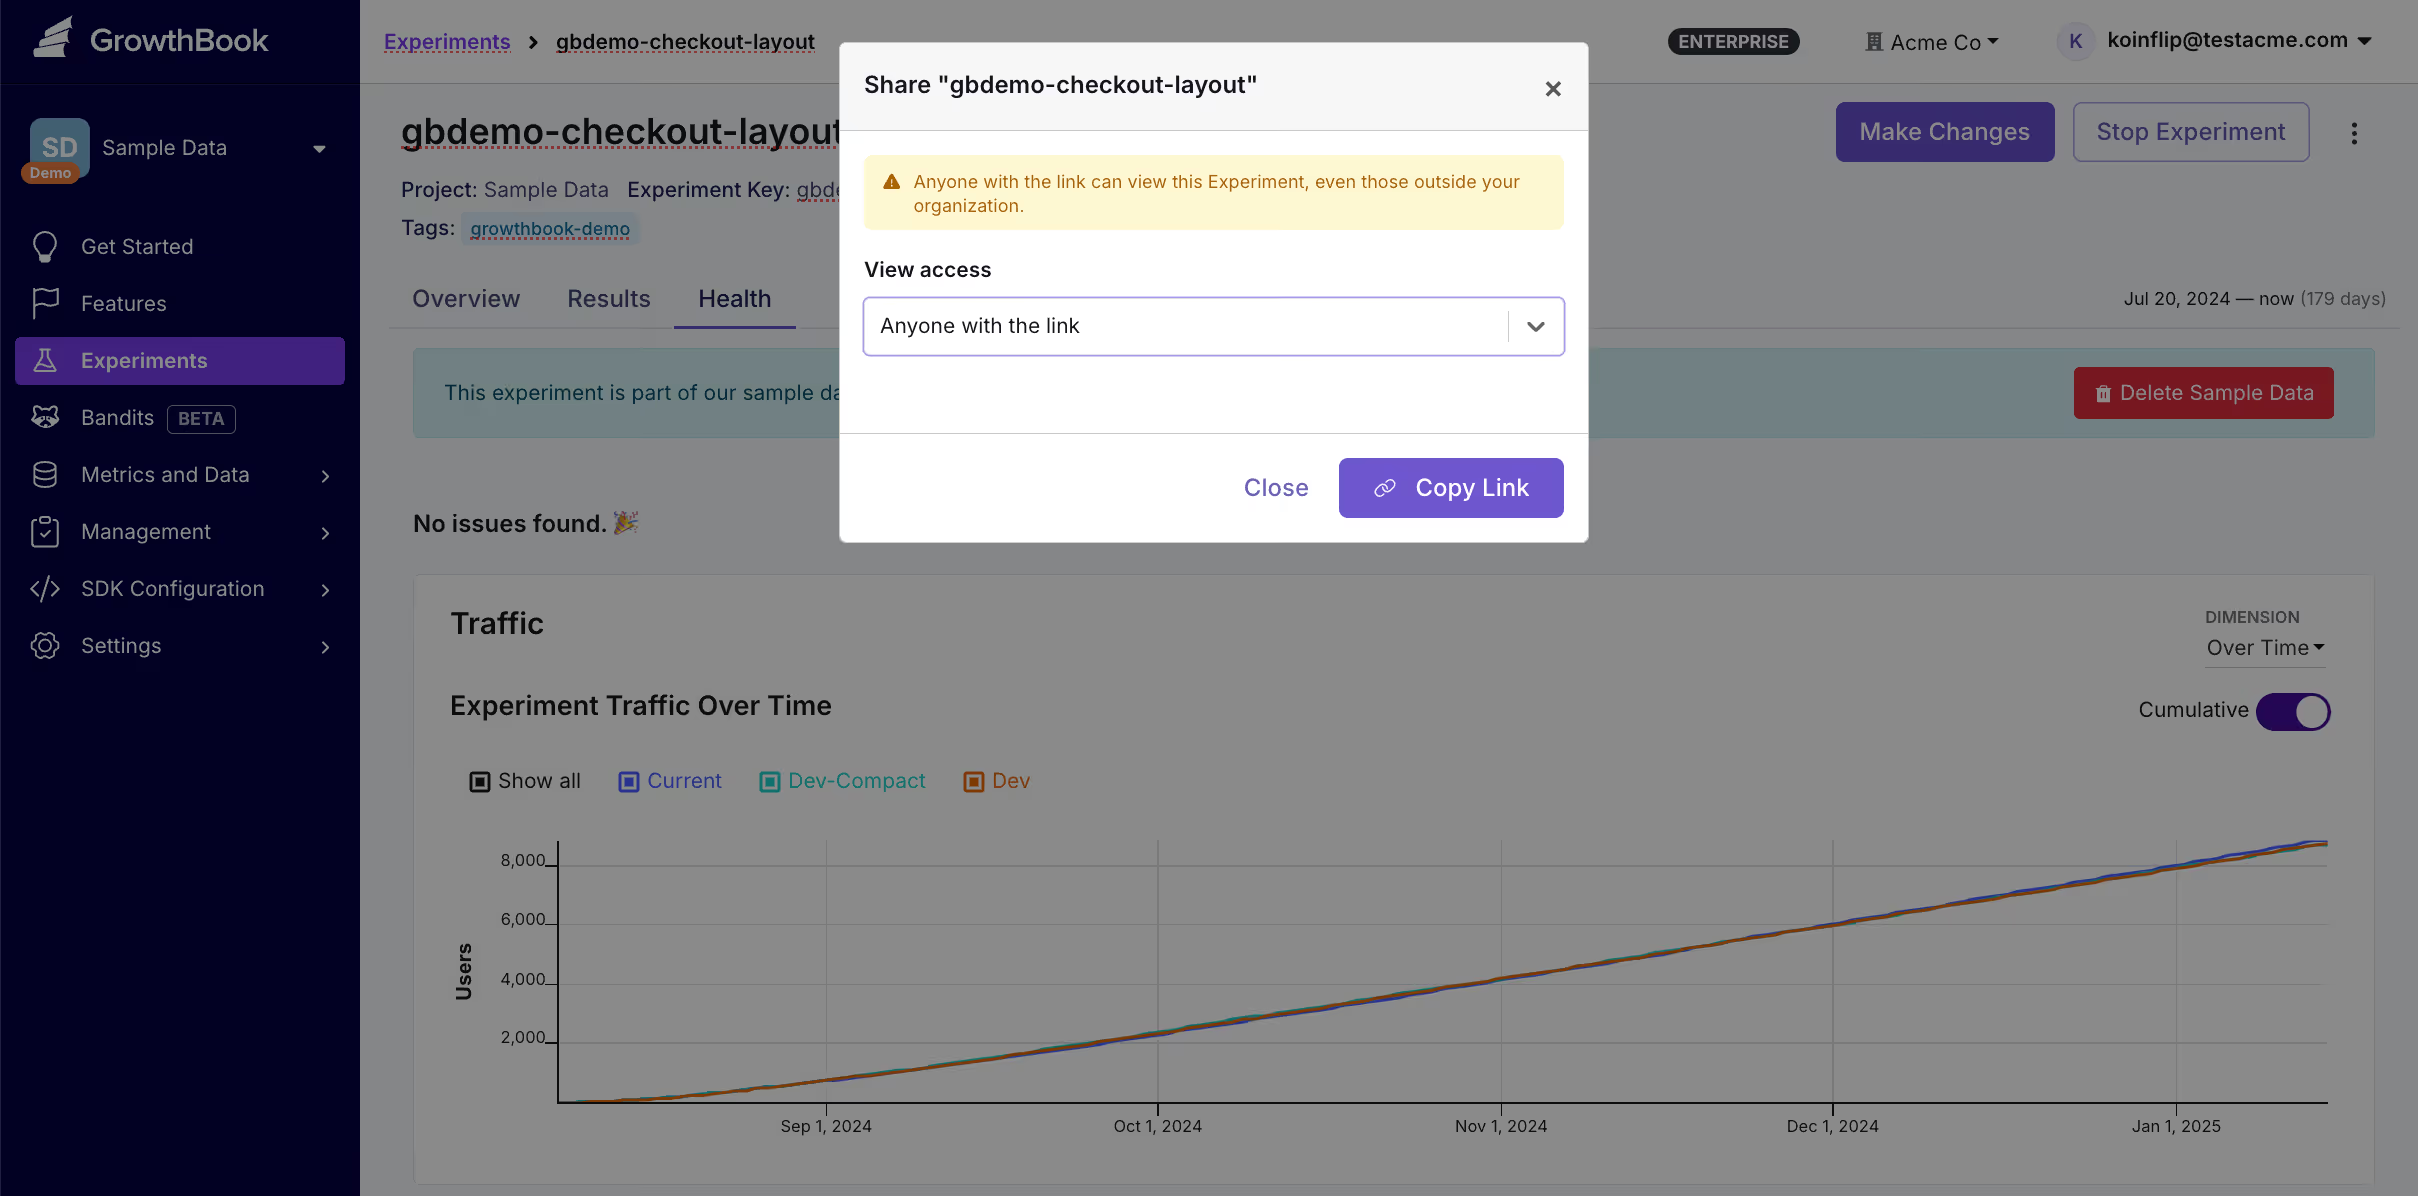
Need to share experiment results with stakeholders outside GrowthBook? Now you can generate public shareable links for specific experiments.
- Defaults to private, but you can opt in to share on an experiment-by-experiment basis
- Share insights in your company Slack, collaborate with external partners, update leadership, or even showcase big wins on LinkedIn.
Read more about Shareable Reports in our docs. This feature is available to all organizations, both free and paid.
New metrics - retention, count distinct, and max
We’ve added new kinds of metrics you can define on top of Fact Tables.
- Retention: Measure the percentage of users who return within a specific time window. For example, a “Week 2 Retention” metric that tracks the percentage of users who engaged with your app 7-14 days after seeing your experiment.
- Count Distinct: Aggregation option for mean, ratio, and quantile metrics. For example, a “Unique Videos” metric that counts all of the distinct video ids a user watched, ignoring repeats.
- Max: Aggregation option for mean, ratio, and quantile metrics. For example, a “High Score” metric that measures the highest score each user obtained in your game, no matter how many attempts it took to get there.
Retention metrics are available to Pro and Enterprise customers, and the new aggregation options are available to all organizations, both free and paid. Read more about these New Metrics in our docs.
Environment forking
When creating a new environment, you can now choose a parent environment to “fork” from - for example, creating a new Staging environment that is a fork of Production. This will copy all feature flag rules so the new environment starts out as an exact clone of the parent. After that point, the environments will be treated independently.
Environment forking becomes really powerful when combined with our REST API. For example, your CI/CD pipeline could fork a new ephemeral environment for each PR and automatically clean it up when the PR is closed.
The UI for manually creating new environment forks is available to all organizations, but programmatic access via the API is only available to Enterprise customers. Read more about environment forks in our docs.
CMS integrations - contentful and strapi
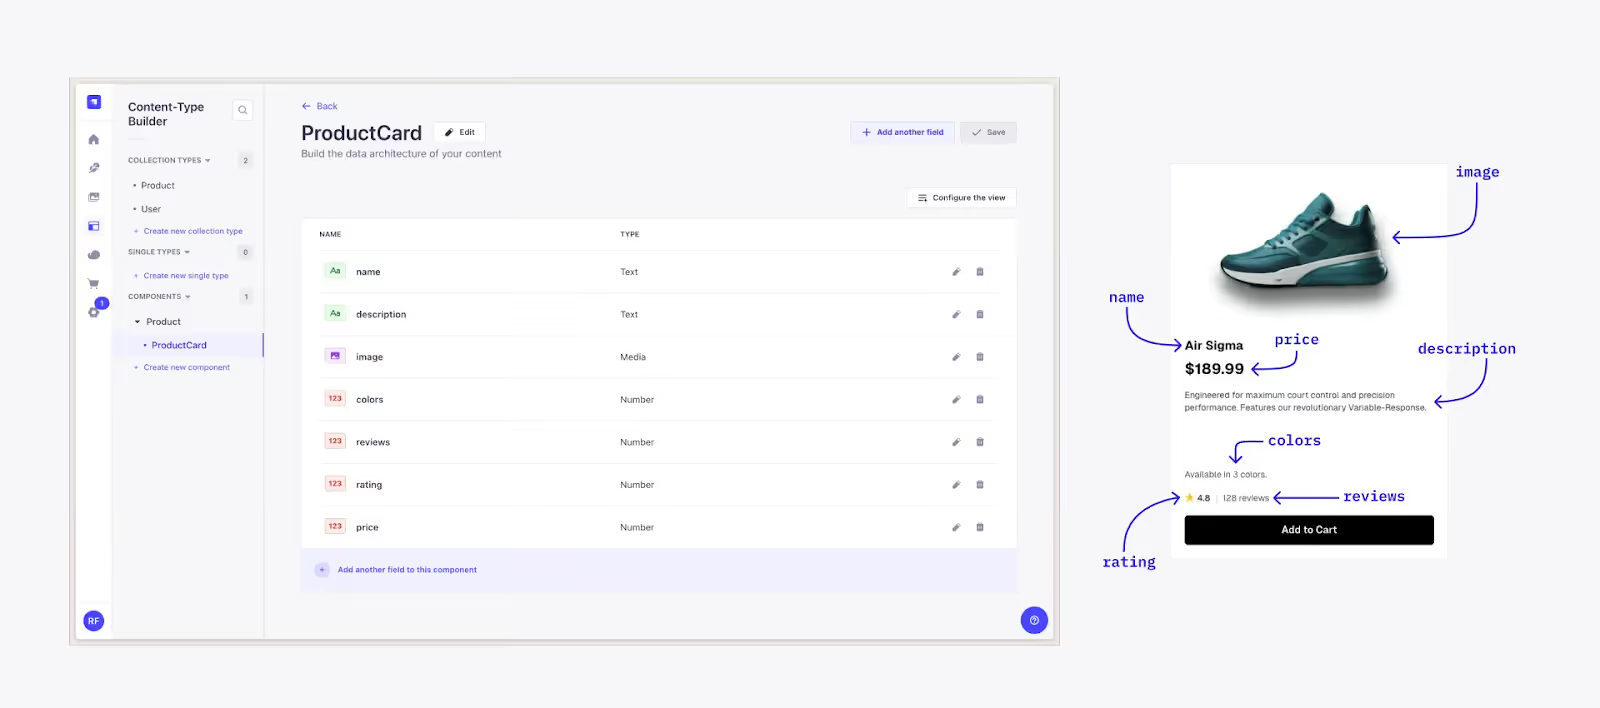
A/B testing inside your CMS just got easier. We now support Contentful and Strapi, two of the most popular headless CMS platforms.
Read our new guides for Contentful and Strapi to see how easy it is to experiment with your CMS content. We’d love to add more integrations like this in the future, so let us know which ones you most want to see!
Updated Node.js and Edge SDKs
We’ve made some huge changes to our JavaScript SDK to better support server-side applications. The new `GrowthBookClient` class is up to 3x faster and more memory efficient for Node.js applications. Read the new Node.js SDK docs or check out specific tutorials for Express.js or Deno/Hono.
We also revamped our Edge SDKs to be more flexible. New Lifecycle Hooks let you perform custom logic at various stages. This allows for custom routing, user attribute mutation, header and body (DOM) mutation, and custom feature flag and experiment implementations – while still preserving the ability to automatically run Visual and URL Redirect experiments and SDK hydration.
Simulate features
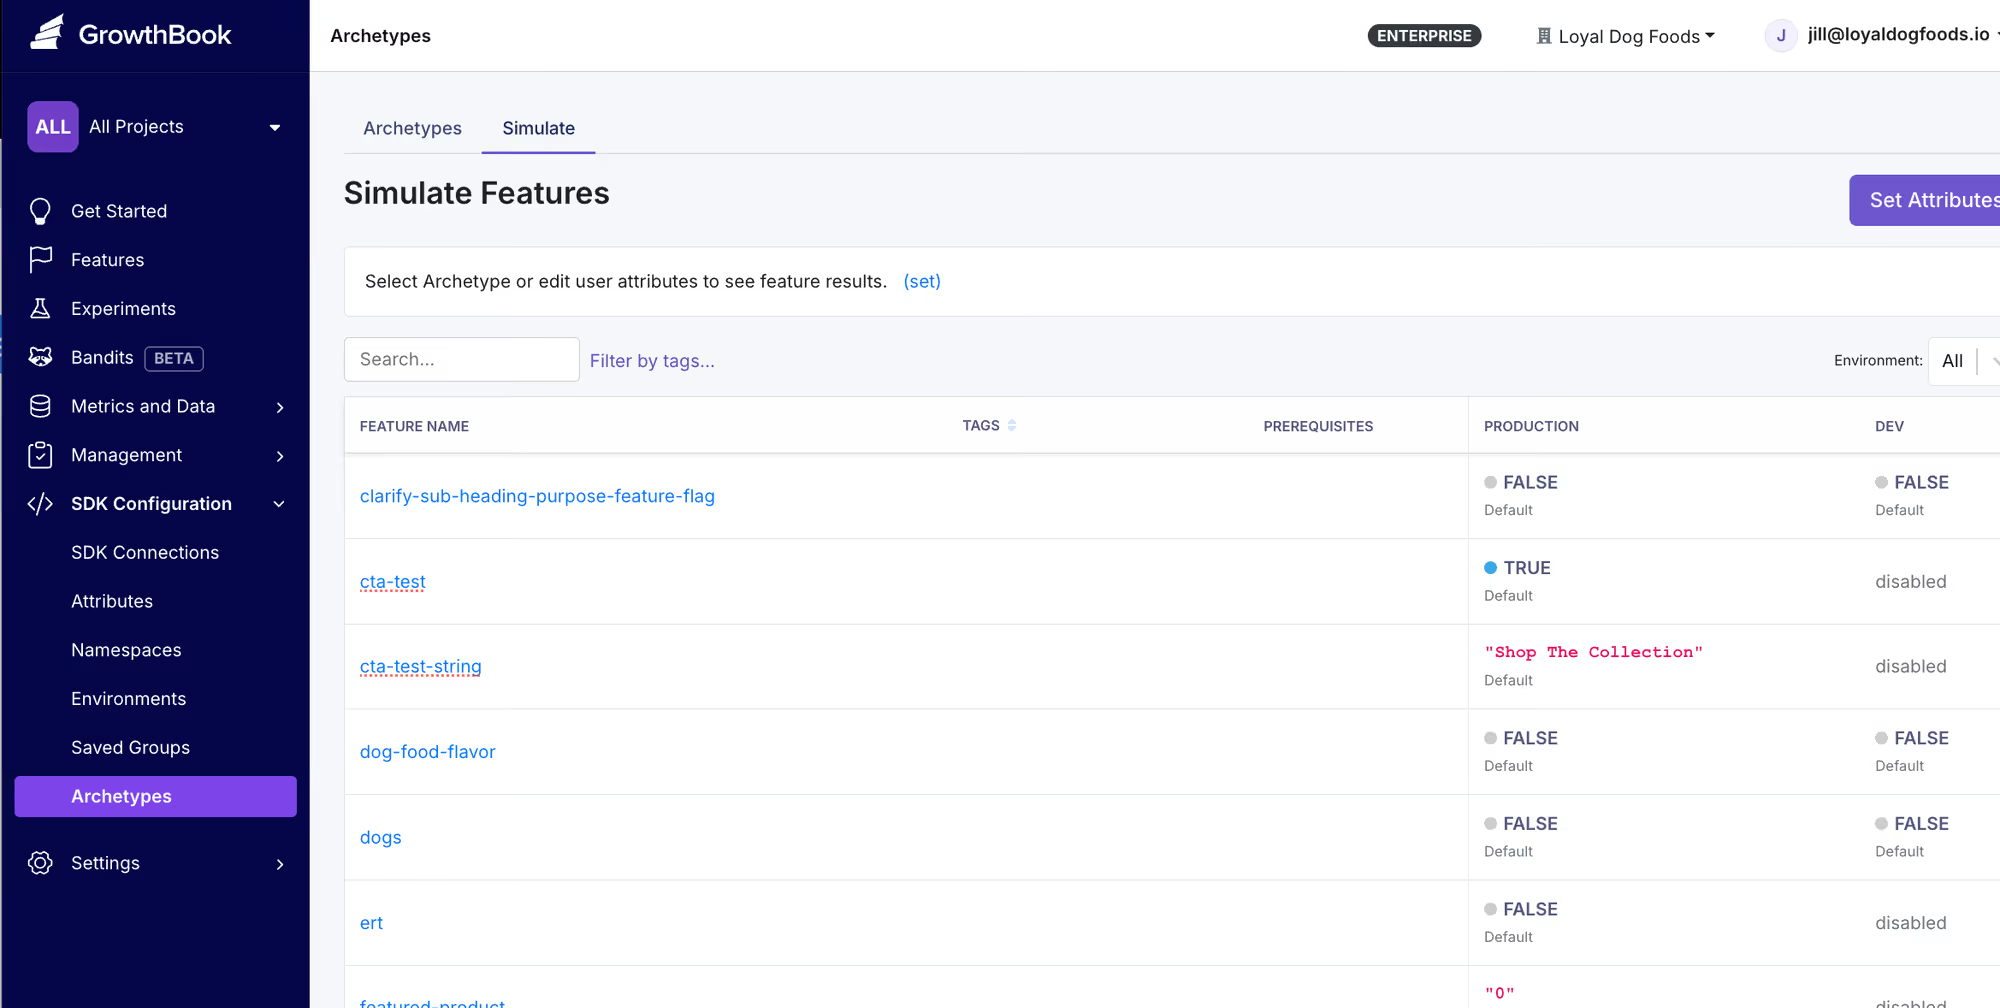
Way back in GrowthBook 2.5, we launched Archetypes to help you simulate how a specific feature flag behaves for a set of user attributes. Now there is a dedicated landing page for managing archetypes, along with a new “Simulate” section. Now, you can simulate all your feature flags at once and instantly verify how features will behave for any user.
The ability to simulate features is available to all Pro and Enterprise customers, but saving user attributes as a reusable “Archetype” is available only to Enterprise customers.

Move fast without breaking things: how GrowthBook and Rollbar empower product and ops teams
As technology evolves at breakneck speed, staying ahead means constantly innovating. Product teams are always experimenting with new features to improve user experiences, while operations teams focus on keeping systems reliable and performant. But what happens when experimentation introduces risks—like unexpected errors or performance issues?
That’s where the integration of GrowthBook’s feature flagging and Rollbar’s error monitoring comes in. Together, they empower product and ops teams to collaborate effectively, innovate confidently, and safeguard user experiences.
Innovate confidently with real-time error monitoring
GrowthBook’s feature flags make it easy to roll out features or experiments to specific user segments. Rollbar’s real-time error monitoring ensures you’re alerted immediately if something goes wrong, allowing your team to make fast, informed decisions.
Example: Imagine you’re rolling out a new recommendation algorithm to 10% of users. Rollbar detects an issue affecting a specific browser. With GrowthBook, you can disable the feature for those users instantly, without impacting the rest of the rollout. It’s experimentation without unnecessary risk.
Experiment without disruptions
Ops teams often face a tough trade-off between moving fast and keeping systems stable. By integrating Rollbar with GrowthBook, you create a safety net for experiments. With feature flags, your team can quickly address issues without waiting on a developer to ship a fix.
Clear insights for continuous improvement
Both product and ops teams rely on data to refine their strategies. The GrowthBook and Rollbar integration gives you visibility into how new features and experiments impact your application’s performance. With these insights, you can iterate faster and more effectively, making adjustments with precision.
Key Benefit: Use real-time data to confidently refine your experiments and features.
Building confidence in experimentation
Innovation doesn’t happen without experimentation, but for experimentation to thrive, it needs buy-in across the organization. GrowthBook and Rollbar make this easier by combining robust monitoring with the flexibility of feature flags. Teams can move quickly while still prioritizing reliability, making experimentation a safe, scalable part of your growth strategy.
Faster, safer innovation starts here
Product and ops teams need tools that let them move quickly without sacrificing quality. The GrowthBook + Rollbar integration is built for exactly that. It’s the ultimate way to deliver user experiences that delight while keeping your systems stable.
Want to see it in action? Learn more about the integration and discover how GrowthBook and Rollbar can help your team innovate smarter and safer.
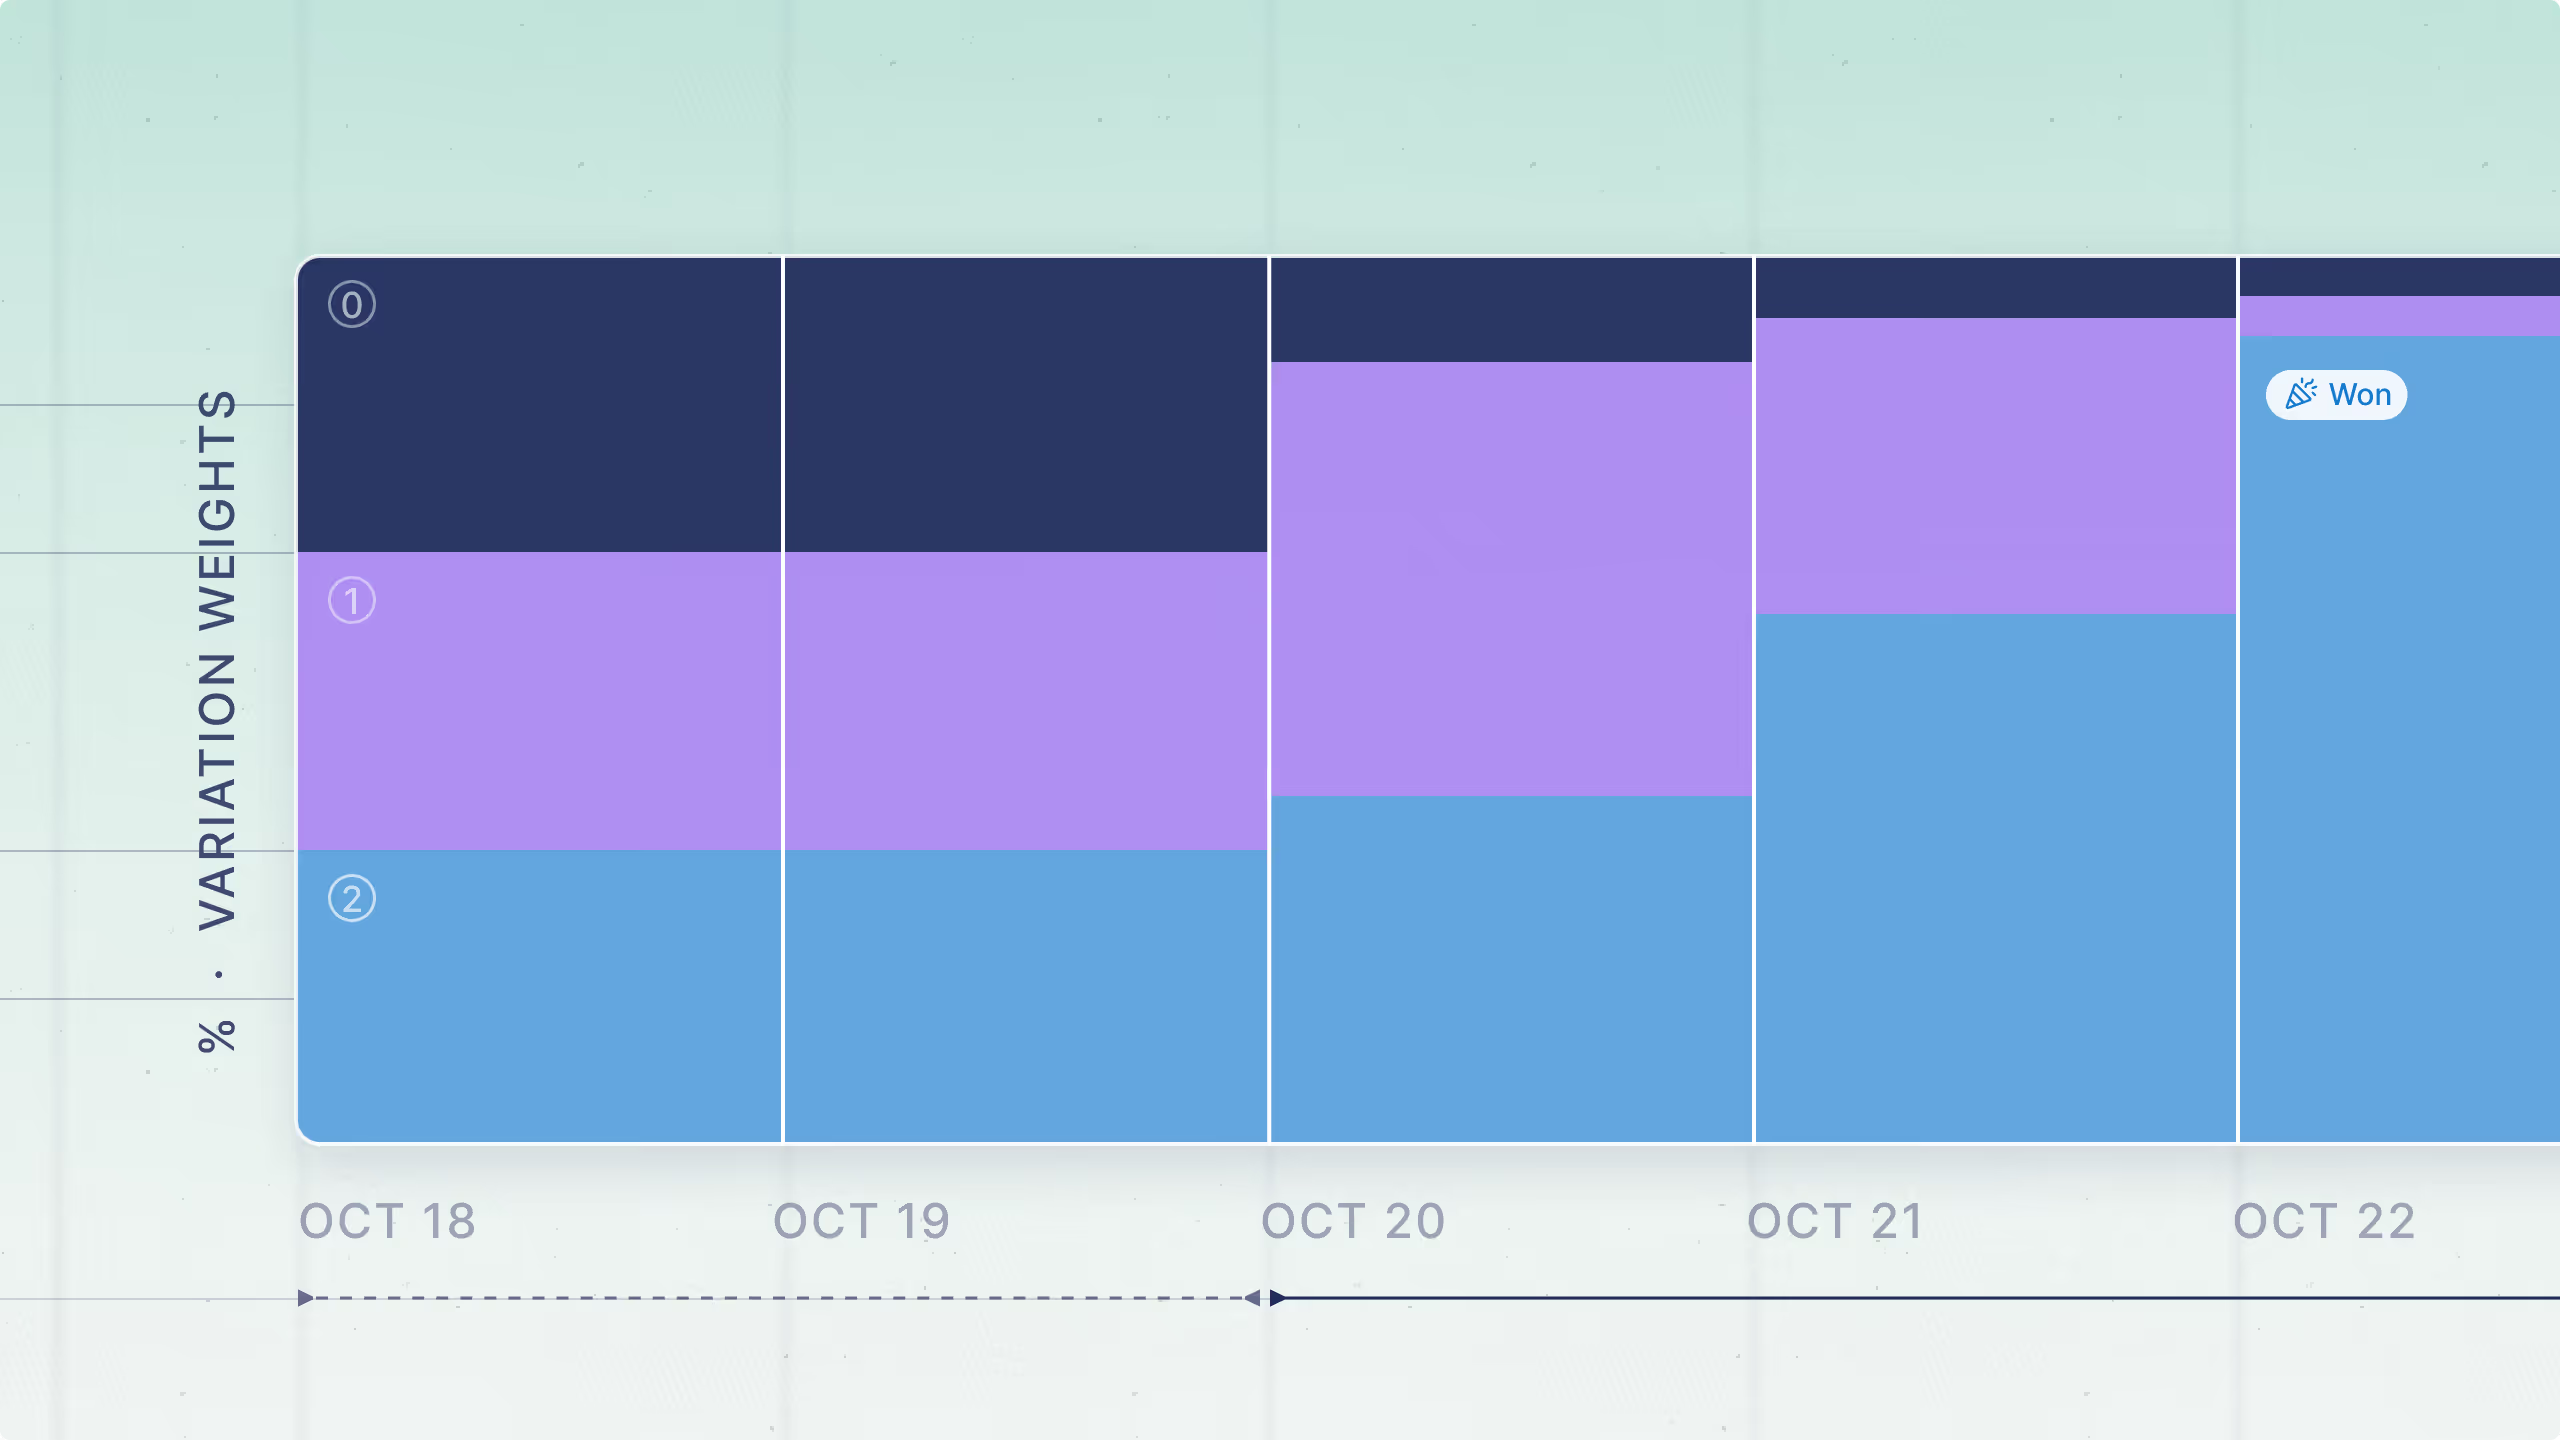
Introducing multi-armed bandits in GrowthBook
Bandits have been released in beta as part of GrowthBook 3.3 for Pro and Enterprise customers. See our documentation on getting started with bandits.
Multi-rmed bandits allow you to test many variations against one another, automatically driving more traffic towards better arms, and potentially discovering the best variation more quickly.
Bandits are built on the idea that we can simultaneously…
- explore different variations by randomly allocating traffic to different arms; and
- exploit the best performing variations by sending more and more traffic to winning arms.
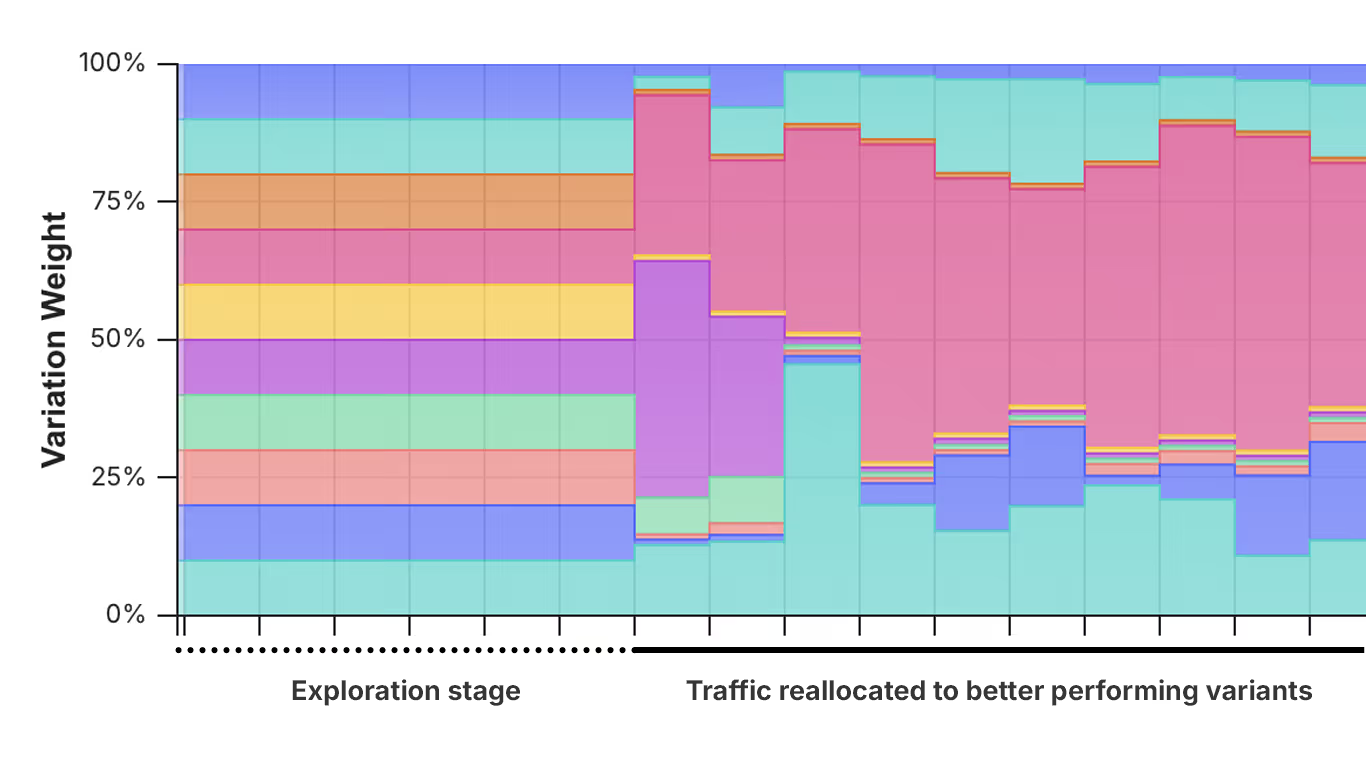
In online experimentation, bandits can be particularly useful if you have more than 4 variations you want to test against one another. Scenarios where bandits can be helpful include:
- You are running a short-term promotional campaign, and want to begin driving traffic to better variations as soon as there is any signal about which variation is best.
- You have many potential designs for a call-to-action button for a user sign-up, and you care more about just picking the best flow that leads to sign-up.
Furthermore, bandits work best when:
- Reducing the cost of experimentation is paramount. This is true in cases like week-long promotions, where you don’t have time to test 8 versions of a promotion and then launch it, so you want to test 8 versions and begin optimizing after just a few hours or on the first day.
- You have a clear decision metric that is relatively stable. Ideally, your decision metric should not be an extreme conversion rate metric (e.g. < 5% or > 95%), or if it’s a revenue metric, you should apply capping to prevent outliers from adding too much variance.
- You have many arms you want to test against one another, and care less about learning about user behavior on several metrics than about finding a winner.
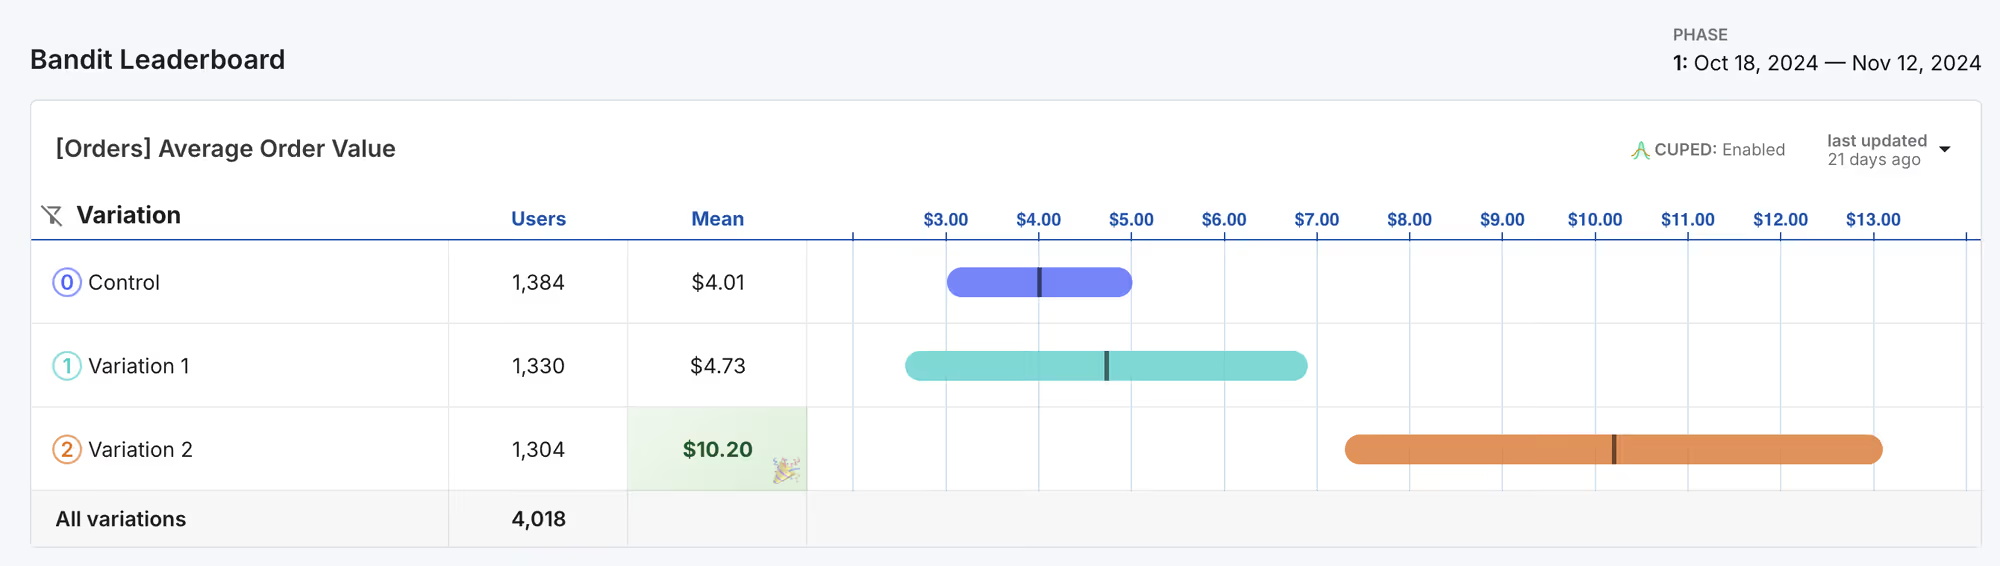
Read more about when and how to use bandits in our documentation.
The following table summarizes the differences between bandits and standard experiments.
What makes GrowthBook’s bandits special?
GrowthBook's bandits rely on Thompson Sampling, a widely used algorithm to balance exploring the value of all variations while driving most traffic to the better performers. However, our bandits differ in a few ways that ensure they work well in the context of digital experimentation.
Consistent user experience
Some bandit implementations do not preserve user experience across sessions, making them tricky to use when a stable user experience is important. Because bandits dynamically update the percentage of traffic going to each variation, if you run it on users who return to your site or product and do not preserve their user experience, they may be exposed to multiple variations over the course of a bandit.
This can lead to:
- Bad user experiences where your product frequently changes for an individual customer.
- Biased results.
GrowthBook uses Sticky Bucketing, a service that allows you to store user variations in some service, such as a cookie, so that when they return, they always get the same experience, even when the bandit has updated variation weights.
Setting up Sticky Bucketing in our HTML SDK is as easy as adding a parameter to our script tag.
<script async data-client-key="CLIENT_KEY" src="<https://cdn.jsdelivr.net/npm/@growthbook/growthbook/dist/bundles/auto.min.js>" data-use-sticky-bucket-service="cookie"></script>Implementing Multi-Armed Bandits in GrowthBook
Accommodates changing user behavior
GrowthBook’s bandits use a weighting method to prevent changing user behavior over time from biasing your results.
What is the issue? As your bandit runs, two things are changing: your bandit updates traffic allocations to your variations, and the kind of user entering your experiment changes (e.g., due to day-of-the-week effects). The correlation between these two can cause biased results if not addressed.
Imagine the following scenario:
You run a bandit that updates daily. You start your bandit on Friday, and you have two variations that have a 50/50 split (100 observations per arm). You observe a 45% conversion rate in Variation A, and a 50% conversion rate in Variation B. After the first bandit update, the weights become 10/90 (just as an illustration, the actual values would be different). The total traffic on Saturday is also 200 users, but this time Variation B gets 90% of the traffic. Conversion rates on weekdays tend to be higher than on weekends, regardless of variation. On Saturday, you observe a 10% conversion rate in Variation A and a 15% conversion rate in Variation B. On both Friday and Saturday, Variation B has larger conversion rates, but if you naively combine the data across both days, Variation A looks like the winner:
The combined conversion rate for Variation B is 27.5%, while for Variation A it is 39%, even though Variation B outperformed Variation A on both days of the experiment. Clearly, something is wrong here. In fact, sharp-eyed readers might notice this is a case of Simpson’s Paradox.
How did we solve it? We use weights to estimate the mean conversion rate for each bandit arm under the scenario that equal experimental traffic was assigned to each arm throughout the experiment. In this scenario, we can recompute the observed conversion rates as if the arms received equal traffic (e.g., on Saturday, we had 10/100 conversions instead of 2/20). Using these adjusted conversion rates, the combined conversion rates now make sense:
Variation B is now the winner. By accounting for changes in overall traffic each day, the combined conversion rate now appropriately reflects differences in conversion rates and traffic variation over time. Our bandit applies a similar logic to ensure that day-of-the-week effects and other temporal differences do not bias your bandit results.
Built on a leading warehouse-native experimentation platform
GrowthBook is the leading open-source experimentation platform. It is designed to live on top of your existing data infrastructure, adding value to your tech stack without complicating it.
GrowthBook integrates with BigQuery (GA4), Snowflake, Databricks, and many more data warehouse solutions. If your events land in your data warehouse within minutes, then GrowthBook bandits can adaptively allocate traffic within hours or less.

Get started
To get started with Bandits in GrowthBook, check out our bandits set-up guide, or if you’re new to GrowthBook, get started for free.

GrowthBook Version 3.3
We’ve been hard at work on GrowthBook version 3.3, which includes Multi-Arm Bandits, powerful new metric capabilities, a new design system, and an exciting announcement! Here’s everything you need to know:
Multi-arm bandits
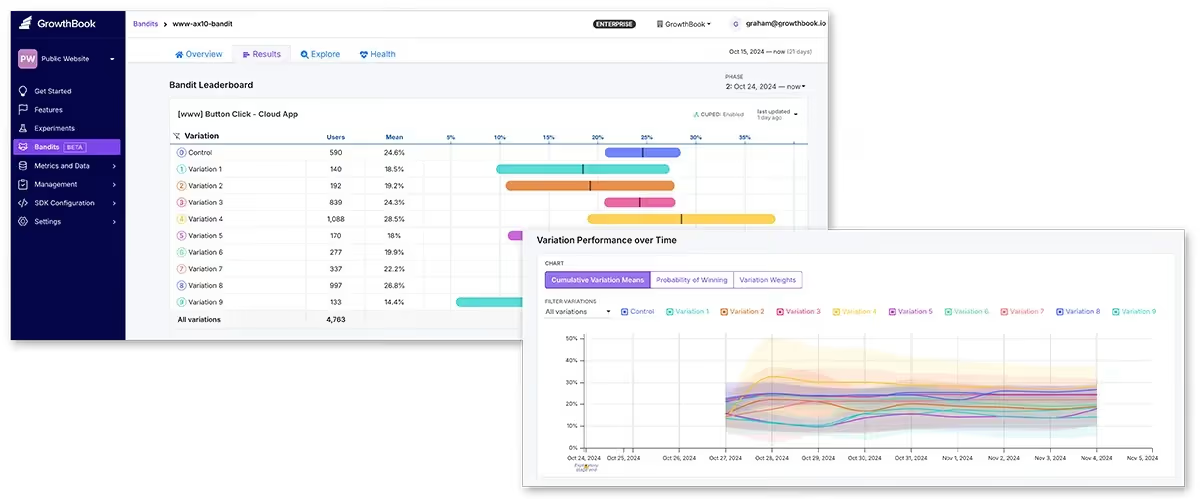
Multi-Arm Bandits are experiments that dynamically allocate traffic to maximize efficiency, sending more traffic to top-performing variations as tests run. This minimizes losses and reduces risks when testing multiple variants.
Multi-Arm Bandits were months in the making and we're excited to share it with everyone. Bandits are currently in beta and available to all Pro and Enterprise customers.
Metric improvements
In this release, we've made huge improvements to every aspect of metrics and fact tables. We don't have room to list them all, but here are a few highlights.
Metric groups
Save and organize groups of metrics so you can streamline experiment setup. Groups are passed by reference so updates will apply to all experiments using the group. You can also adjust the order in which metrics are shown:
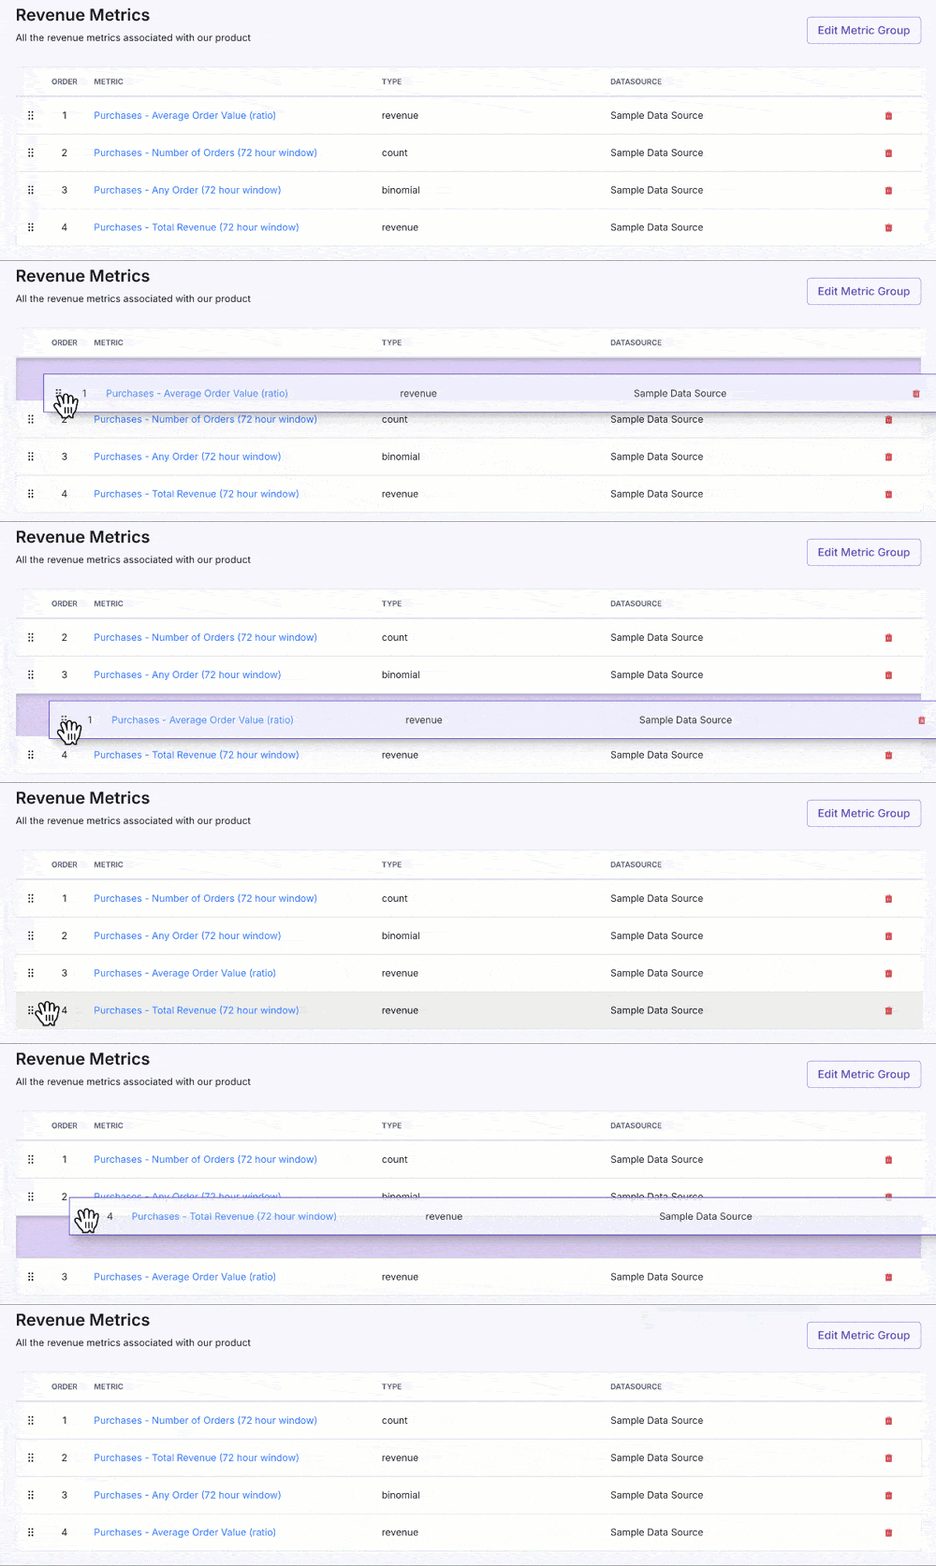
Live SQL preview
Now available when creating or editing fact table metrics, so you can see how metrics behave under the hood in real time.
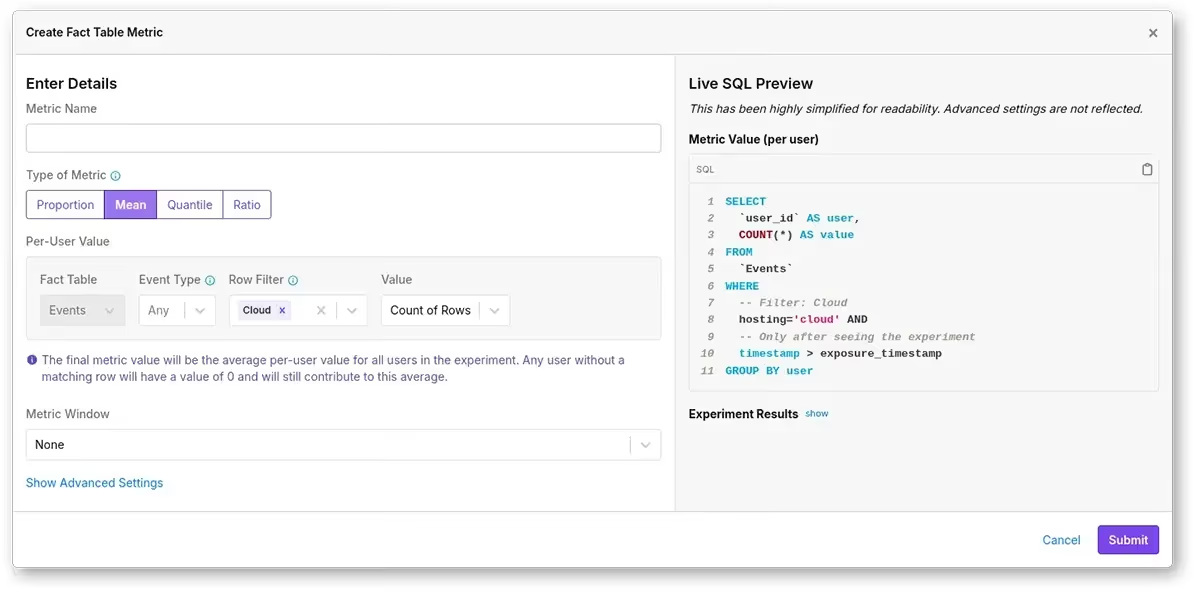
Inline and eser filters
Simplify the UI and enable a new class of metrics for fact tables that were previously impossible. Learn more

These upgrades empower you to create, organize, and analyze metrics more efficiently than ever before.
New design system
We've started migrating GrowthBook to a new design system built on Radix UI. While this work is ongoing, you’ll already notice slicker visuals, better keyboard navigation, and improved Dark Mode support!
🚀 Built-in managed warehouse (coming soon)
Not every team has the resources to set up and maintain its own data warehouse, which is why we’re launching a fully managed ClickHouse option within GrowthBook Cloud!
This Built-in Warehouse sits on top of our existing SQL and stats engine, so it’s fully compatible with all of our advanced experimentation settings, and you’ll automatically benefit from ongoing improvements to our Warehouse-Native offering.
We have a limited number of spots in our private beta, so reach out if you’re interested in being among the first to try it out!

Announcing GrowthBook on JSR
GrowthBook is committed to supporting modern platforms, bringing advanced feature flagging and experimentation to where you are. We’re excited to announce the availability of our JavaScript SDK on JSR, the modern open-source JavaScript registry. This integration empowers JavaScript and TypeScript developers with a seamless experience for implementing and managing feature flags in their applications.
JSR simplifies the process of publishing and importing JavaScript modules, offering robust features like TypeScript support, auto-generated documentation, and enhanced security through provenance attestation. This collaboration brings these benefits to GrowthBook users, streamlining the integration and utilization of feature flagging in their development workflows.
Using the GrowthBook JS SDK via JSR offers an excellent developer experience, with first-class TypeScript support, auto-generated documentation accessible in your code editor, and more.
How to install GrowthBook from JSR
Get started with GrowthBook using the deno add command:
deno add jsr:@growthbook/growthbookOr using npm:
npx jsr add @growthbook/growthbookThe above commands will generate a deno.json file, listing all project dependencies.
{
  "imports": {
    "@growthbook/growthbook": "jsr:@growthbook/growthbook@0.1.2"
  }
}deno.json
Use GrowthBook with express
Let’s use GrowthBook with an Express server. In our main.ts file, we can write:
import express from "express";
import { GrowthBook } from "@growthbook/growthbook";

const app = express();

app.use(function (req, res, next) {
  req.growthbook = new GrowthBook({
    apiHost: "<https://cdn.growthbook.io>",
    clientKey: "sdk-qtIKLlwNVKxdMIA5",
  });

  req.growthbook.setAttributes({
    id: req.user?.id,
  });

  res.on("close", () => req.growthbook.destroy());

  req.growthbook.init({ timeout: 1000 }).then(() => next());
});

app.get("/", (req, res) => {
  const gb = req.growthbook;

  if (gb.isOn("my-boolean-feature")) {
    res.send("Hello, boolean-feature!");
  }

  const value = gb.getFeatureValue("my-string-feature", "fallback");

  res.send(`Hello, ${value}!`);
});

console.log("Listening on port 8000");
app.listen(8000);Finally, you can run the following command to execute:
deno -A main.tsDepending on how you’ve set up your feature flags in GrowthBook (sign up for free), the response will be different:

Check out our official docs to learn more about feature flags, creating and running experiments, and analyzing experiments.
What’s next?
With GrowthBook's JS SDK now on JSR, it’s even easier to bring the power of feature flags and A/B testing to any JavaScript environment.
- Check out JSR, the JavaScript registry built for the modern web.
- Read the announcement on Deno's blog.
- Learn more about GrowthBook’s JS SDK.
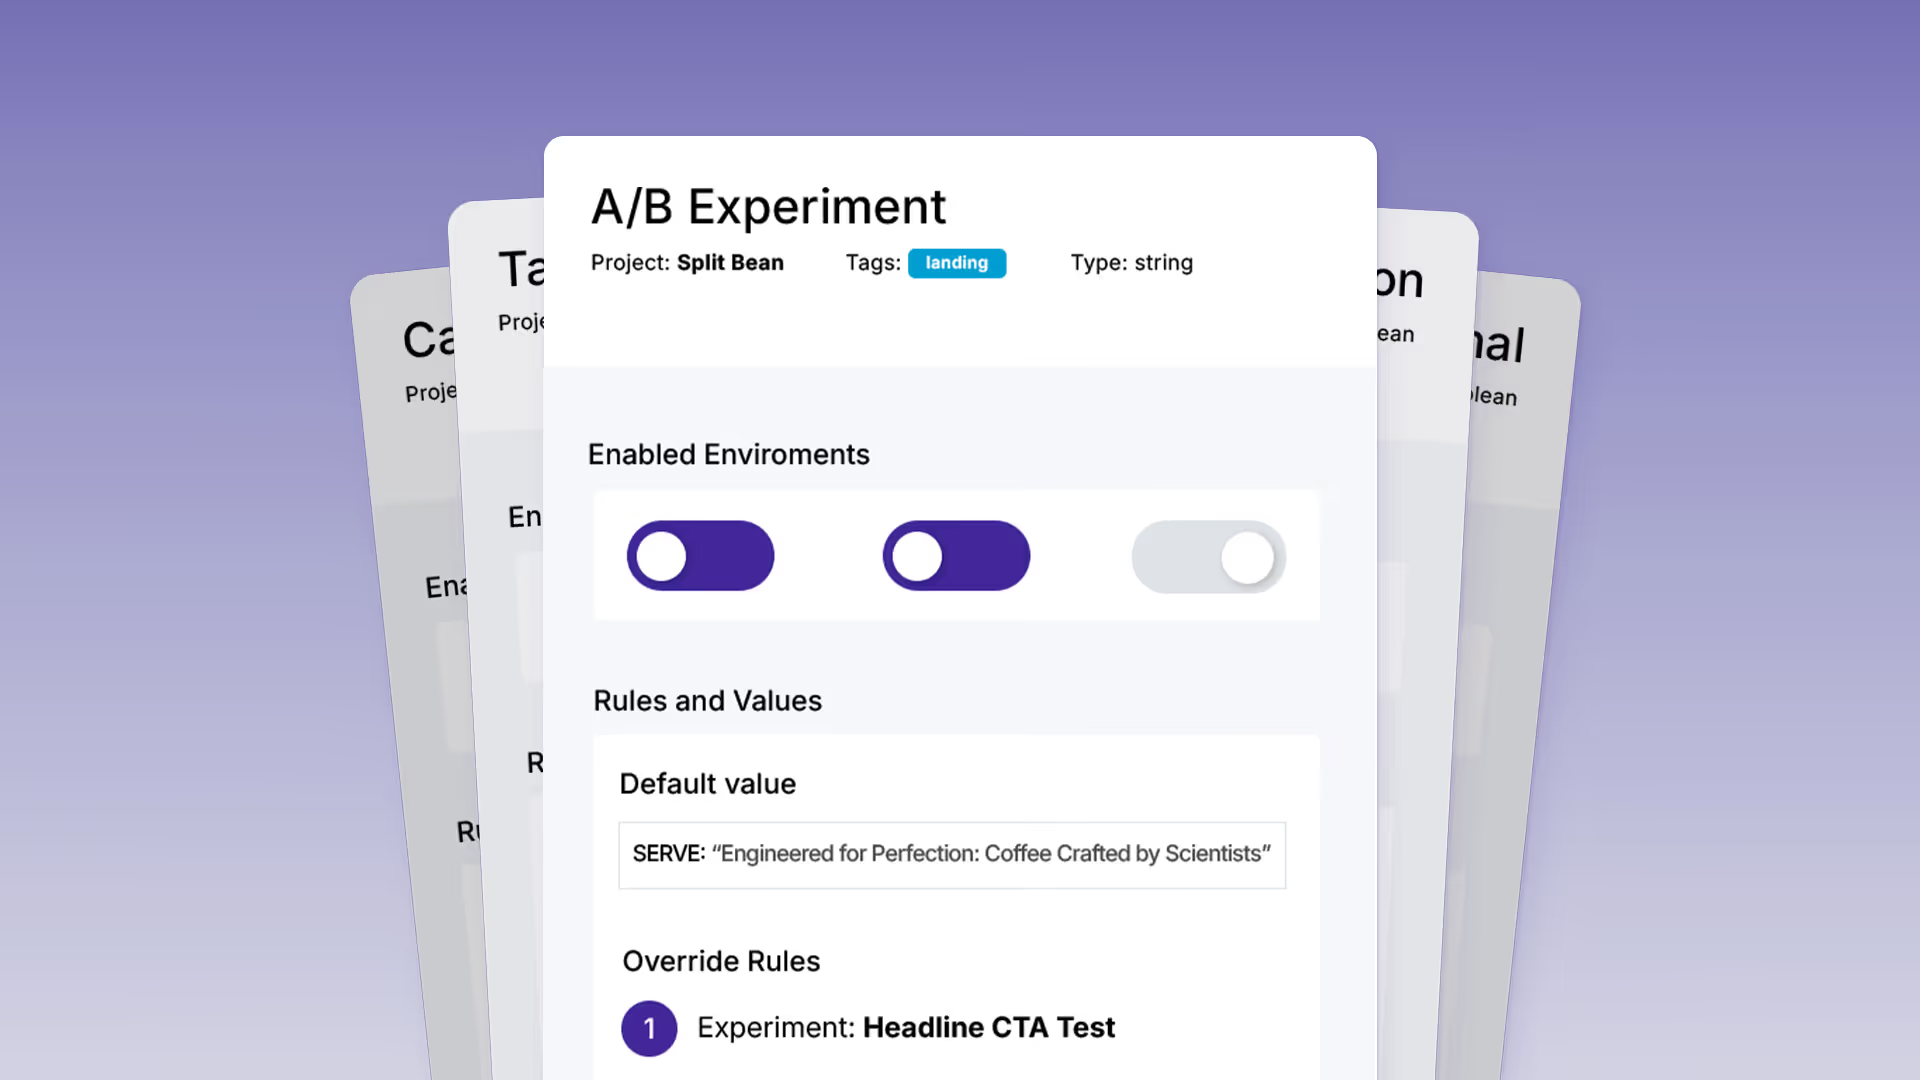
5 ways to use feature flags for smarter releases
At their most basic, feature flags are like light switches: they let you turn features on and off. But behind this simple function lies a world of possibilities. With feature flags, you can ship faster, reduce risk, and deliver personalized experiences without constant code changes or complicated deployments. In this guide, we’ll explore 5 essential ways to use feature flags in GrowthBook to optimize your software development process and ship smarter.

1. A/B testing
One of the most common use cases for feature flags is to power A/B tests. A/B testing lets you compare a control (your current version) with one or more variants to see which performs better. Whether you're optimizing call-to-action copy, testing pricing models, or tweaking product recommendations, A/B testing helps you make data-driven decisions.

Example: testing calls to action
Pretend you have a coffee company called, Split Bean, founded by former nuclear physicists. Their current homepage headline, "Engineered for Perfection: Coffee Crafted by Scientists," communicates their unique story. But what if a punchier headline would sell more beans? Time to set up a test to find out.
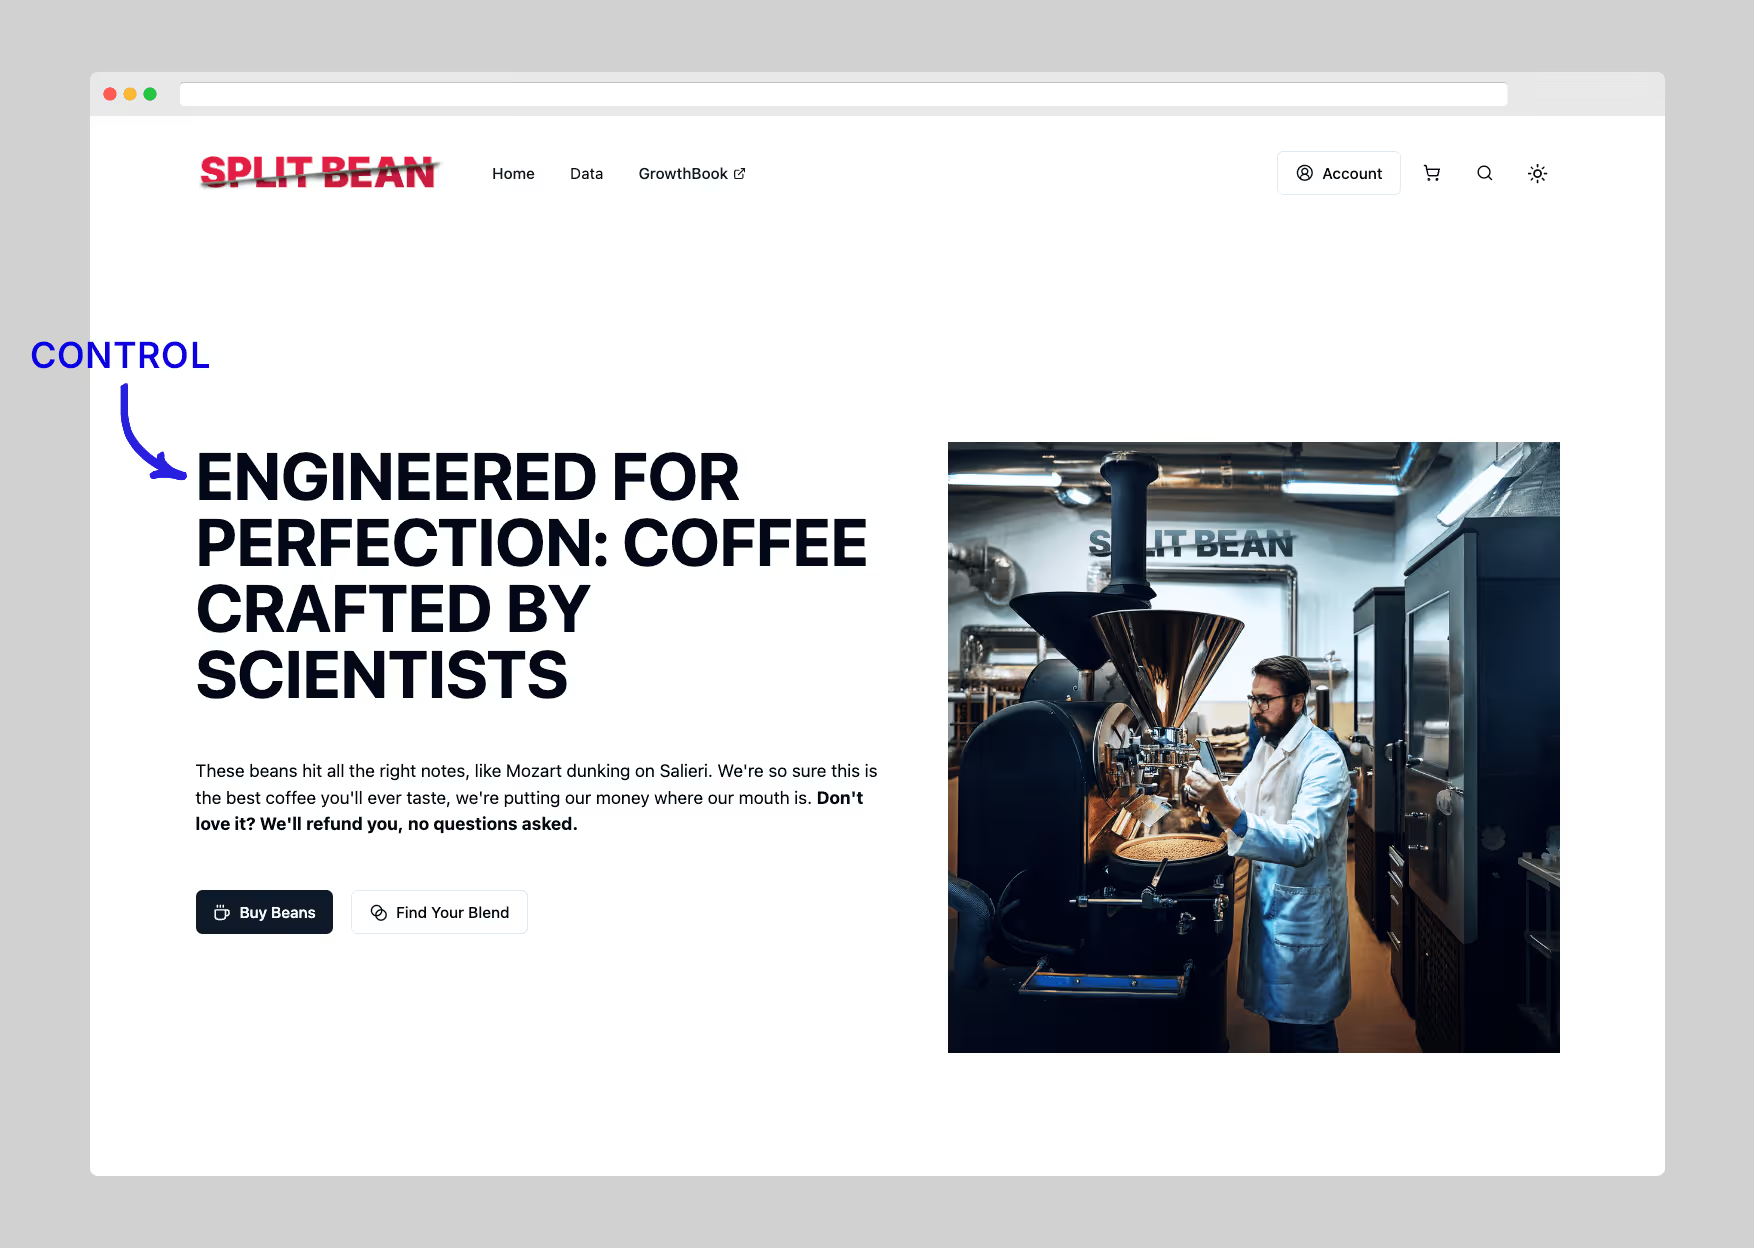
- Create a feature flag: In GrowthBook, navigate to the Features section and create a new feature called
headline. Set the default value to your current headline.
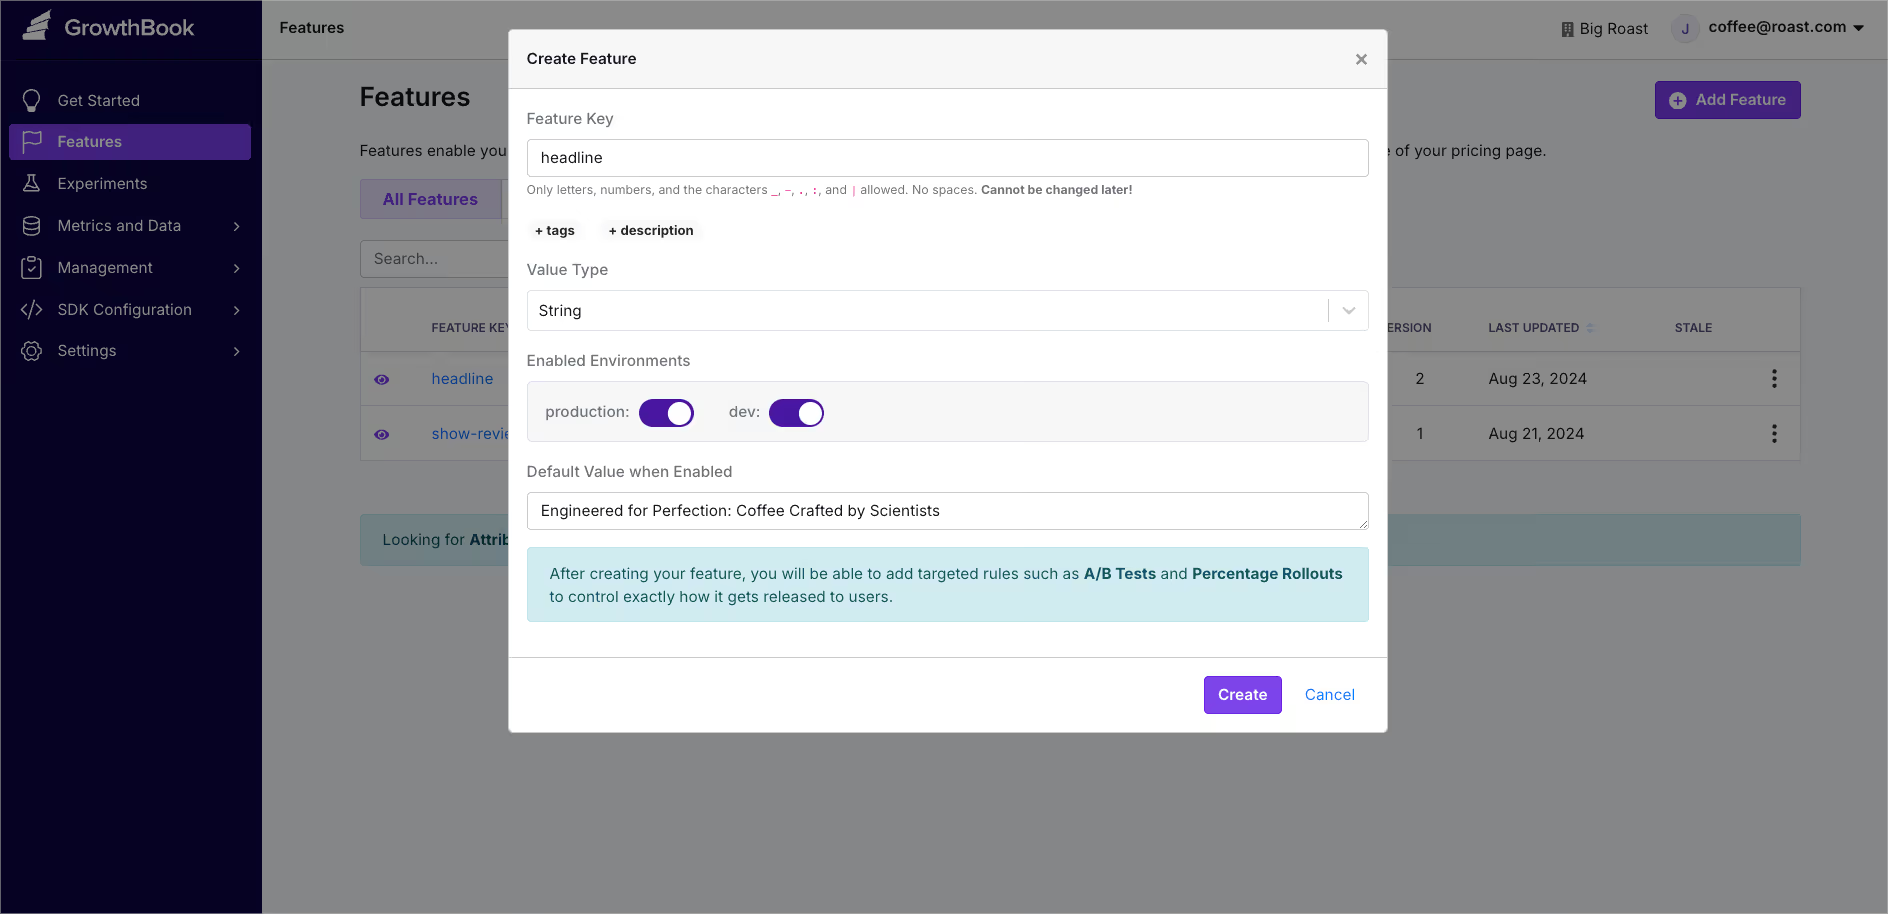
- Add an experiment: After saving the flag, add an Experiment Rule to split traffic between your original headline and the new variant. For a punchier approach, we’ll try “Aromas That’ll Slap You Awake Faster Than a Cold Shower.”
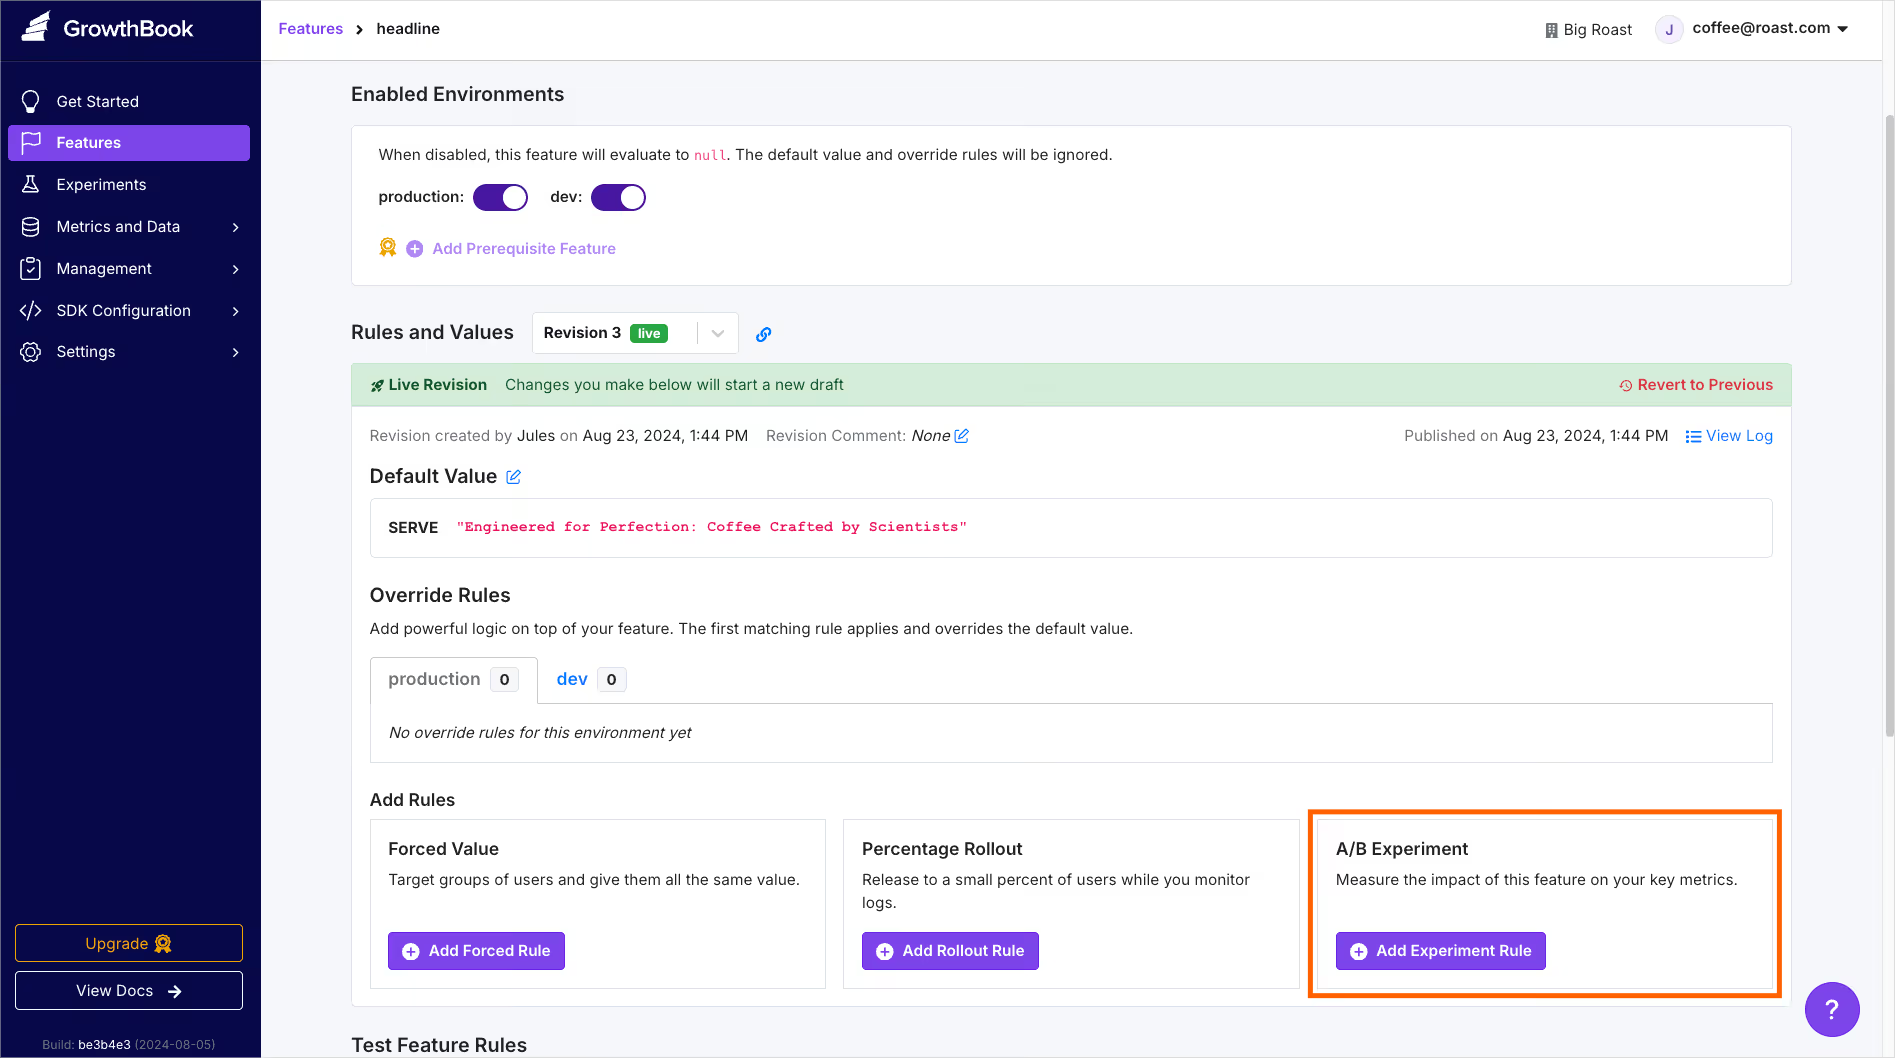
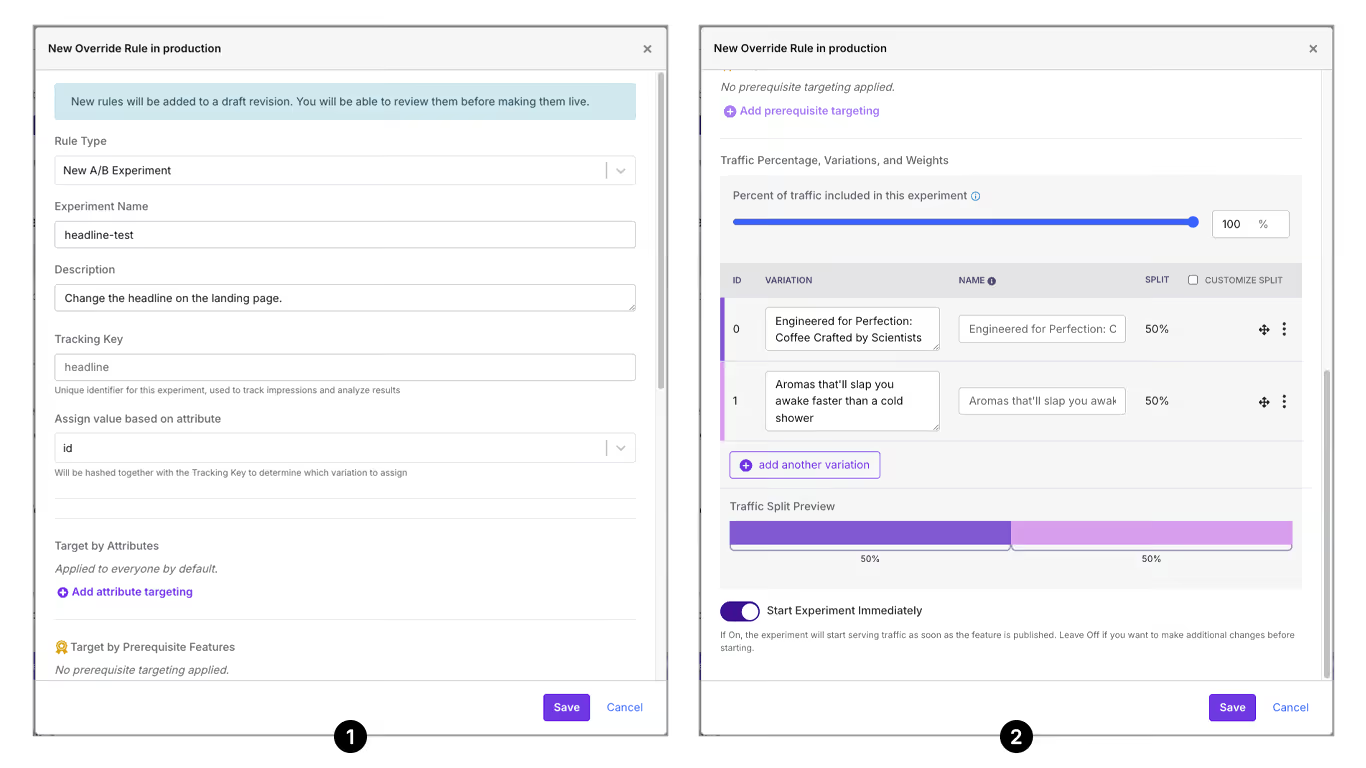
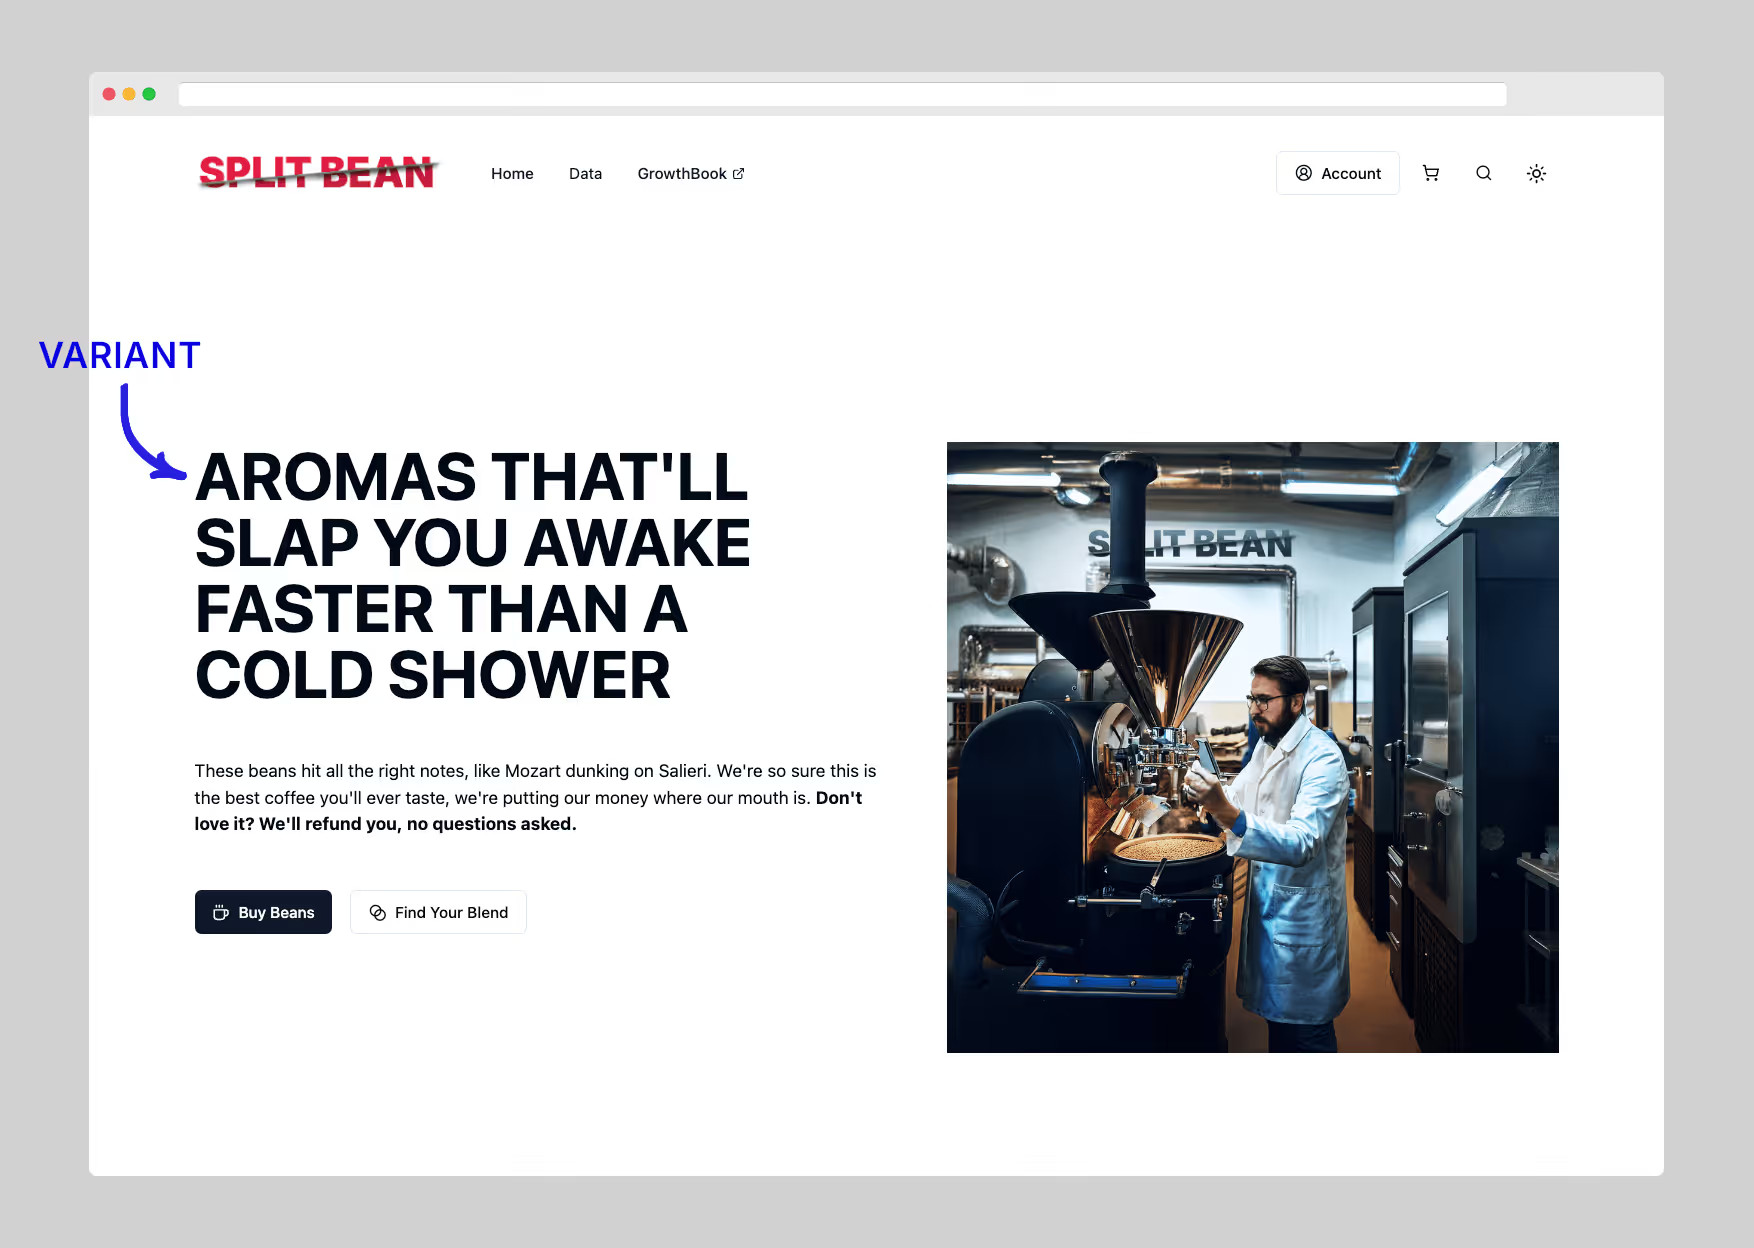
- Analyze the experiment: We'll need to wait for some customers to visit, but which version do you think will win?
A/B testing is a powerful way to ensure you’re making decisions based on real data, which is key to driving engagement and loyalty, and feature flags make it easy to deliver tailored experiences to different user segments, and, in turn, provide a better product for your customers. 💪
2. Personalization with feature flags
Personalization is the key to driving engagement and loyalty, and feature flags make it easy to deliver tailored experiences to different segments of users.
Example: rolling out a custom blend feature
Our favorite coffee company, Split Bean, has launched a custom-blend feature that lets users choose beans, roast levels, and artwork.
But this new feature isn’t available to just anyone—initially, it was only available to US customers on an annual subscription. Feature flags offer a streamlined way to restrict custom blends to only these customers.
- Create a feature flag: Set up a
custom-blendflag that defaults to false. - Add targeting rules: Use GrowthBook’s Forced Rules to define who can see the feature—users in the US with an annual subscription.
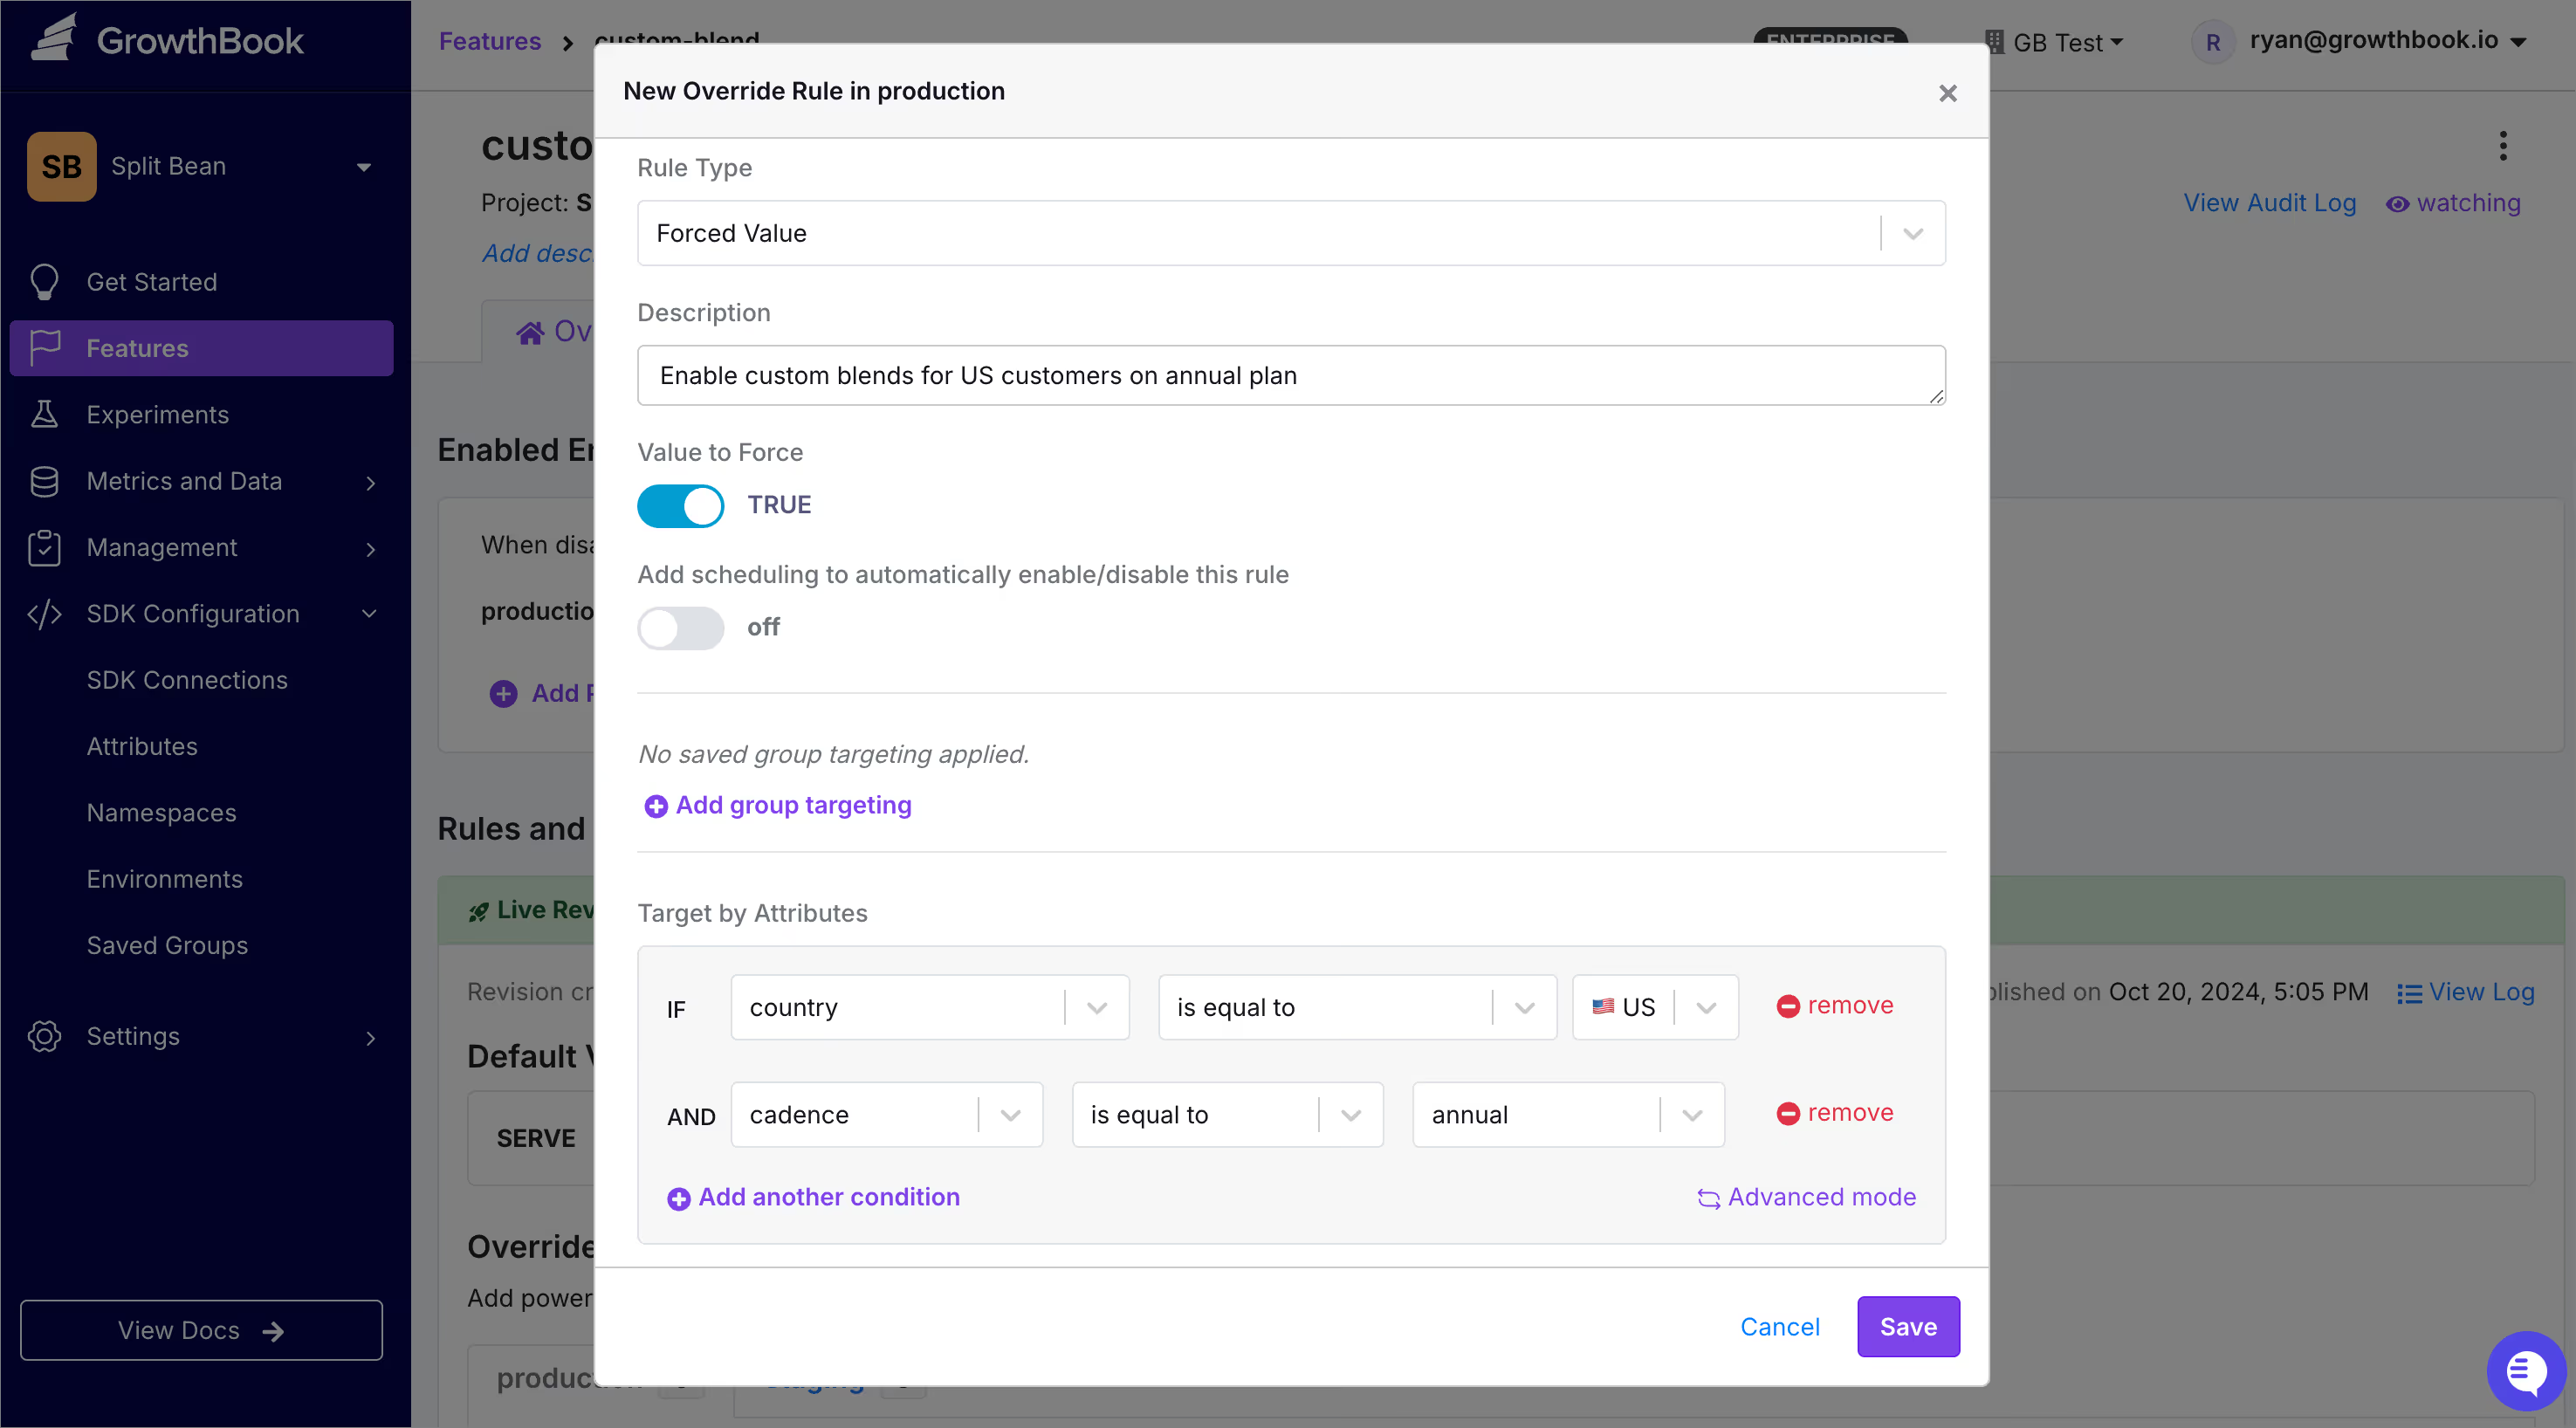
Wondering where the location and subscription values come from? In GrowthBook, define these attributes via SDK Configuration → Attributes. Then, in your app, pass these same attributes to your GrowthBook instance. Go to docs.
By using feature flags, Split Bean can easily manage who gets access to their custom blend feature and refine their marketing efforts with precision.

This level of personalization can be applied to various scenarios, from displaying cookie banners based on location to offering exclusive content for premium subscribers.
3. Targeted releases
When rolling out a new feature, testing with a small, trusted group of users first is a smart way to catch potential issues. This is where targeted releases come in handy.
Example: split bean coffee review
Split Bean is launching a new features section to showcase all the glowing reviews from their customers. While adding the section seems relatively straightforward, it requires several moving parts: database calls, responsive styling, and the inclusion of user-generated content—all of which could break unexpectedly!
By using feature flags, Split Bean can release the feature to internal beta users.
- Like before, create a feature flag. Call it
show-reviewswith a default value of false, so the reviews will be off for all users. - Add a Forced Rule, set the value to true, and define rules so that reviews show when a user’s company is Split Bean and their beta attribute is true.
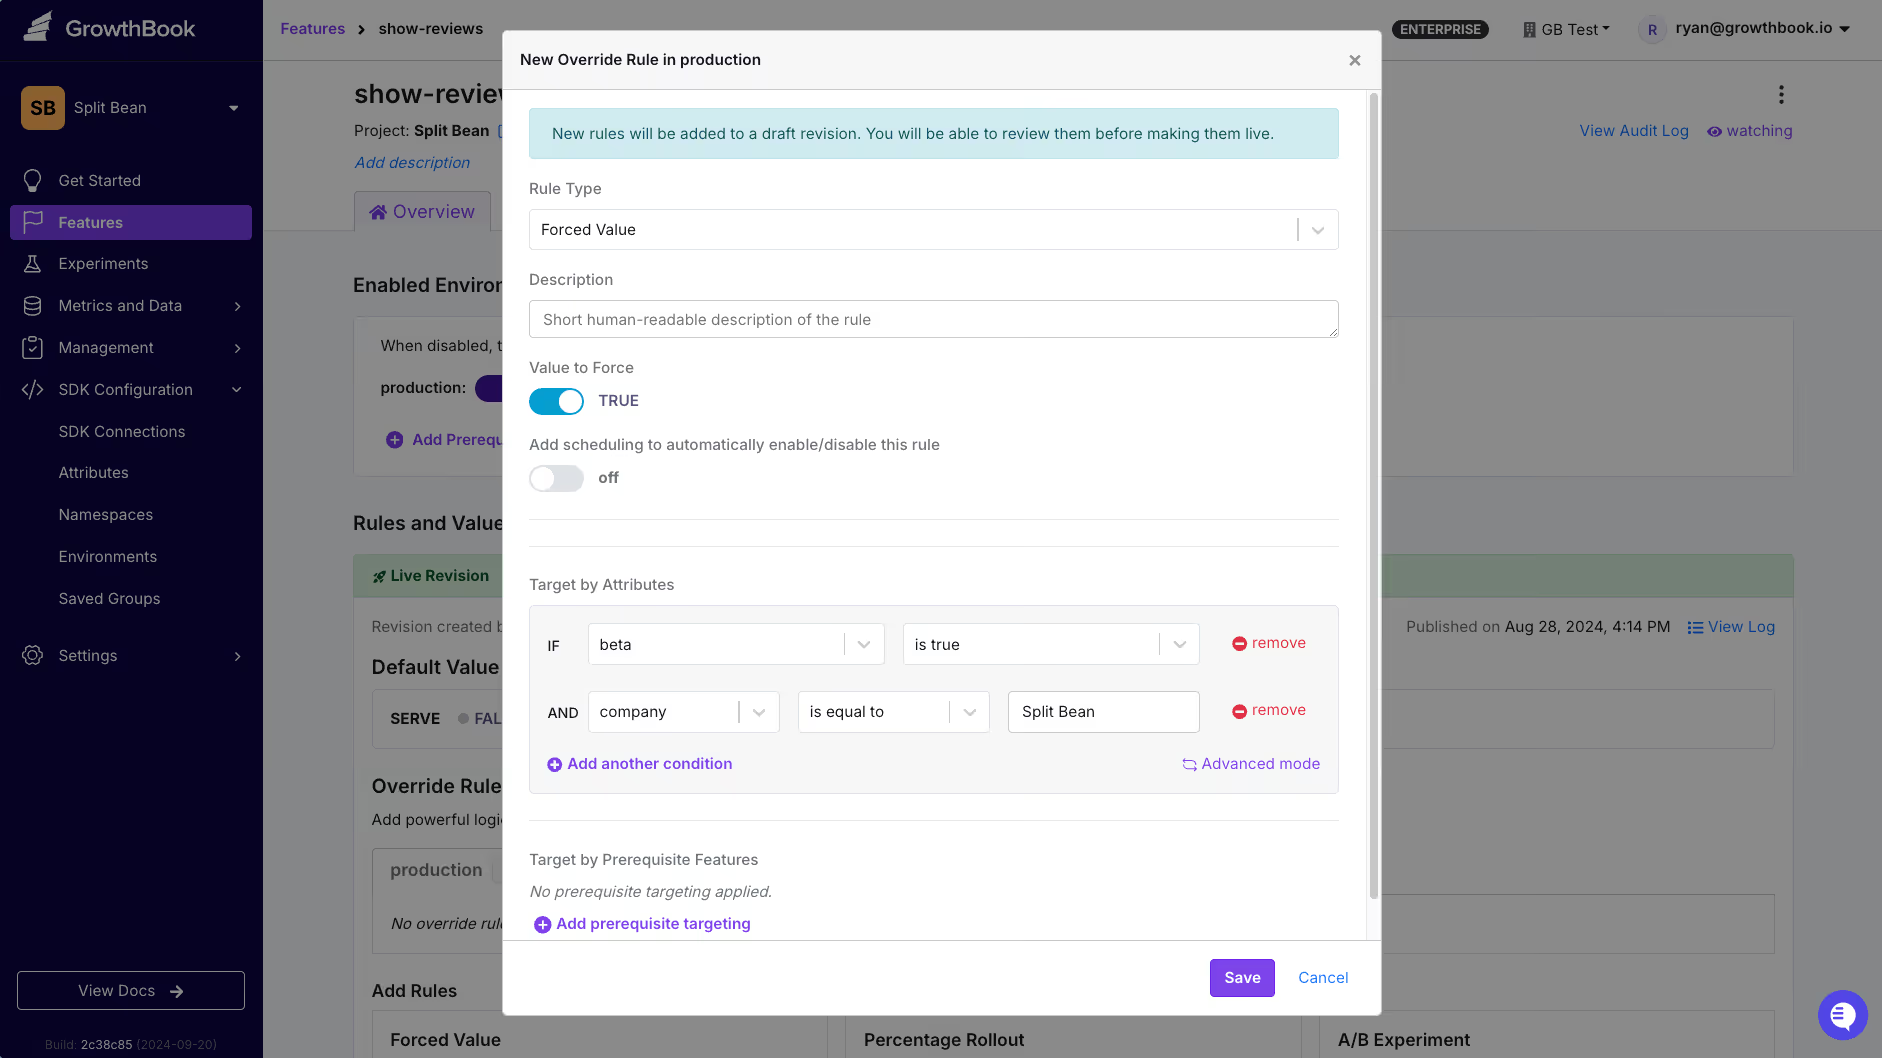
Save these changes and publish the updated feature flag. When internal beta users visit the site, they'll see the new review section and—importantly—see if anything has gone disastrously wrong 🙃
Once you're confident the feature works as expected, you can gradually expand access to a larger audience, mitigating risks along the way.
4. Canary releases

Even with thorough testing, releasing a major feature to all users at once can be risky. Engineers know this truth all too well. A canary release helps reduce this risk by rolling out the feature to a small percentage of users first.
Until the mid-1980s (!), miners used actual caged canaries to test for clear and odorless poisonous gases that would kill the small birds before the miners. This grim history gave rise to the saying "canary in the coal mine" and, by extension, a "canary release," which is likewise used as an early-detection method for bugs.
Example: percentage rollout
Split Bean is launching a new multi-page checkout flow, designed to reduce cart abandonment. The new flow passed A/B tests and beta testing, but there’s still a chance things could go sideways. With a canary release, Split Bean enables the new checkout for just 5% of users to monitor for any unexpected issues.
- Create a Feature Flag: Set up a
new-checkout-flowflag in GrowthBook. - Add a Rollout Rule: Assign the new flow to 5% of users. As you gain confidence in the feature’s stability, gradually increase the rollout.
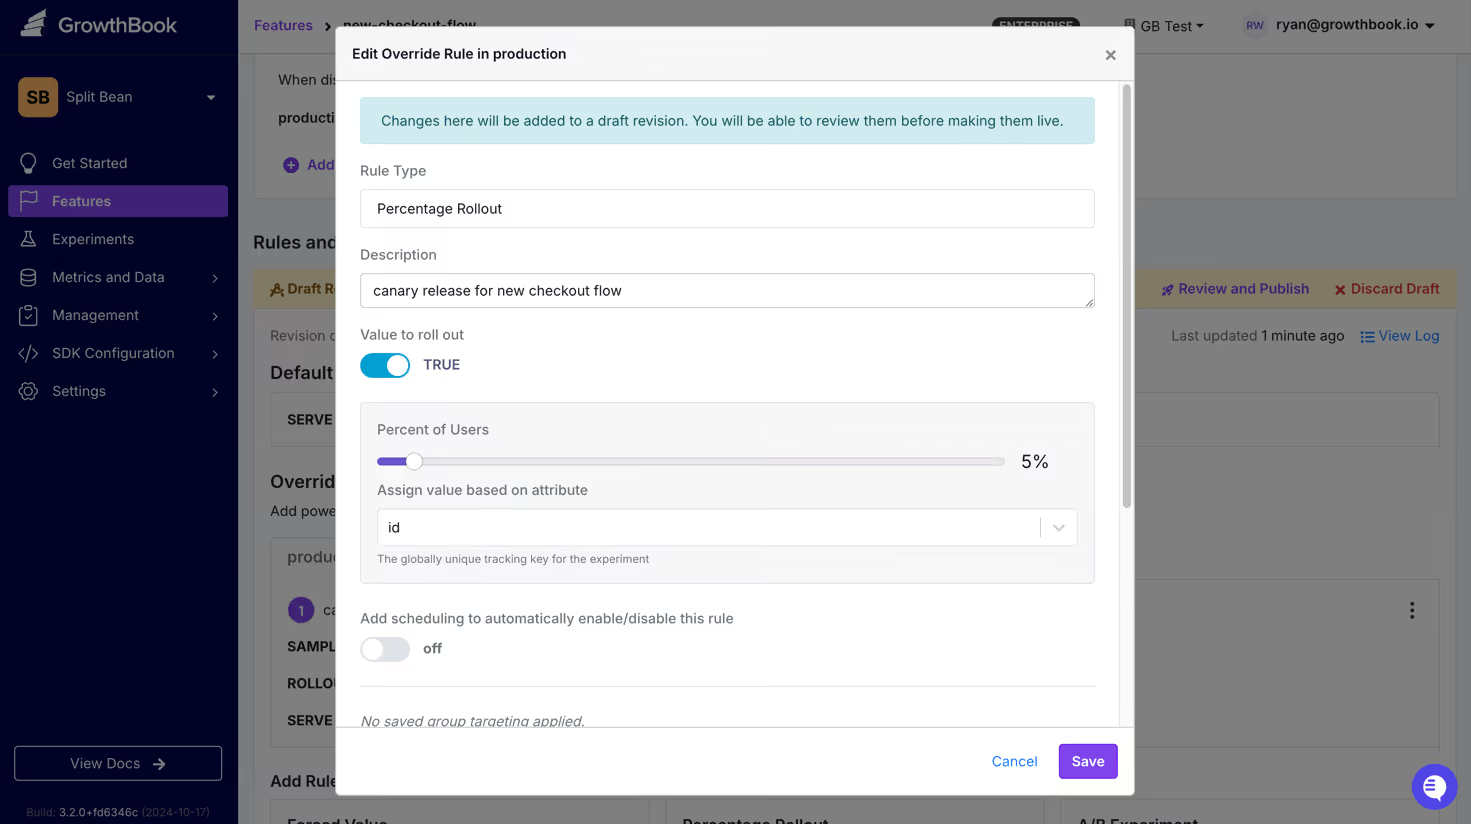
When the rollout hits 100%, remove the flag and make the change permanent in the codebase. This approach lets you catch potential issues early, making for smoother, low-stress releases.
5. Operational flags
Finally, feature flags aren’t just for new features—they also give you powerful operational control over your app. One key use case is the kill switch ☠️ , which allows you to quickly disable problematic features in case of emergencies.
Example: payment integration kill switch
Split Bean’s CEO just made a deal with a new payment processor to save a few points per transaction. While the engineering team seems to have integrated it without issue, what happens if it fails during a high-volume period? That’s a lot of beans to lose.
With GrowthBook, every feature flag comes with a built-in kill switch. If something goes wrong, you can toggle the new-payment-processor flag off instantly to prevent further issues and revenue loss.
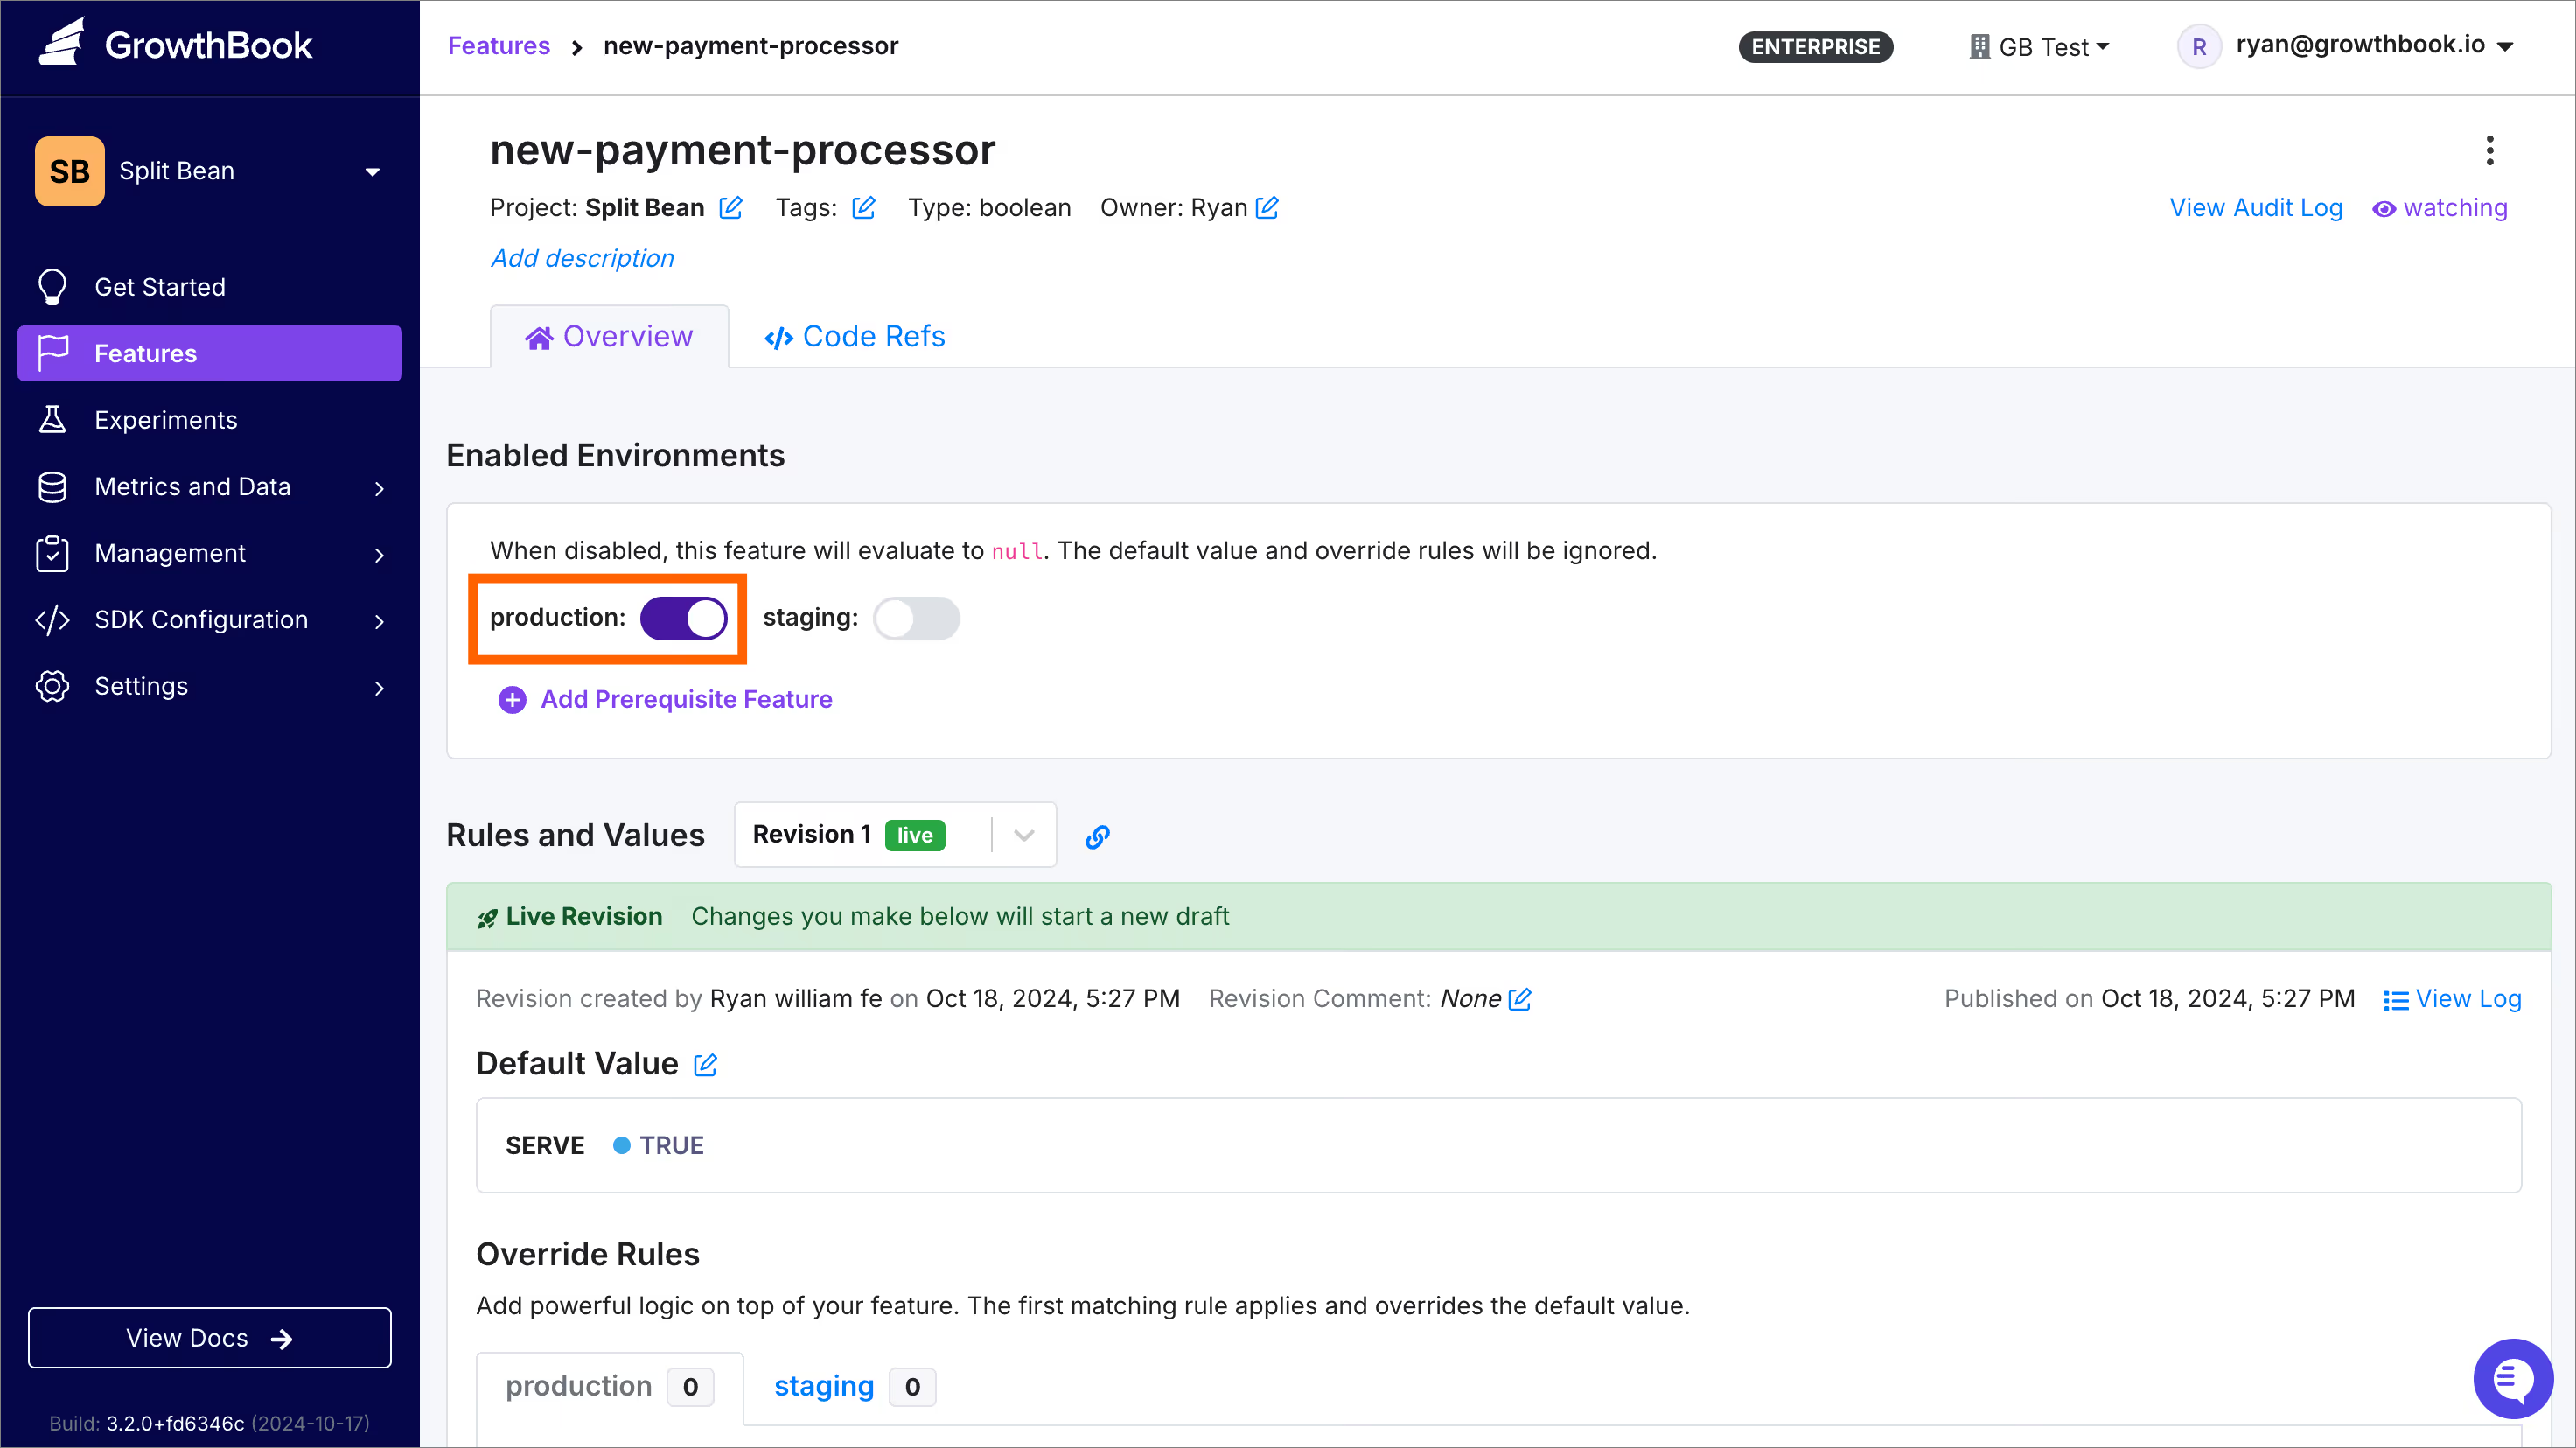
In addition to kill switches, operational feature flags can be used for things like maintenance mode, where you temporarily disable parts of your app during an update. Just like Apple’s “Be right back” message during product launches, Split Bean can set a flag to pause sales while it announces new blends.

Making it possible for anyone to categorically change your app at the literal flick of a switch might seem risky in itself. GrowthBook provides the ability to add a confirmation pop-up to the switch to prevent accidental clicks. Go to Settings → General → Feature Settings → Require confirmation when changing an environment kill switch.
Conclusion: ship faster and smarter with feature flags
Feature flags offer more than just an on/off switch—they provide a flexible and powerful way to manage your app’s features and optimize user experiences. From A/B testing to canary releases and operational controls, feature flags in GrowthBook let you ship faster, reduce risk, and stay ahead of the competition.
Get Started Today: Create a free account, and see how easy it can be to build and deploy smarter!
Related: For a full framework, see our guide to release management best practices.

Convincing leadership to adopt A/B testing
Many of today's leading companies rely on A/B testing to measure the impact of product changes and remove guesswork from decision-making, allowing teams to make data-driven decisions rather than relying on intuition. Changing from an intuition-based process to an experimentation-driven one can be difficult, especially without buy-in from leadership. Getting buy-in from leadership is the single largest determinant for a successful experimentation program. This post outlines a strategic approach to gain buy-in from leadership, starting small and demonstrating measurable impact.
Highlight the value of A/B testing
The first step in convincing leadership is to present A/B testing as a tool for continuous improvement rather than an extra burden. Here are a few key points to emphasize:
- Data-Driven Decision Making: A/B testing replaces guesswork with data, allowing the company to make informed decisions based on user behavior and preferences. It’s an objective way to measure the impact of product changes.
- Reduced Risk of Launching Ineffective Features: By testing new features on a small subset of users before rolling them out widely, you minimize the risk of launching something that doesn't resonate with users or hurts performance.
- Impact on Metrics that Matter: Connect A/B testing to the company’s core KPIs (e.g., conversion rates, user retention, revenue growth). Demonstrate how it can directly impact the metrics that leadership cares about most.
Start small and show results
It’s often easier to get buy-in for something new when the initial investment is low. Start by running a few small-scale tests that are low-risk but have the potential for noticeable results. This strategy builds momentum and shows leadership the tangible benefits of A/B testing without requiring a major overhaul of the existing product development process.
Example: improving conversions with a website change
In one of our recent experiments, we tested a reordering of elements on our Getting Started page. The goal was to see if changing the layout could improve engagement, specifically how many new accounts were created by an organization after sign-up.
We ran the A/B test for three weeks, comparing the old design to the new one. The result? A 25% increase in the number of accounts that created an organization. Even more exciting, those accounts were 200% more likely to convert into paying customers than those with the older layout. This experiment was part of a series of iterative tests, demonstrating how small changes, backed by data, can have a large impact on core business metrics.
Steps
Step 1: identify a feature or project
Select a feature or project where the impact is uncertain and where developers are open to testing. Ideally, this is a feature that has not yet started or there is some concern about its impact. Choose a feature that’s tied to an important KPI for the business and gets enough traffic to generate results within 2 weeks.
Step 2: integrate testing into the product development workflow
Float the idea of running an A/B test for this project and have the test integrated into the launch plan. Pick the goal metrics and estimate the experiment duration, given the power needed to detect the expected effect. Let the team know that should the experiment fail, you will likely roll back the feature and try again (or move on). The goal is to demonstrate how seamlessly A/B testing can be integrated into the product development workflow, enabling smarter decisions without slowing the process.
Step 3: share results
Once a few small tests have been completed and shipping decisions have been made based on the results, it's time to communicate this to leadership. Experiment review meetings can help demonstrate that the results, while sometimes counter-intuitive, are valuable. Be sure to communicate:
- The hypothesis behind the test and the variants (with screenshots if applicable).
- The results, including the impact on key metrics.
- What decisions did you make based on this data? (shipped, rolled back, reworked)
- How can these insights inform future product decisions?
Make sure to highlight wins and losses - use the language of 'saves' for features that have a negative impact on metrics. These projects were prioritized, and you might not have realized their negative effects without testing.
Address leadership concerns
Leadership may have concerns about adopting A/B testing. Here are some concerns and how to address them:
- Time and resources: Leaders might worry that A/B testing will slow down product development or require too many resources. Reassure them that, when implemented strategically, A/B testing can streamline decision-making and lead to more effective use of resources by focusing on rapid iterations and MVPs to test that either verify or contradict a hypothesis.
- Concern with iterative development: Some leaders may believe that truly innovative products are not created with iterative processes like experimentation-driven development. Counter this by emphasizing that A/B testing allows the company to take calculated risks and learn quickly before investing heavily. There are no projects that cannot be tested in some ways to measure interest, even if they are wildly innovative.
- Cultural resistance: Sometimes, leadership may resist shifting from intuition-driven decisions to a data-driven culture. In these situations, positioning A/B testing as a tool to enhance rather than replace intuition can help. A/B testing provides a feedback loop that sharpens decision-making.
Build a culture of experimentation
Once you’ve successfully demonstrated the value of A/B testing on a small scale, the next step is to foster a culture of experimentation. Encourage leadership to see A/B testing as an ongoing process that fuels innovation and continuous improvement. Over time, teams will become more comfortable using A/B testing to validate decisions and optimize the user experience.
- Make testing routine: Incorporate A/B testing into every product development cycle as a natural part of the process.
- Encourage cross-department collaboration: A/B testing should be embraced by product teams and marketing, design, and engineering. When different departments are aligned around experimentation, the results are more impactful.
- Celebrate wins and learn from losses: Recognize successful tests and the insights gained from failed ones. A/B testing is about learning, not just about winning.
Fanatics built a culture of experimentation where executive humility drives data-first decision-making at every level. With nearly 100 experiments a month and a structured wiki that turns test results into institutional knowledge, experimentation now consistently delivers ~8% of annual growth at their $3B business.
Quantifying the ROI of A/B testing
Leadership often wants a clear financial justification for investing in an experimentation program. Unfortunately, the ROI for experimentation is a complicated number. A/B testing can be used for optimizations or more straightforward A/B tests where the impact of the results is very clear (and definitely communicate those). However, it is hard to determine the ROI of spending 3 months building something that, through an iterative testing program, is more successful than if you had built based on intuition. It can be hard to quantify how much time was saved by not building a feature as well. Also, even failed tests provide value by preventing the launch of potentially harmful features and allowing your team to learn what your users like. Remind leadership that every test provides insights that can drive smarter decisions in the future. Experimentation programs done well maximize learnings, the effects of which can be hard to put a number on.
Conclusion
Convincing leadership to adopt A/B testing requires a thoughtful, measured approach. By starting small, demonstrating clear impact, and integrating testing into the product development, you can build trust in the methodology. Over time, A/B testing can become an essential part of decision-making, leading to better products and stronger results.
If you’re looking to introduce A/B testing into your company, remember: start simple, stay aligned with business goals, and showcase results, no matter how small. In doing so, you’ll not only convince leadership but also set the foundation for a culture of data-driven innovation.
GrowthBook version 3.2
We’re proud to announce the release of GrowthBook 3.2. This release includes many requested improvements to Saved Groups, experiment alerting, metrics, and the visual editor, among others.
Check out the full details of this release below—and stay tuned for some major features we’re working on that will be coming very soon!
Big saved groups
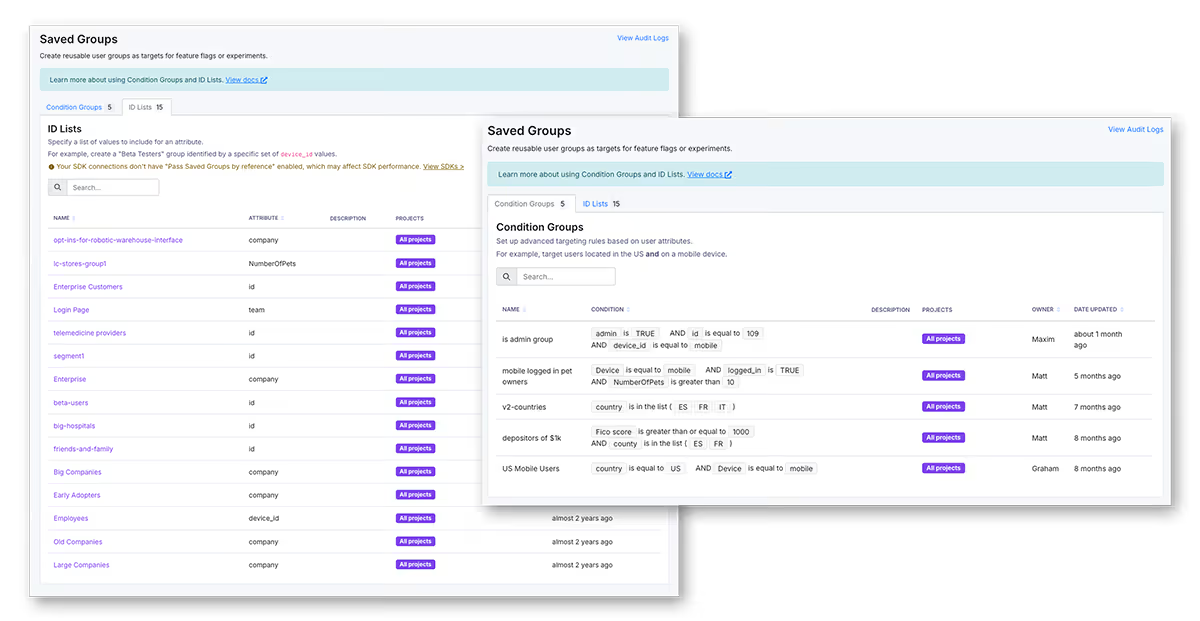
Saved Groups in GrowthBook are a great way to target users by ID or email, but the UI and SDK implementations made it difficult to scale beyond a few dozen values. In this release, we’ve made several changes to better support this use case.
- There’s a brand new UI for managing Saved Groups with CSV upload support, searching and browsing IDs with pagination, and other quality of life improvements.
- A new setting for SDK Connections lets you pass Saved Group values by reference. This optimization can drastically reduce the payload size sent to SDKs when you frequently reuse groups across multiple features or experiments. Passing values by reference is currently supported only in JavaScript and React SDKs, but the rest will be supported soon.
- You can now restrict Saved Groups to specific projects. This is especially useful for larger organizations with many teams that want to better organize their Saved Groups.
Experiment significance alerts

We completed a big overhaul of our webhook notification system, which will allow us to rapidly add support for new events and filtering capabilities going forward. First up is one of our most requested features—the ability to alert when a goal metric in an experiment reaches significance. You can now configure alerts for this event and send them to Slack, Discord, or a custom endpoint.
Keep an eye out for new events as we add them, and let us know what you’d most like to see next! We’re super excited about all of the new use cases this will unlock.
Metric insights
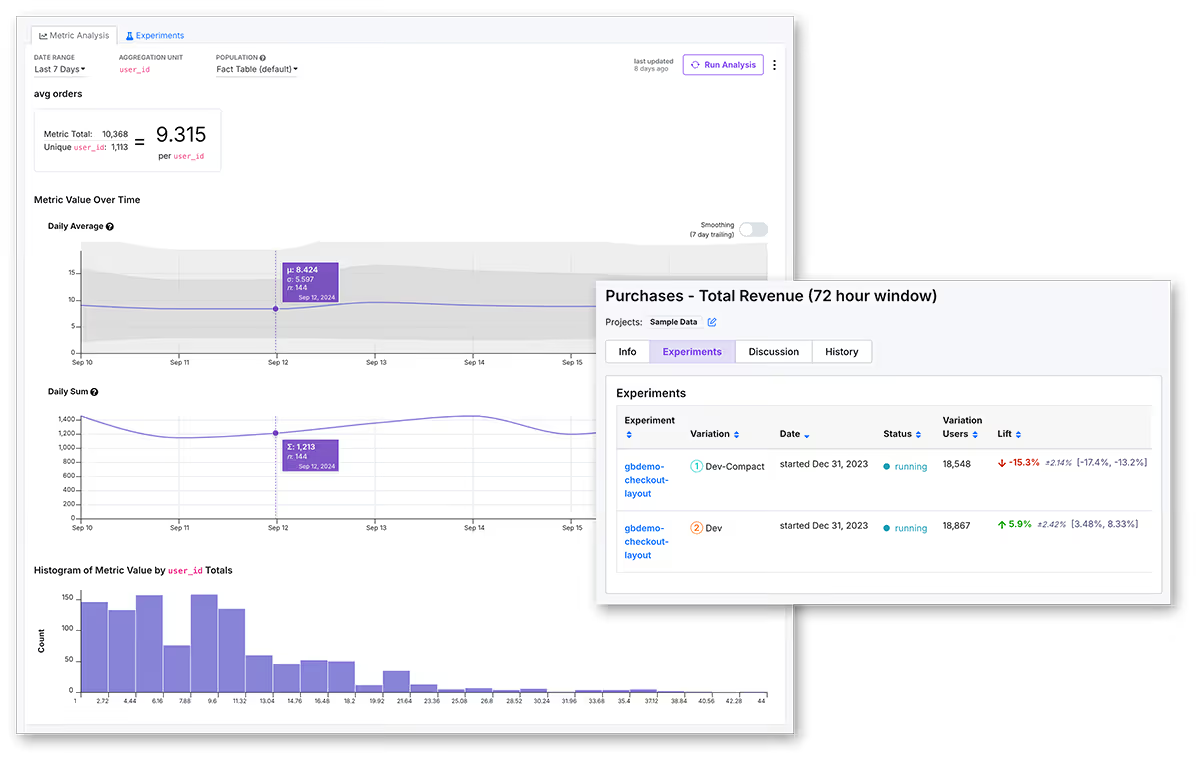
We made two big changes to metrics in this release. First, we added graphs to fact metrics. After creating a fact metric, you can now run an analysis that will look at recent data and display several helpful graphs depending on the metric type. For mean metrics, for example, we show an overall count, daily average, daily sum, and a histogram of metric values. This can help you verify that the metric is set up correctly and reporting the values you expect before adding it to an experiment.
Secondly, we revamped the Recent Experiments list on metric pages. You can now sort by different columns, and, most importantly, there is a new column for Lift, which shows how much the metric changed in each experiment. This lets you answer a critical question—which experiments had the biggest impact on my metric?
Visual editor improvements
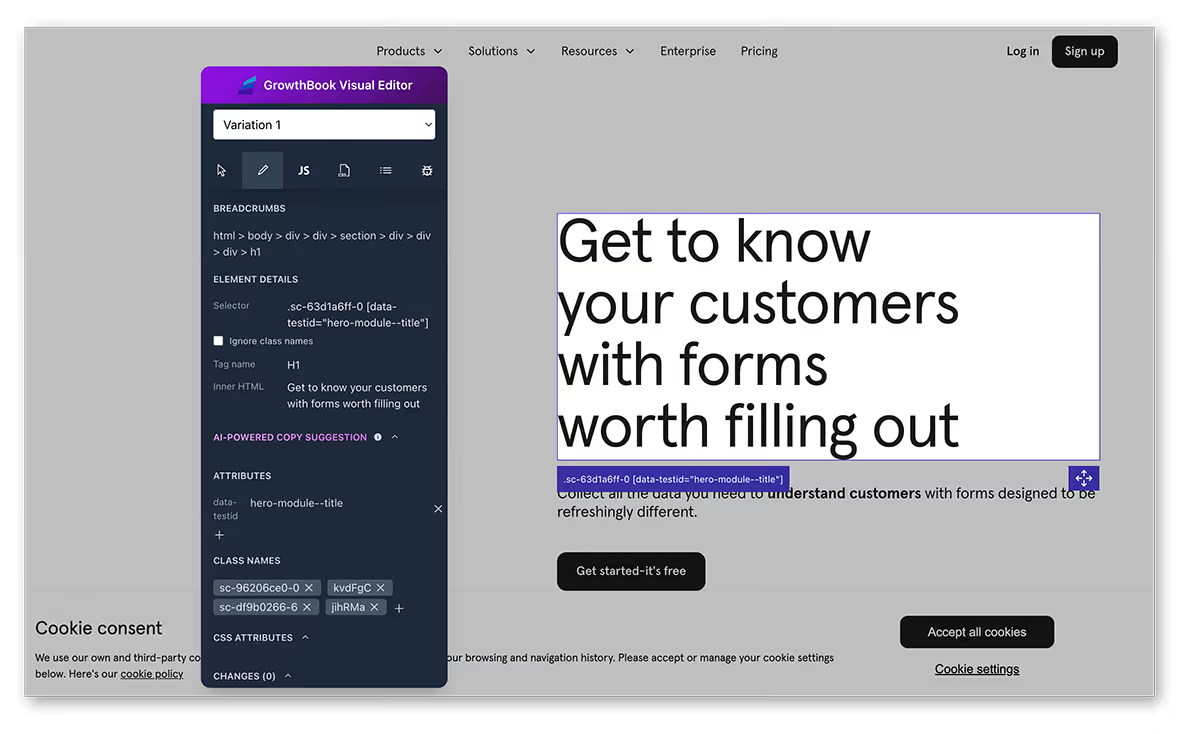
We’ve been making a number of UX improvements to the visual editor over the past month to make it easier to use and less error-prone. The most noticeable change is the ability to edit element text directly on the page. Just double-click on any text element and start typing!
We have a lot more exciting changes planned here, so stay tuned!
Vercel integration

GrowthBook has always had first-class support for Vercel and the Next.js ecosystem (it’s what GrowthBook itself is built with), and we’re proud to now support even more use cases on this platform.
You can now configure any SDK Connection to sync data to Vercel Edge Config. Any time a feature flag or experiment changes in GrowthBook, we automatically update Edge Config with the latest value within seconds. This is especially powerful for server-side rendering, where latency is critical—reading from Edge Config is much faster than making a network request to GrowthBook’s servers.
We’ve also added a guide to our docs detailing how to integrate GrowthBook with the @vercel/flags library and the Vercel Toolbar for an even more seamless experience.
Azure SCIM support
This latest release supports SCIM user provisioning for enterprises using Azure AD (also known as Microsoft Entra). You can now fully configure your users and teams within Azure, and they will be synced to GrowthBook. SSO and SCIM require a GrowthBook Enterprise license.

GrowthBook hits 6,000 stars on GitHub: what's driving our growth?
We’re thrilled to announce that GrowthBook has reached 6,000 stars on GitHub! This milestone means so much to us, and we couldn’t have done it without the amazing support from developers, data-driven teams, our community, and experimenters like you. To celebrate, we wanted to highlight a few of our favorite features that have helped us grow and made experimentation easier for everyone.
Sticky bucketing: keeping experiments consistent
Imagine running an experiment in which users switch between devices and their test experience remains consistent. That’s what Sticky Bucketing does! Whether they hop from mobile to desktop or if the test is restarted, users stay in the same variant. This consistency means you get cleaner data and more accurate results—no noise, just insights you can trust.
Fact table optimization: smarter queries, lower costs
Running a bunch of experiments at once? No problem. With Fact Table Optimization, your queries get smarter and faster, especially if you’re using data warehouses like BigQuery or Snowflake. This feature cuts down the time (and cost!) of running queries, so you can focus on scaling your experiments and driving growth without stressing about infrastructure.
Edge SDKs: fast experiments, no performance trade-offs
We know speed is crucial, and our Edge SDKs deliver exactly that. By running experiments at the edge—on platforms like Cloudflare and Fastly—you’ll eliminate slow page loads and flickering. Plus, our Edge SDKs make it easy to run no-code visual experiments, ensuring your users have a seamless experience while you get results faster.
Quantile metrics: get granular insights into performance
Averages can only tell you so much. With Quantile Metrics, you get a more detailed view of how different user groups experience your experiments. Whether you’re improving load times or optimizing checkout, this feature helps you zero in on outliers and fine-tune performance for every segment.
Thanks for helping us grow
This milestone is just the beginning, and we couldn’t be more grateful for your support and contributions. Every experiment, every bit of feedback, and every GitHub star has pushed us to build something better. If you haven’t already, check out GrowthBook on GitHub—we’d love to see what you experiment with next!
Thanks for supporting us!

9 common experimentation program mistakes to avoid
Controlled experiments, or A/B tests, are the gold standard for determining the impact of new product releases. Top tech companies know this, running countless tests to squeeze out the truth about user behavior. But here’s the rub: many experimentation programs don’t reach that level of maturity. Many fail to make their systems repeatable, scalable, and above all, impactful.
While developing the GrowthBook platform, we spoke to hundreds of experimentation teams and experts. Here are nine of the most common ways we’ve seen experimentation programs falter, along with ways to avoid them.
1. Low experiment frequency
The humbling truth about A/B testing? Your chances of winning are usually under 30% - and the odds of large wins are even lower. Perversely, as you optimize your product, these winning percentages decrease. If you’re only testing a few tests a quarter, the chances of a large winning experiment in a year are not good. As a result, companies may lose faith in experimentation due to a lack of significant wins.
Successful companies embrace the low odds by upping their testing frequency. The secret is making each experiment as low-cost and low-effort as possible. Lowering the effort means that you can try many more hypotheses without over-investing in ideas that didn't work. Try to identify the smallest change that will signal whether the idea will affect the metrics you care about. Automate where you can, and use tools like GrowthBook (shameless plug!) to streamline the process and scale the number of tests you can run. Additionally, build trust in the value of frequent testing by demonstrating how even small insights compound over time into meaningful change.
2. Biases and myopia
Assumptions about product functionality and user behavior often go unchallenged within organizations. These biases, whether personal or communal, can severely limit the scope of experimentation. At my last company, we had a paywall that was assumed to be optimized because it had been tested years ago. It was never revisited until a bug from an unrelated A/B test led to an unexpected spike in revenue. This surprising result prompted a complete reassessment of the paywall, ultimately leading to one of our most impactful experiments.
This scenario illustrates a common pitfall: Organizations often believe they know what users want and are resistant to testing what they assume is correct—a phenomenon known as the Semmelweis Reflex, in which new knowledge is rejected because it contradicts entrenched norms.
A big part of running a successful experimentation program is removing bias about what ideas will work and which will not. Without considering all ideas, the potential success is limited. This myopia can also happen when growth teams are not open to new ideas, or cannot sustain their rate of fresh ideas. In these cases, they can start testing the same kinds of ideas over and over. Without fresh ideas, it can be extremely hard to achieve significant results, and without significant results, it can be hard to justify continuing to experiment.
The key to resolving these issues is to recognize that you or your team may have blind spots. Kick any assumptions to the curb. Test everything—even the things you think are “perfect.” Talk to users, customer support, and even browse competitors for fresh ideas. Remember: success rates are low because we’re not as smart as we think we are.
3. High cost
Enterprise A/B testing platforms can be expensive. Most commercial tools charge based on tracked users or events, meaning the more you test, the more you pay. Since success rates are typically low, frequent testing is critical for meaningful results. However, without clear wins, it becomes difficult to justify the ROI of an expensive platform, and experimentation programs can end up on the chopping block.
The goal should be to drive the cost per experiment as close to zero as possible. One way to save money is to build your own platform. While this reduces the long-term cost of each experiment, the upfront investment is steep. Building a system in-house typically requires teams of 5 to 20 people and can take anywhere from 2 to 4 years. This makes sense for large enterprises, but for smaller companies, it's hard to justify the time and resources.
An alternative is to use an open-source platform that integrates with your existing data warehouse. GrowthBook does exactly that. It delivers enterprise-level testing capabilities without requiring an entire infrastructure to be built from scratch. By lowering costs, you can sustain frequent testing and build trust with leadership by showing how your experimentation delivers valuable insights without breaking the bank.
4. Effort
Nothing kills the momentum of an experimentation program like a labor-intensive setup. I’ve seen teams where it took weeks just to implement one test. And after the test finally ran, they had to manually analyze the results and create a report—a painstaking, repetitive process that limited them to just a few tests per month. Even worse, this created significant opportunity costs for the employees involved, who could have been working on more impactful projects.
Successful programs minimize the effort required to run A/B tests by streamlining and automating as much as possible. Setting up, running, and analyzing experiments should be as simple as possible. Experiment reporting must be self-service, and creating a test should require minimal setup - ideally just a few steps beyond writing a small amount of code. The easier it is to get a test off the ground, the more agile and efficient the experimentation program becomes.
This is where good communication plays a pivotal role. Clear, consistent communication between product, engineering, and data teams is essential for minimizing effort. Everyone involved needs to know what tools and processes are available to them. When teams collaborate effectively, they can anticipate potential roadblocks, avoid duplicated effort, and move faster. Without strong communication, you risk bottlenecks, misaligned priorities, and confusion over responsibilities—all of which slow down the testing process. In short, the easier you make the process—and the better your teams communicate—the more agile your experimentation program becomes.
5. Bad statistics
There are about a million ways to screw up interpreting data that can sink an experimentation program. The most common ones are: peeking (deciding on an experiment before it's completed), multiple-comparison problems (adding so many metrics or slicing the data until it shows what you want to see), and just cherry-picking data (ignoring bad results). I’ve seen experiments where every metric is down, save one that is partially up, and be called a winner because the product manager wanted it to win and focused on that one metric. Experimentation results used inappropriately can be used to confirm biases rather than reflect reality.
The fix? Train your team to interpret statistics correctly. Your data team should be the center of excellence, ensuring experiments are designed well and results are objective - not just confirming someone's bias. Teach your teams about common problems in experimentation and related effects such as Semmelweis, Goodhart’s Law, and Twyman's Law.
One of the best ways to build trust in your experimentation program is to standardize how you communicate results. Tools like GrowthBook, offer templated readouts that give everyone a clear, consistent understanding of what really happened in the A/B test. These templates, set up by experts, embed best practices to ensure business stakeholders can follow along and keep everyone on the same page.
With consistent, templated results, your team gets reliable insights that reflect reality, even if the truth stings a little. This clarity fosters a culture where data—not gut feelings—drives decisions.
6. Cognitive dissonance
Design teams often conduct user research to uncover what their audience wants, typically through mock-ups and small-scale user testing. They watch users interact with the product and collect feedback. Everything looks great on paper, and the design seems airtight. But then they run an A/B test with thousands of real users, and—surprise!—the whole thing flops. Cue the head-scratching and murmurs about whether A/B testing is even worth it.
This situation often triggers a clash of egos between design and product teams. The designers swear by their user research, while product teams trust the cold, hard data from the A/B test. The trick here is to remove the "us vs. them" mentality and remember that both teams have the same goal: building the best possible product.
Treat A/B testing as a natural extension of the design process. It’s not about proving one team right or wrong—it's about refining the product based on real-world data. However, product teams must also be careful not to use data as a shield to justify dark patterns that degrade user trust, proving that sometimes the designers' intuition is correct.
By collaborating closely, design and product teams can run A/B tests to validate their ideas with a much larger audience, gathering more data to iterate and ultimately improve their designs. Testing doesn’t replace design; it enhances it by providing insights that make good designs even better.
7. Lack of trust
The last two issues with experimentation programs highlight the importance of trust in your data and deserve their own section. If the team misuses an experiment or draws incorrect conclusions from it, such as announcing spurious results, you start eroding trust in the program. Similarly, when you have a counterintuitive result, you will need a high degree of trust in the data and statistics to overcome internal bias. When trust is low, teams may revert to the norm of not experimenting.
The solution, obviously, is to keep trust in your program high. Make sure that your team runs A/A test to verify that the assignment and statistics are working as expected. Make sure you monitor the health of your experiments and the quality of your data as they are being run. If a result is challenged, be open to replicating the experiment to verify the results. Over time, your team can learn to place the right amount of trust in the results.
8. Lack of leadership buy-in
Leaders love to say they’re “data-driven,” but when their pet projects start getting tested and don’t pan out, they’re suddenly a lot less interested in data. When you start measuring, you get many failures and projects that don’t affect metrics. I’ve seen it time and time again: tests come back with no significant results, and leadership starts questioning why we’re testing at all.
It’s especially tough when they expect big, immediate wins, and the incremental nature of testing leaves them cold. When only ⅓ of all ideas win, this is a huge barrier, as oftentimes, leadership is focused on timely delivery.
Educate leadership on the long game of experimentation. Data-driven decision-making doesn’t mean instant success; it means learning from failures and iterating toward better solutions. Admitting you don’t always know what’s best can be tough—especially for highly paid leaders. It can bruise egos when a beloved idea flops in a test, but that’s part of the process. There's plenty written about the HiPPO problem (Highest Paid Person’s Opinion), where decisions are driven by rank rather than data.
The trick is to build trust in the experimentation process by showing that most ideas fail—and that’s okay—because you still benefit from the results. To demonstrate your program's value, focus on long-term impact and cumulative wins. Even small, incremental improvements lead to major gains over time. Insights from each test, even the "failures," inform smarter decisions, improving the organization's ability to predict what works. Highlight that if you had not tested an idea, it might have had a negative impact, so it should be seen as a win or “save.” As you learn what users like and don’t like, future development will include these patterns, making future projects more successful. This can be difficult to communicate, but it’s essential. Box’s e-commerce team makes this concrete by sending leadership a biweekly impact report and a monthly rollup to the CEO, so wins and losses both stay visible instead of only the wins that make the deck.
9. Poor process
Prioritization is hard. Most experimentation programs try to rank projects using systems like PIE or ICE, which assign numerical scores to factors like potential impact. The impact of a project is notoriously hard to predict, and it doesn’t become objective just because one puts a number on it. However, these systems often oversimplify the complexity of experimentation, making it harder to get tests running quickly. The effect of a bad process, as well-intended as they are, can reduce the experiment velocity and the chance of a successful program.
One solution to this is to give autonomy to teams closest to the product. Let them choose what experiments to run next, with loose prioritization from above. The more tests you run, the more likely you are to hit something big, so focus on velocity.
Conclusion
Experimentation can be a game-changer if you avoid these common pitfalls. Hopefully, this list will give you some points to consider that can improve your chances of having a successful experimentation program. If any of these failure modes sound familiar, try experimenting with some of the solutions mentioned for a month or two—you might be surprised by the results.
Start experimenting for free today!

How we built WebLens: creating an AI-powered hypothesis generator
Background
With the advent of generative AI, companies across all industries are leveraging these models to enhance productivity and improve product usability.
At GrowthBook, we have the unique opportunity to apply generative AI to the challenges of experimentation and A/B testing as an open-source company.
After careful consideration of the various applications of generative AI within the experimentation and A/B testing space, we decided to focus on creating an AI-powered hypothesis generator. This project not only allowed us to quickly prototype but also provided a rich roadmap for further innovation as we explore the potential of large language models (LLMs) in online controlled experiments.
An AI-powered hypothesis generator
Problem: New users often struggle to identify opportunities to optimize their websites, while experienced users may need fresh ideas for experiments.
Solution: Our AI-powered hypothesis generator analyzes websites and suggests actionable changes to achieve desired outcomes. It can generate DOM mutations in JSON format, making it easier to create new experiments in GrowthBook. For example, on an e-commerce site, the generator might recommend repositioning the checkout button or simplifying the navigation menu to boost conversion rates.
Overview
In our first iteration of the AI-powered hypothesis generator, we focused on a straightforward approach using existing technology. Below, we outline our process, the challenges we encountered, and how we plan to improve in future iterations.
Hypothesis generation steps
To accomplish the task of generating hypotheses for a given web page, there were a few discrete steps that the application would need to accomplish:
- Analyze the web page by scraping its contents.
- Prompt an LLM for hypotheses using the scraped data and additional context.
- If feasible, prompt the LLM to generate DOM mutations in a format compatible with our Visual Editor.
- Onboard the generated hypothesis and visual changes into GrowthBook.
Hypothesis generator tech stack
The hypothesis generator is built on a Next.js App supported by several services:
- Web scraping - Firecrawl
- Hypothesis generation via LLM - Google Gemini Pro
- Background async job system - Upstash QStash
- Backend data storage - Supabase (Postgres)
System architecture for WebLens
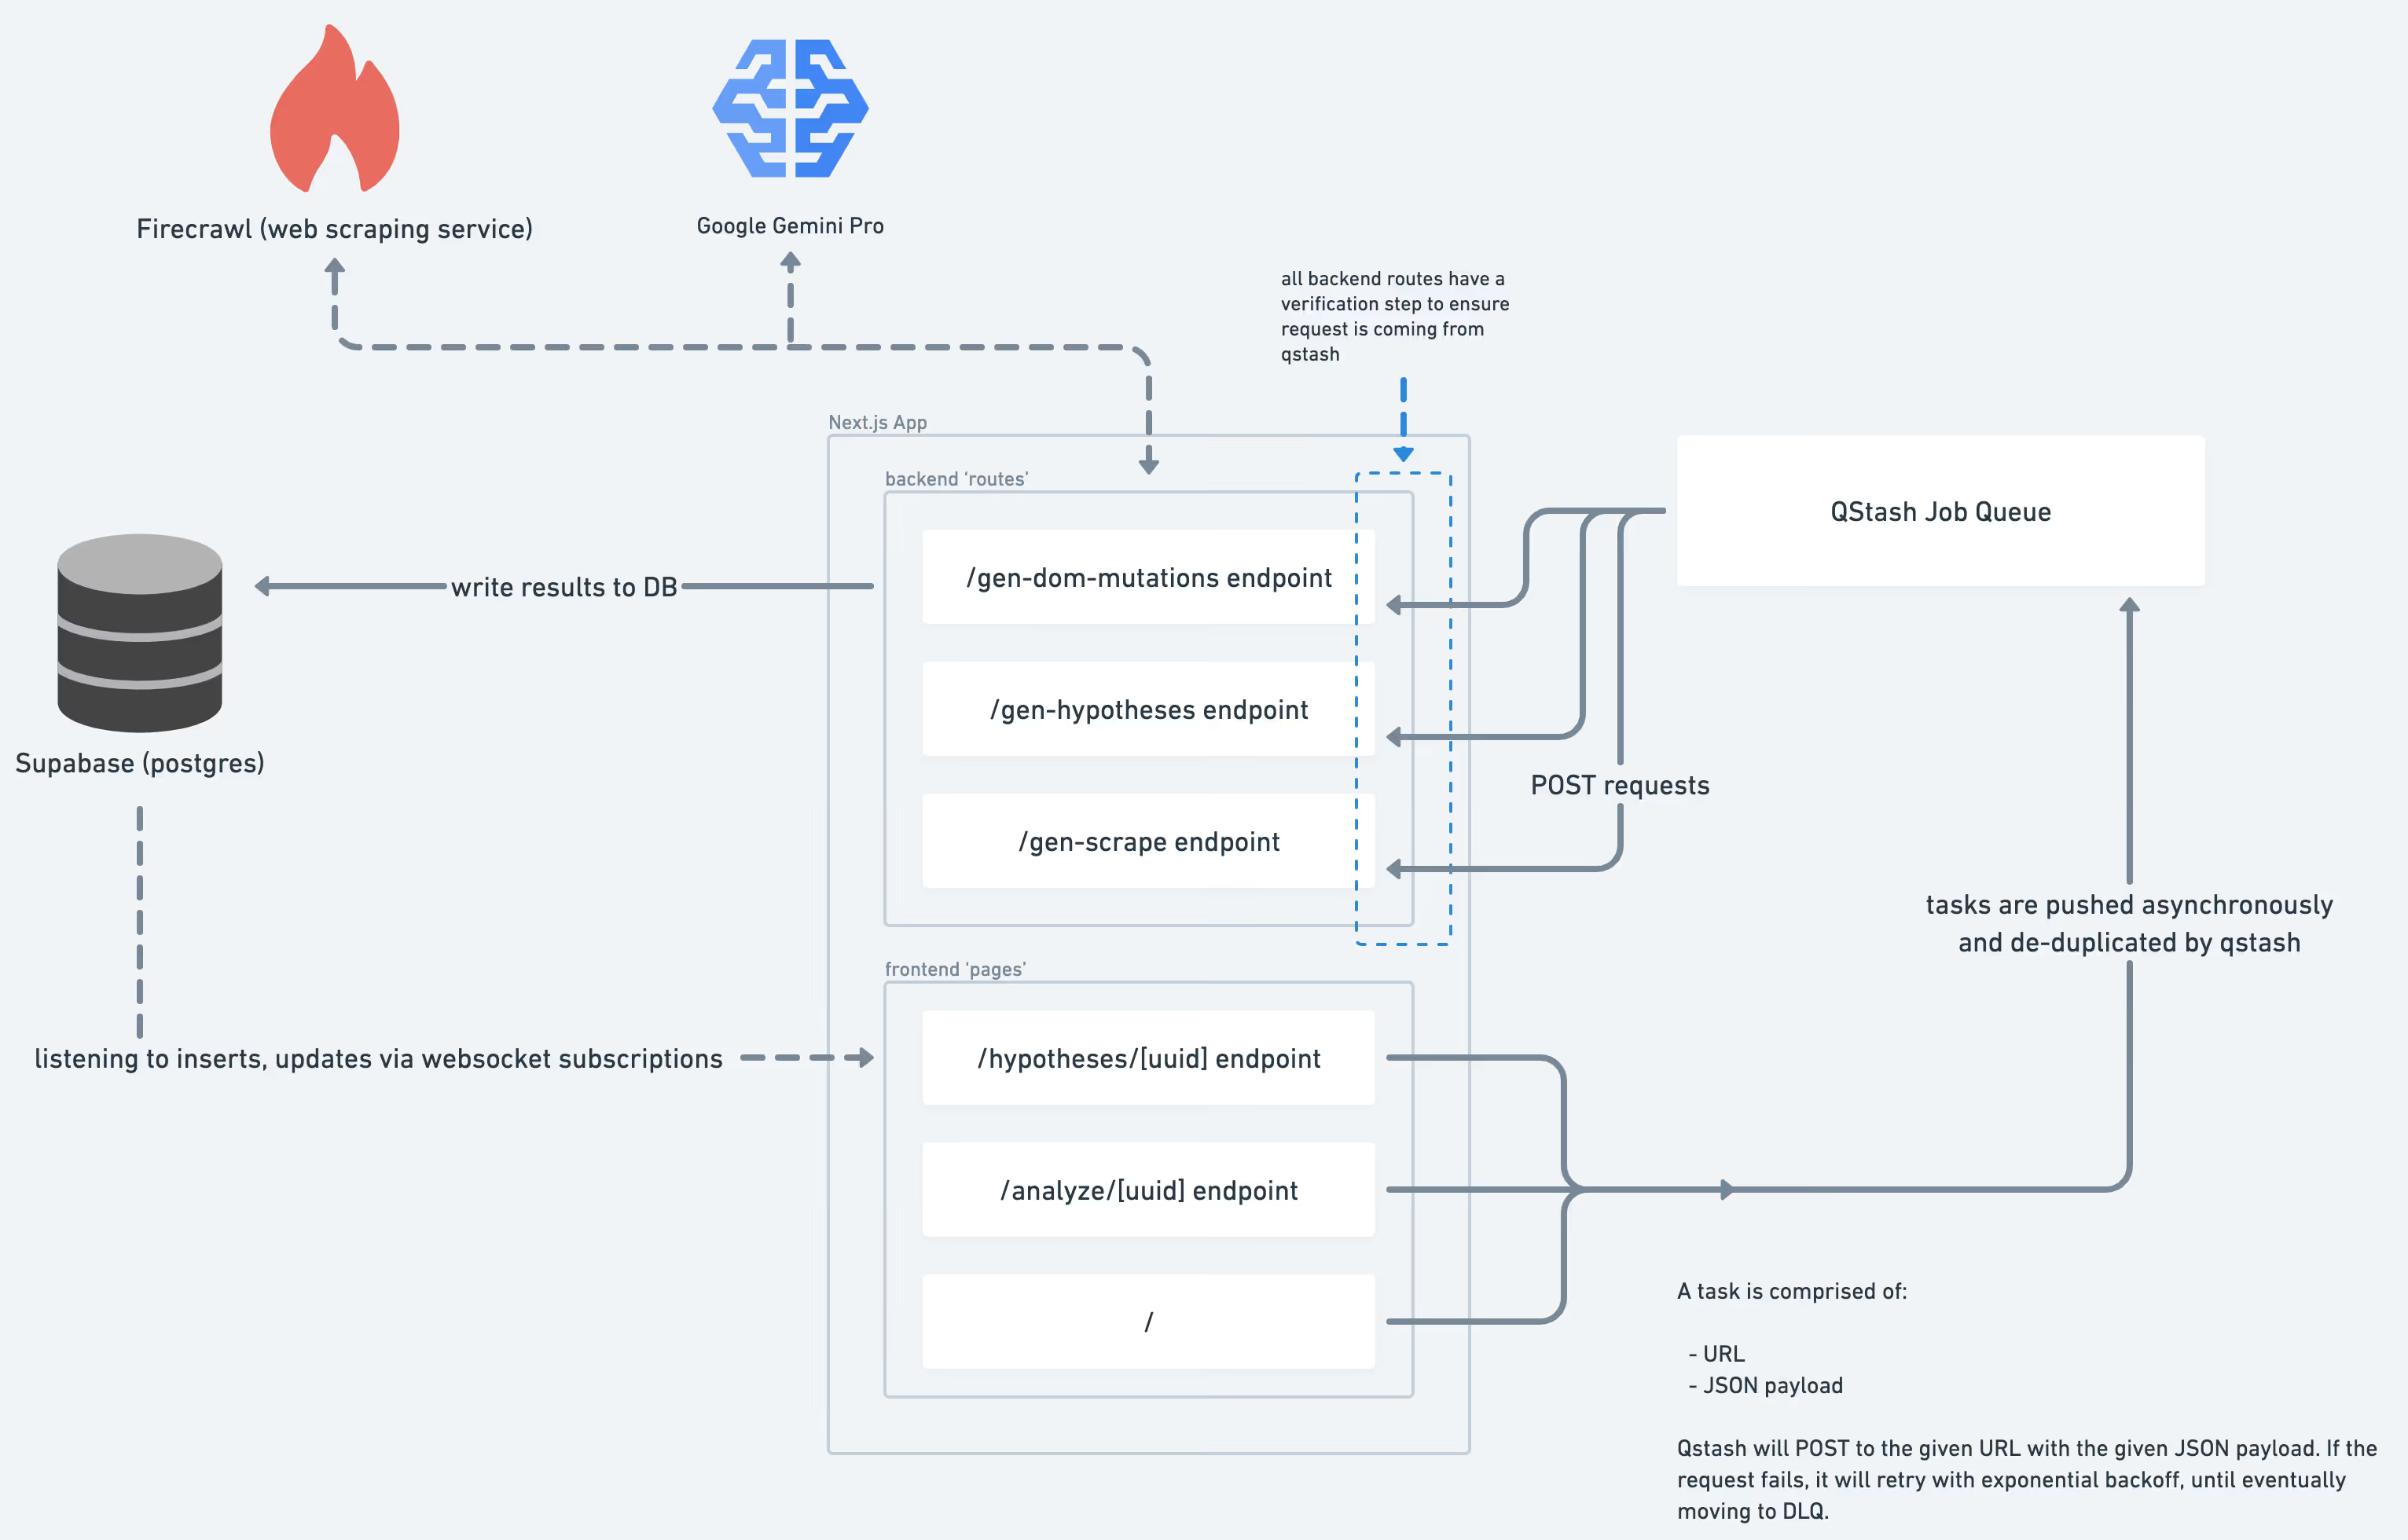
Scraping the page
To provide the LLM with the context it needs to form hypotheses, we needed a way to serialize a web page into data that it could understand, that is, text and images.
We were lucky to partner with another YC company, Firecrawl, for web scraping. Initially, we used Playwright, but switched to Firecrawl for its simpler API and reduced resource usage.
Firecrawl helps us:
- Provide a markdown-representation of the page’s contents
- Deliver the full, raw HTML of the page.
- Capture a screenshot of the page.
Prompting the LLM
Now for the fun part - we had to learn how to prompt the LLM to get accurate and novel results. A number of challenges arose in this area of the project.
In the beginning, we experimented with OpenAI GPT 4, Anthropic Claude 2.1, and Google Gemini Pro. We also made sure to acquaint ourselves with established prompting techniques and leveraged those that seemed to improve results.
In the end we decided to go with Google Gemini Pro chiefly for its large context window of 1 million tokens. The difference in quality of hypotheses was negligible but we thought OpenAI’s GPT-4 did slightly better.
Prompt engineering
We experimented with a variety of novel prompting techniques (as well as a bit of sorcery and positive thinking) to produce hypotheses of suitable quality. Here are a few of the techniques that we found useful:
- Multi-shot prompting: We combed through examples of successful A/B tests targeting different disciplines and segments of a website (ex: changing CTA UI and colors, altering headlines for impact, implementing widgets for user engagement, etc.) and reduced them to discrete test archetypes, which we fed into the prompt context. We also gave examples of failed A/B tests, as well as types of hypotheses that wouldn’t translate easily into good tests. This helped tighten up the variety of hypotheses produced, as well as subjectively improved the quality of hypotheses.
- Contextual priming: We extended our multi-shot context-building strategy to include priming. Specifically, we included phrases in our prompts such as ”You are a UX designer who is tasked with creating hypotheses for controlled online experiments…” or ”Try to focus on hypotheses that will increase user engagement.” We also found it helpful to break down the hypothesis-generation task into steps and provide details on how to carry them out.
- Ranking and validation: We asked the model to rank its output on various numerical and boolean scores (quality, ease of implementation, impact, whether or not there was an editable DOM element on the page, etc). This allowed us to rank and filter hypotheses, ensuring a good mixture of small, medium, and moon-shot ideas, as well as those that would translate well to a visual experiment.
Context window limits
Context window limits quickly became a challenge when trying to provide full web page scrape data to the LLM. This was a hard problem to compromise - there was no way around providing the full payload of scrape data. For example, it could be possible that crucial <style> tags were included near the bottom of the page. In general, there could be important details anywhere throughout the DOM that could affect the LLMs ability to formulate reliable hypotheses.
We came up with ideas on how to approach this problem in the long-term, but for now, we decided to take advantage of Google Gemini’s large context window to allow us to provide a nearly-full scrape of a webpage (with irrelevant markup removed) and still have enough token space left over for our prompt and the resultant hypotheses.
Generating DOM mutations
To take things one step further, we wanted to add the ability to use a generated hypothesis to prompt the LLM to generate DOM Mutations in a JSON format used by our Visual Editor. These mutations could then be used to render live previews in the browser.
We encountered some amazing results along with some pretty disastrous ones while experimenting with this. In the end, we had to narrow the focus of our prompt to modifying only the text copy of very specific elements on a page, so that the live previews were reliably good. We also implemented iterative prompting to ensure the generated mutations were usable, testing them out on a virtual DOM and suggesting fixes to the LLM when possible.
Future iterations could improve accuracy and power by refining this process.
Scalability
To ensure reliability and support increased traffic from platforms like Product Hunt and Hacker News, we used Upstash’s QStash for a message queue. This system provides features such as payload deduplication, exponential backoff retries, and a DLQ.
On the frontend, we used Supabase’s Realtime feature to notify clients immediately when steps are completed.
Challenges
Context window limits
One of the major challenges we faced was dealing with context window limits. Scraped HTML pages can range from 100k to 300k tokens, while most models' context windows are under 100k, with Google Gemini Pro being an exception at 1 million tokens. While large context windows simplify the developer experience by allowing us to create a single, comprehensive prompt for inference, they also come with the risk of the model focusing on irrelevant details.
Long context windows offer both advantages and disadvantages. On the plus side, they make it easier for developers by consolidating all necessary data into a single prompt. This is particularly useful for use cases like ours, where raw HTML doesn't align well with techniques such as Resource-Augmented Generation (RAG). However, larger prompts can lead to unexpected inferences or hallucinations by the model.
Despite these challenges, our tests showed that Gemini Pro consistently produced relevant and innovative hypotheses from the scraped data. Looking ahead, we plan to enhance this process by using machine learning to categorize web pages and group them into common UI components, such as "hero section" or "checkout CTA" for e-commerce sites.
By creating a taxonomy of web pages, we can use machine learning to extract essential details from each UI grouping, including screen captures and raw HTML. This approach reduces the amount of HTML from 300k+ tokens to less than 10k per grouping. Such optimization will enable faster, more accurate, and higher-quality inference across a broader range of models, even those with smaller context window limits.
Naming
We had a tough time coming up with a name for the tool - at one point, considering “Lenticular Labs.” We ultimately chose WebLens to emphasize the tool's ability to analyze websites through a focused lens. Plus, we secured the domain weblens.ai.
Conclusion
We hope you enjoyed reading this high-level overview of how we came to build the hypothesis generator at GrowthBook. Our current implementation is straightforward and uses readily available tools, yet it can generate novel insights for any web page on the internet. Give it a shot with your website of choice at https://weblens.ai and let us know your thoughts via our community Slack.
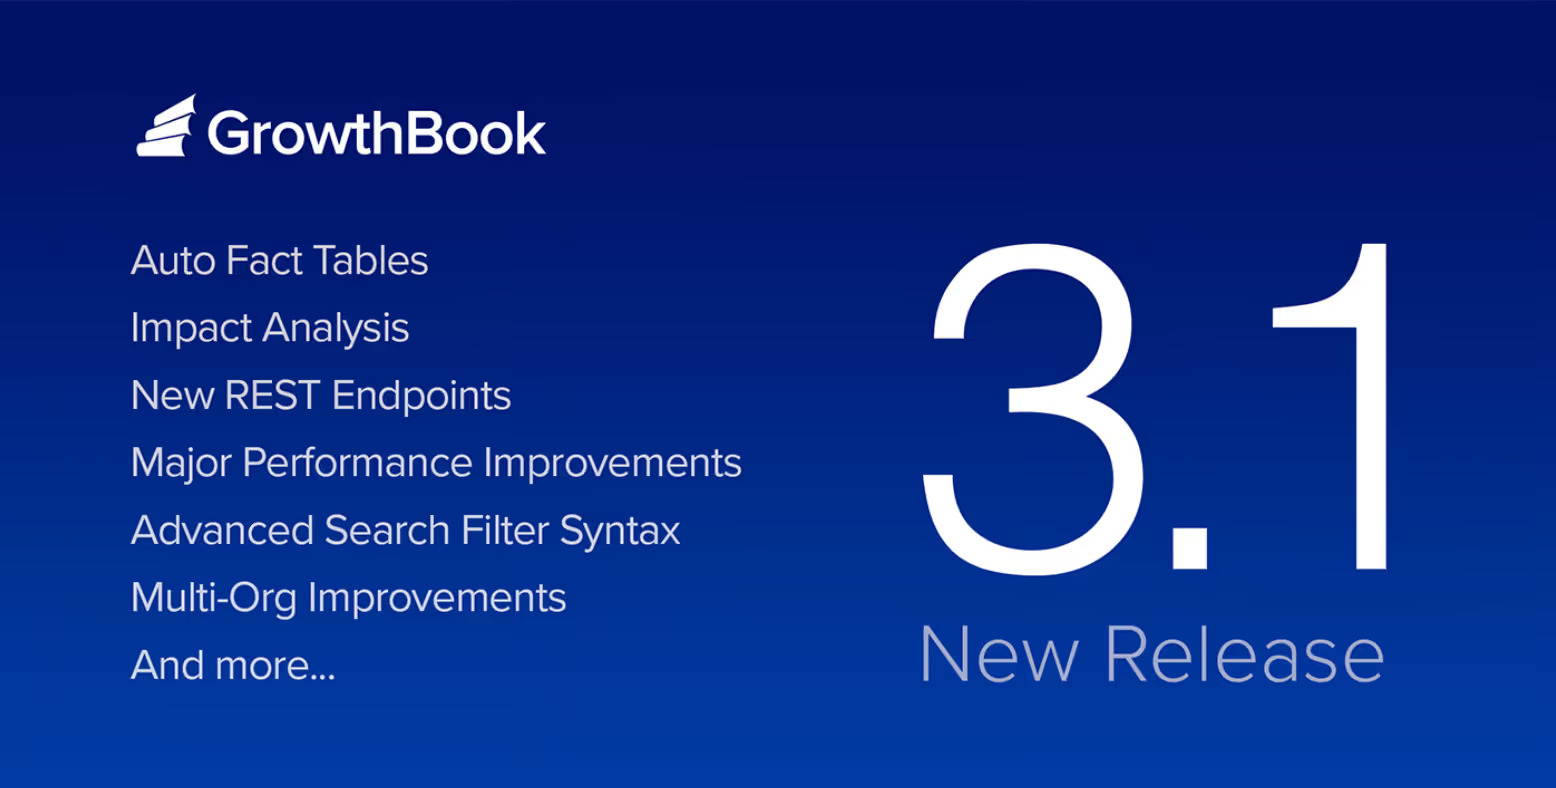
GrowthBook version 3.1
In version 3.1, we focused on three key areas: GrowthBook is now easier to use with Auto Fact Tables, more powerful with Impact Analysis, and faster thanks to deep optimizations made under the hood. In addition to these highlights, we've introduced several other exciting features and enhancements. Read on to discover everything new in this release.

Fact Tables are the new and preferred way to define metrics within GrowthBook, but creating them for all of your analytics events can be a tedious process. With Auto Fact Tables, GrowthBook can now auto-generate these for you with the click of a button! Once these fact tables are created, you can easily define a whole library of metrics on top of them without needing to write any SQL.
Auto Fact Tables are supported by any SQL data source in GrowthBook that is being populated by Google Analytics 4, Segment, Rudderstack, or Amplitude event trackers.
Learn more about Auto Fact Tables.
Impact analysis
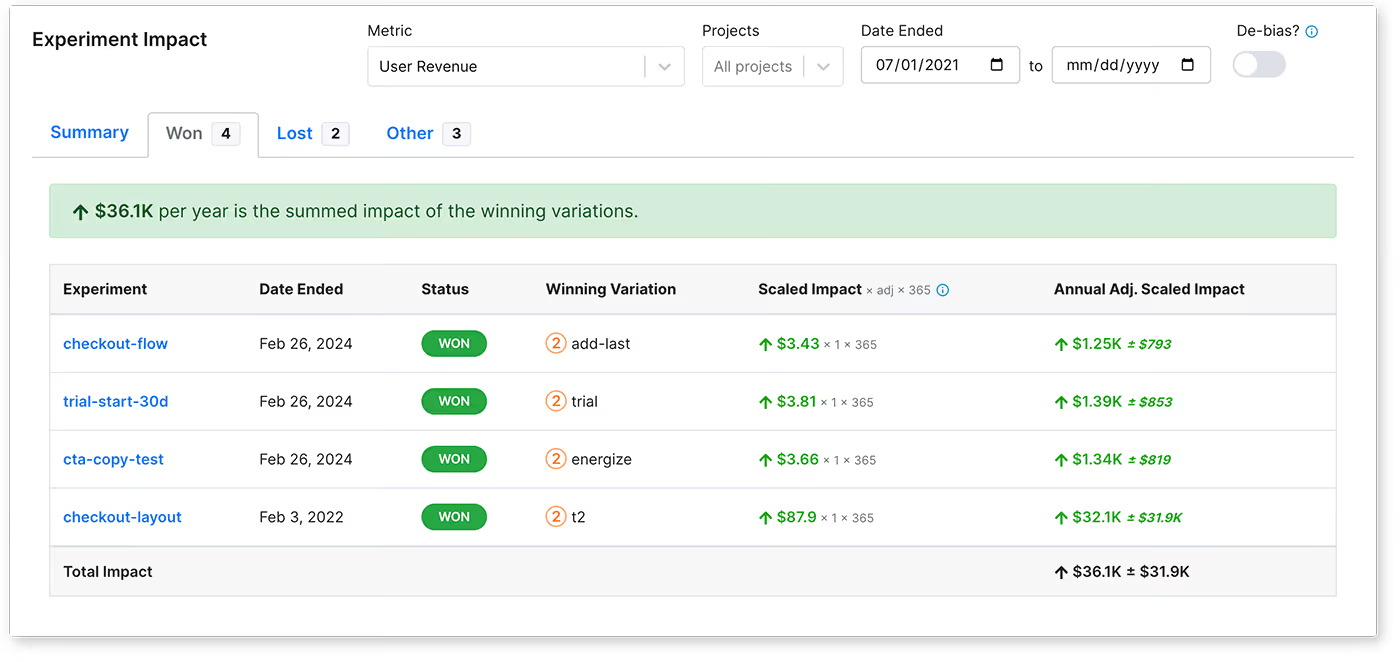
You can now view the cumulative impact of multiple experiments on your metrics. For example, let’s say you ran 50 experiments last quarter. You can now view the total combined impact those experiments had on your revenue. You can also filter by project to see the impact each team’s experiments had in isolation.
This Impact Analysis is a great way to demonstrate the value of experimentation to leadership. It highlights not only your wins, but also all of the money saved by NOT shipping something that was worse for your users.
Impact Analysis is available on the Management → Dashboard page and requires a valid Enterprise license.
New REST endpoints for projects, environments, and SDK connections
You can now programmatically create projects, environments, and SDK Connections via the REST API. This is especially useful for those who want to integrate GrowthBook deeply into their CI/CD pipelines.
For example, whenever a PR is opened, create an ephemeral Environment for it, along with a dedicated SDK Connection. Now, every PR can have its own set of feature flag rules that can get cleaned up automatically when the PR is closed.
Our REST API documentation contains all of these new routes with example code.
Major app performance improvements
We’ve made significant behind-the-scenes improvements to deliver a faster, more responsive experience when using GrowthBook. These changes include reducing network calls, optimizing database queries, caching frequently accessed data, and more.
These improvements are most noticeable for large enterprises with hundreds of users and thousands of experiments. We have a lot more planned here in the future, so stay tuned!
Advanced search filter syntax
Searching within GrowthBook just got a lot more powerful. Here are some example searches you can use now for experiments:
- tag:back-end
- is:stopped result:won has:screenshots variations:>2
- updated:>2024-07-17
- owner:jeremy has:!hypothesis metric:~revenue
And some more for feature flags:
- key:^main_
- on:dev off:production has:prerequisites
- is:!stale has:experiment created:<2024-07-10
In our docs, find a comprehensive list of available operators and fields, along with several more helpful examples to get you started.
Multi-org improvements
Large enterprises that have enabled GrowthBook’s “Multi-Org Mode” now have a new option for user provisioning.
Previously, all users had to be manually invited to the relevant organizations within GrowthBook. This was very tedious to maintain at scale.
Now, you can let users self-select organizations during sign-up. When a user authenticates via SSO and visits GrowthBook for the very first time, they will be shown a list of all organizations and can pick one or more to join. After joining, they can easily switch between organizations and join additional ones at any time.
Of course, this behavior is completely customizable. Each organization can decide if it wants to enable auto-joining or not. If disabled, users can still self-select the organization, but they will be blocked from joining until an administrator approves their request.
Learn more about the many benefits of multi-organization mode.

When companies adopt feature flags
In the wake of recent worldwide outages, the importance of robust deployment strategies has never been more apparent. These incidents serve as stark reminders of the potential consequences of failed deployments, affecting millions of users and businesses globally.
The wake-up call: learning from crisis
Feature flags are often a game-changer for many companies, but it's often a crisis that highlights their necessity. At a previous company, we learned this lesson the hard way when a single deployment brought down our site, leading to a frantic 30-minute scramble to revert and redeploy. This incident was a wake-up call, underscoring the value of feature flags.
Startups: speed and flexibility
Startups must often release features quickly to stay competitive and respond to market and customer demands. Feature flags are perfect for this—deploy code quickly, then toggle features on or off without additional deployments. Plus, you can easily tie feature flags to user states, making it simple to introduce tiered products and personalized experiences while mitigating risk by testing new features with a subset of users.
Scaling up: managing complexity
As companies grow, their codebases become more complex, and the stakes are higher. Unfortunately, many companies wait for a catastrophic failure before realizing the benefits of feature flags. Incident retrospectives can highlight better deployment methods, like controlled feature rollouts and phased releases.
Feature flags allow you to perform canary releases by targeting a small user segment first, which reduces the risk of widespread issues. Integrate them with Application Performance Monitoring (APM) systems to log errors and trace issues back to specific features. You can also create a subset of “beta users” to gather feedback and further mitigate risks.
At this stage, A/B testing becomes crucial. Platforms like GrowthBook make it easy to serve feature flags and conduct A/B tests, allowing you to measure the impact of new features and iterate based on real data. When multiple teams are working on different features, feature flags ensure smooth collaboration and prevent disruptions to ongoing work. They also support trunk-based development, streamlining your development process.
Mature organizations: stability and innovation
For mature organizations with robust Continuous Integration/Continuous Deployment (CI/CD) pipelines, feature flags are essential for separating deployment from release. This ensures that new features integrate smoothly and can be released when ready. Timing is critical; enabling feature flags provides the flexibility needed to get it right.
For large companies, downtime is not an option. Feature flags offer a safety net, allowing quick rollbacks of problematic features without affecting the entire application. This capability is crucial for maintaining uptime and delivering a reliable user experience.
Learn more about the 7 best practices to implement feature flags at scale.
Conclusion: a call to action
The adoption of feature flags is driven by a blend of business needs, technical challenges, and growth stages. From nimble startups to seasoned enterprises, feature flags offer the flexibility, control, and safety needed to innovate rapidly and reliably.
Don't wait for a crisis to strike. Assess your current deployment strategies and consider implementing proactively. Start with these steps:
- Develop clear policies for creating, managing, and retiring feature flags.
- Gradually expand usage across your application.
- Start small by implementing feature flags for non-critical features.
- Research feature flag management tools that integrate with your tech stack.
- Evaluate your current release process and identify pain points.
By understanding when and why to adopt feature flags, companies can enhance their development processes, improve user experiences, and maintain a competitive edge in the market. The question isn't whether you'll need feature flags, but when you'll implement them to safeguard your applications and users.

Client-side feature flagging: advantages and pitfalls
Feature flags are a powerful tool for building products that unlock significant advantages. With feature flagging, you can do staged rollouts, focused releases to specific user groups, remote configuration, A/B testing, and quickly turn off any feature if required. All of these benefits apply regardless of where you are running your feature flags. However, when using feature flags on the client side of a website/application, there are technical aspects to consider.
Local vs. Remote Configuration for Feature Flags: Pros and Cons
When using feature flags with a JavaScript SDK, there are a few ways these systems can work. Features can be sent down to the SDK for local evaluation, or the SDK can make a network call to a service with a user attribute and have that service return a list of feature states for that user. This latter way is called remote evaluation. There are pros and cons to both local evaluation and remote evaluation.
Using local evaluation for feature flags
With local evaluation, the feature flagging payload can come from anywhere, including a network call, a cache server, or even served statically from the file itself. One advantage of this is that the payload is the same for all users, so it can be cached. As a result, feature flags evaluated with local evaluation are much faster than remote evaluations, even if a network call is required.
The downside of local evaluation is that the rules must be transferred to the client running your SDK—in this case, the browser. As a result, you have to be careful not to disclose sensitive data, such as your targeting information.
GrowthBook has some built-in ways to help you avoid leaking information.
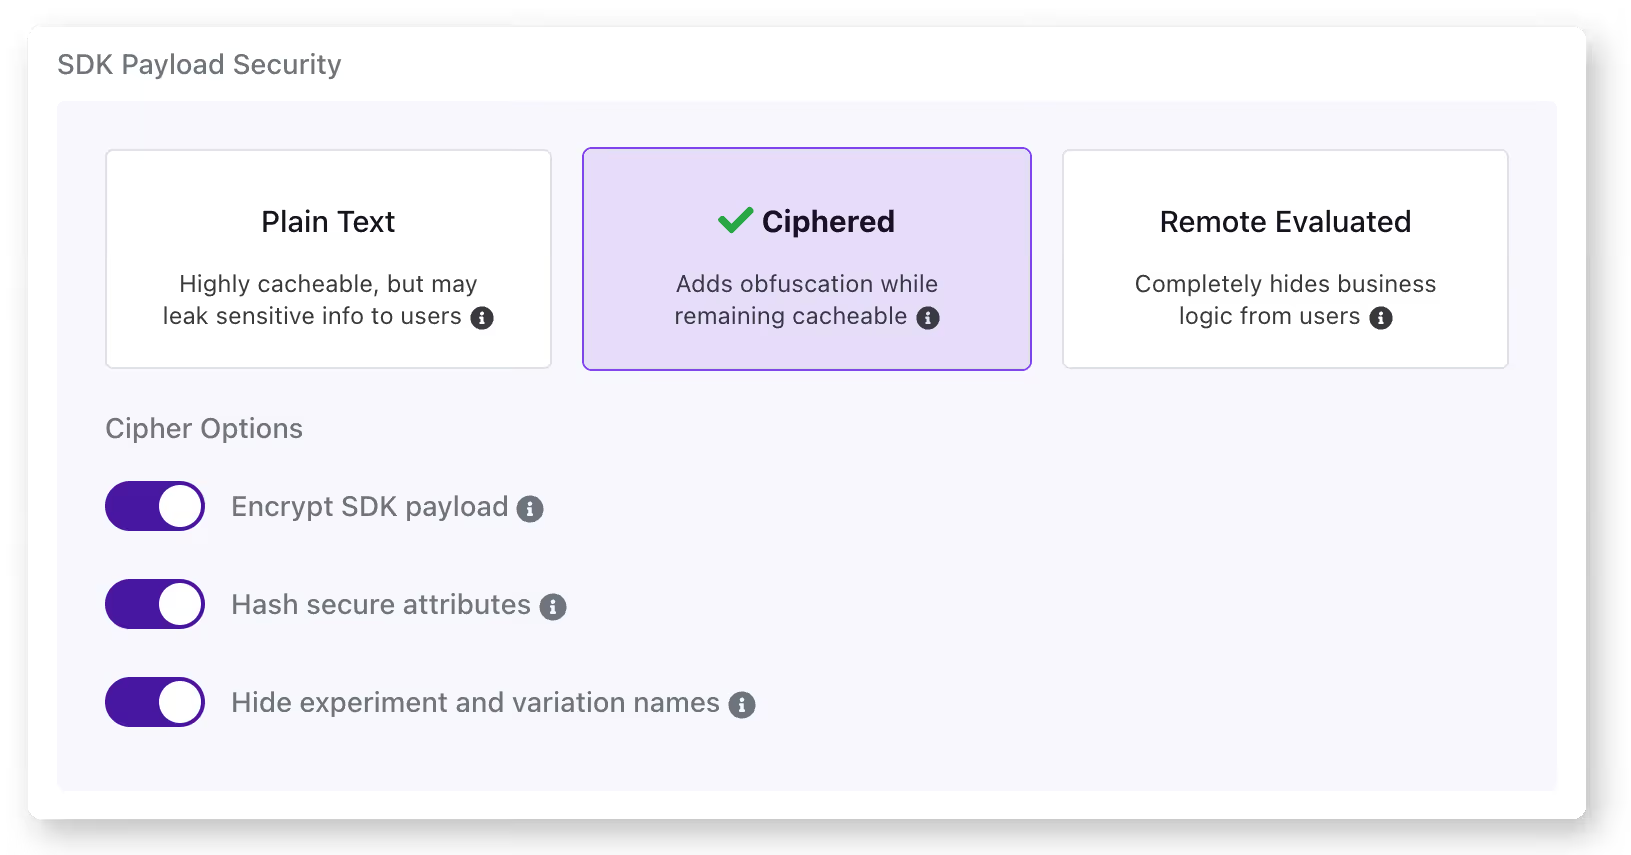
Payload encryption: The entire payload will be encrypted before being sent to the browser. This will prevent most people from seeing the payload's contents, and anyone inspecting the network request will not see anything meaningful. However, as the SDK on the client is decrypting, the contents can be visible with sufficient effort. You can learn more about setting this up with GrowthBook.
Hash secure attributes: With this option, you can hash the attribute values marked as 'secure' in the GrowthBook UI. The targeting conditions referring to these attributes will be anonymized via SHA-256 hashing. Values will be matched based on their hashed results, so the actual values are not visible. Hashed values, however, are not a perfect solution as they can be brute forced with enough effort and time, and they make targeting with regex impractical. When evaluating feature flags in a public or insecure environment (such as a browser), hashing provides an additional layer of security through obfuscation. You can read more about setting this up in GrowthBook.
Hiding experiment and variant names: With this option selected, users will not be able to see helpful experiment names or variant names. This helps remove any context around the features or experiments you're adjusting.
Using these settings, you can help protect sensitive information that you may inadvertently expose to the browser. For the highest level of protection, however, it's best not to pass that information to the browser at all. You can achieve this by not just targeting based on sensitive information, or for cases where this cannot be avoided, you can use remote evaluation.
Using remote evaluation for feature flags
With remote evaluation, the SDK passes a user identifier to a service to determine which features to enable for that user. The advantage is that the rules around which features are exposed are completely hidden from the browser. It also enables you to use more dynamic lookups based on that user.
Using remote evaluation requires a network call and is, therefore, slower than local evaluations. If your site or application requires feature flag states to show correctly for this user, it can cause moments where the default cases are shown. Finally, setting up a remote evaluation is slightly more complex than using local evaluation.
The remote evaluation server can be any endpoint that returns the state. To make this easier to implement, GrowthBook supports remote evaluation via our proxy server. You can also use an edge worker on the CDN for this.
Summary
Using client-side feature flags adds valuable functionality to your site or application. Hopefully, this article helps you understand the advantages and pitfalls of client-side flagging.

Better visual editor experiments
Experimenting on websites with a visual editor always has its pros and cons. But what if you could get all the positives of visual editors with none of the negatives? That’s what we’ve enabled with our new Edge SDKs. This article goes over some of the problems and how our new Edge worker SDKs solve them.
Client-side experimentation with a visual editor enables non-technical users to experiment with changes to a website. It makes optimizations super easy to launch. Open up the website with your visual editor, click on the elements you want to change—like headlines, CSS, images, and even Javascript—and launch the experiment. The experiments are instantly live with no code changes required.
Changes are applied while the page is loading or after the page completely loads. This leads to the first problem with visual editors- they can cause the page to flicker or flash as the experiment is loaded. While this might seem pretty minor, it can affect the validity of the results. If the page loading is very slow, the user may not even see the experiment variant, or even with normal loading, the flashing can cause users to pay more attention to that area, or get irritated about the flickering, which may affect the validity of the results.
The second problem is that some of the visual experiment scripts can slow down page load speeds. In some cases, the visual experiment Javascript that is loaded onto the page can be quite large and possibly even load other frameworks like jQuery, which can further increase load time.
Furthermore, many visual editors, including GrowthBook's editor, have an 'anti-flicker' feature. This feature actually hides the entire page as it loads in the background, and then when the experiment has loaded or it's taken more than N seconds (where N is typically 3 to 5 seconds), it will show the page. This will slow down the apparent page rendering time for your users. Slower connections can cause users to stare at a white page instead of seeing the page start to load, which may increase bounce rates or other behaviors affecting results.
Finally, some of the most popular experimentation javascript libraries can be blocked by ad-block scripts, resulting in users never seeing your experiment. As a best case, this can cause experiments to be underpowered, but since ad-block users tend to be more technical, it's not a random sampling of users and can bias results.
So how do we fix this?
We take advantage of CDN edge workers. CDNs, or content distribution networks reduce latency and increase performance by caching your site on a global network of servers. In this context, the edge is the closest cache server to your client. Many CDNs let you run code on these edge servers; these code runners are called ‘edge workers’.
With edge workers, we can render our experiment variants directly to the HTML served from the edge to the client. This means that the webpage delivered to the client has the experiment baked into it, so when the client receives the page, there is no flickering, the page loads without any delays, and the experiment is not susceptible to ad-blockers.
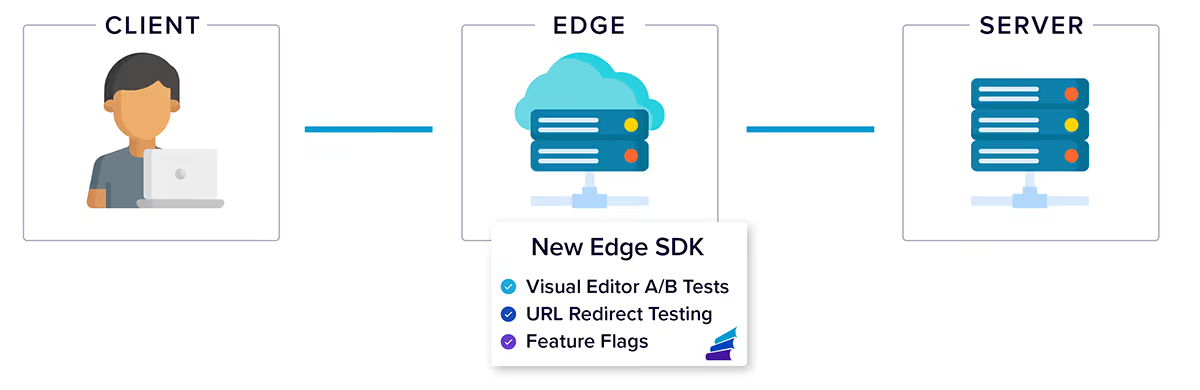
Our edge worker SDKs not only unlock visual experiments without compromise but also enable URL redirect experiments and the use of feature flags on the edge. It really is quite magical.
Example for Cloudflare Workers
Here is an example of just how easy it is to set up GrowthBook's Edge SDK with Cloudflare.
- Set up CF project. Based on CF’s Getting Started guide
npm create cloudflare@latest
npm i --save @growthbook/edge-cloudflare
Then you can test locally with:
npx wrangler dev- Add our turnkey Edge App as your request handler:
import { handleRequest } from "@growthbook/edge-cloudflare";

export default {
  fetch: async function (request, env, ctx) {
    return await handleRequest(request, env);
  },
};
- Set up environment variables to integrate GrowthBook with your worker and to specify your destination site’s URL in the `wrangler.toml` file:
PROXY_TARGET="https://internal.mysite.io"  # The non-edge URL to your website
GROWTHBOOK_API_HOST="https://cdn.growthbook.io"
GROWTHBOOK_CLIENT_KEY="sdk-abc123"
GROWTHBOOK_DECRYPTION_KEY="key_abc123" # Only include for encrypted SDK Connections- OPTIONAL: Further optimize by implementing caching for the GrowthBook API:
- Eliminate all calls to the GB API by caching the API payload using a Cloudflare KV store and pointing our SDK Webhook to populate the KV store when things change
- Or… Keep it simple and have the Edge app use a KV store for payload caching
- Running it on Cloudflare.
For testing:
npx wrangler devOr when you're ready to deploy:
npx wrangler deployThen adjust the DNS if needed to point to the right location.
GrowthBook version 3.0
We’re super excited to announce the release of GrowthBook 3.0! This is a huge release and includes brand-new Edge SDKs (Cloudflare, Fastly, and Lambda), support for custom priors and CUPED in our Bayesian stats engine, and much more! Full details below.
A/B testing on the edge
We’re proud to announce dedicated SDKs for Cloudflare Workers, Lambda@Edge, and Fastly Compute! These new integrations allow you to easily run A/B tests on your website with zero compromises. Combine the crazy-fast load times and reliability of a CDN with the power and flexibility of client-side A/B testing, all with zero flickering and a dead-simple setup.
How does it work? Our Edge SDKs sit in front of your website and modify the HTML before it reaches your users. No blocking script tags, no flickering, no AdBlock issues, and no need to write any custom code.
Our Edge SDKs support Visual Editor experiments, URL Redirect tests, and Feature Flags. Check out the docs for Cloudflare, Fastly, Lambda, and other Edge platforms.
Bayesian priors and CUPED support
For this 3.0 release, we completely overhauled our Bayesian stats engine, resulting in some exciting new features and improvements in accuracy and reliability.
You can now configure informative priors on a per-metric and organization-wide basis. Instead of starting each test from zero, we can start with some prior beliefs - for example, the knowledge that most of your experiments only change revenue by at most +-5%. Picking good priors can help reduce your false positive rate and give you more confidence in your results.
CUPED is a powerful technique that analyzes user behavior in the weeks leading up to an experiment to control for variance during the test. In some cases, this can cut the required running time in half! We’ve supported CUPED since version 2.0 in our Frequentist engine, and now, in version 3.0, we’re excited to bring support to the Bayesian engine.
Read more about these updates on our blog.
Custom roles
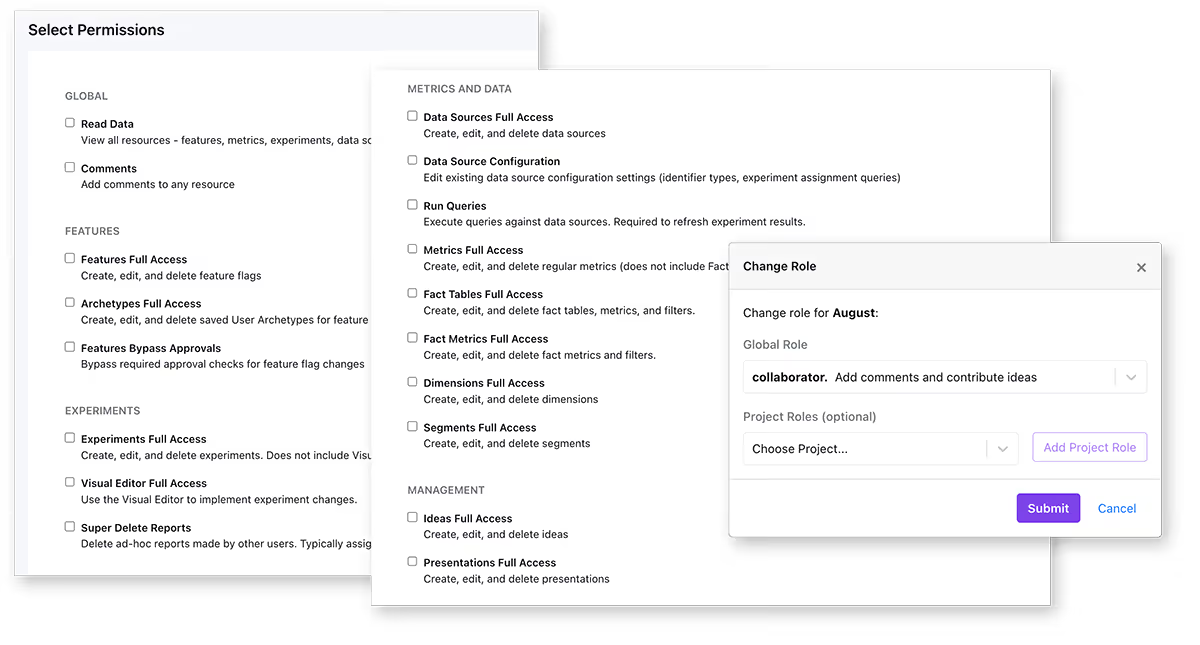
Our long-awaited Enterprise feature - Custom Roles - is finally live! Want an `engineer` role but without the ability to modify saved groups? Or an `admin` who can do everything except invite new team members? Both of these are now possible, along with whatever other crazy combos you can come up with. We’re starting with a “small” list of 35 permission policies to mix and match from, but we plan to add more fine-grained options in the future, so let us know what you’d like to see!
View the Custom Role docs for more details.
OpenFeature support
.avif)
We’re excited to join the OpenFeature ecosystem as an official GrowthBook Provider. This initial release adds support for the Web and React SDKs, but we plan to add providers for all supported languages soon, so stay tuned!
.avif)
Experiment Slack/Discord alerts
We have big plans for alerting and webhooks and to kick us off, we’re launching a new `experiment.warning` event that is triggered when there’s a Sample Ratio Mismatch (SRM) error, results fail to update, or if we detect Multiple Exposures (users seeing multiple variations).
As with all of our events and webhooks, you can filter these alerts by project, environment, and tag and route them to Slack, Discord, or any other custom destination.
Stay tuned for many more events and updates coming soon!
JSON feature flag editor
.avif)
Way back in version 2.2, we added Enterprise JSON Schema validation for feature flags. This was great for avoiding typos and ensuring consistency in your JSON feature values. However, there were two big drawbacks. First, you had to write a JSON Schema from scratch, which can be very tedious and time-consuming. Second, users still had to type raw JSON when setting the feature value, which is not the most user-friendly.
In this release, we set out to solve both of these problems. There’s a brand new “Simple” validation option with an easy-to-use schema builder - no need to write JSON Schema from scratch. More excitingly, we now use this schema to generate a user-friendly UI throughout GrowthBook! With these changes, you now get JSON validation and a better UX, all without writing any code.
New Next.js examples
.avif)
We’ve updated our Next.js examples to include all the new rendering strategies available with the Next 14 App Router. We show how to use GrowthBook within React Server Components, how to integrate with the built-in fetch cache (with webhook revalidation), and a powerful hybrid strategy that lets you do client-side feature flagging without any client-side network requests!
Check out the new App Router examples, along with our updated Pages Router examples.
SDK updates
.avif)
The GrowthBook team and community have worked hard to create and improve our SDKs. We’ve added a new React Native SDK, completely refreshed the Elixir, GoLang, and C# SDKs, and improved the Java, Python, Ruby, JS, React, Flutter, Swift, and Kotlin SDKs.

Measuring A/B test impacts on website latency: using quantile metrics in GrowthBook
Traditional A/B testing compares the mean of a treatment variation to the mean of a control variation. However, for many features or improvements, the average effect may be less important than the impact on outliers. For example, many times the goal of a feature is to reduce request latency for the slowest requests rather than just the average request latency. In such cases, quantile testing can be the solution, and GrowthBook now supports it for Pro and Enterprise customers.
This content is also in video format if desired.
What is quantile testing?
In quantile testing, quantiles are compared across variations. For example, you may want to compare P99 web page latency across different variations, where P99 is defined as the 99th percentile (i.e., the value below which 99% of website latencies fall). This is in contrast to mean testing, where the population means of variation A is compared to the population mean of variation B.
Setting up your quantile metric
Quantile metrics are built on Fact Tables.
- Create a Fact Table that points to your data warehouse that has one row per request with a column for the latency of that request.
On the left-hand side of the home page, select Fact Tables (located under Metrics and Data), and then select Add Fact Table. Your Fact Table will have a few key columns such as session_id, user_id, timestamp, and latency.
Below is the SQL code for the Fact Table.
SELECT
  user_id,
  timestamp,
  latency
FROM
  requests
- Create a quantile metric that builds a quantile for that latency column
After creating your Fact Table, click Add Metric on the page for your Fact Table. Select Quantile for Type of Metric.
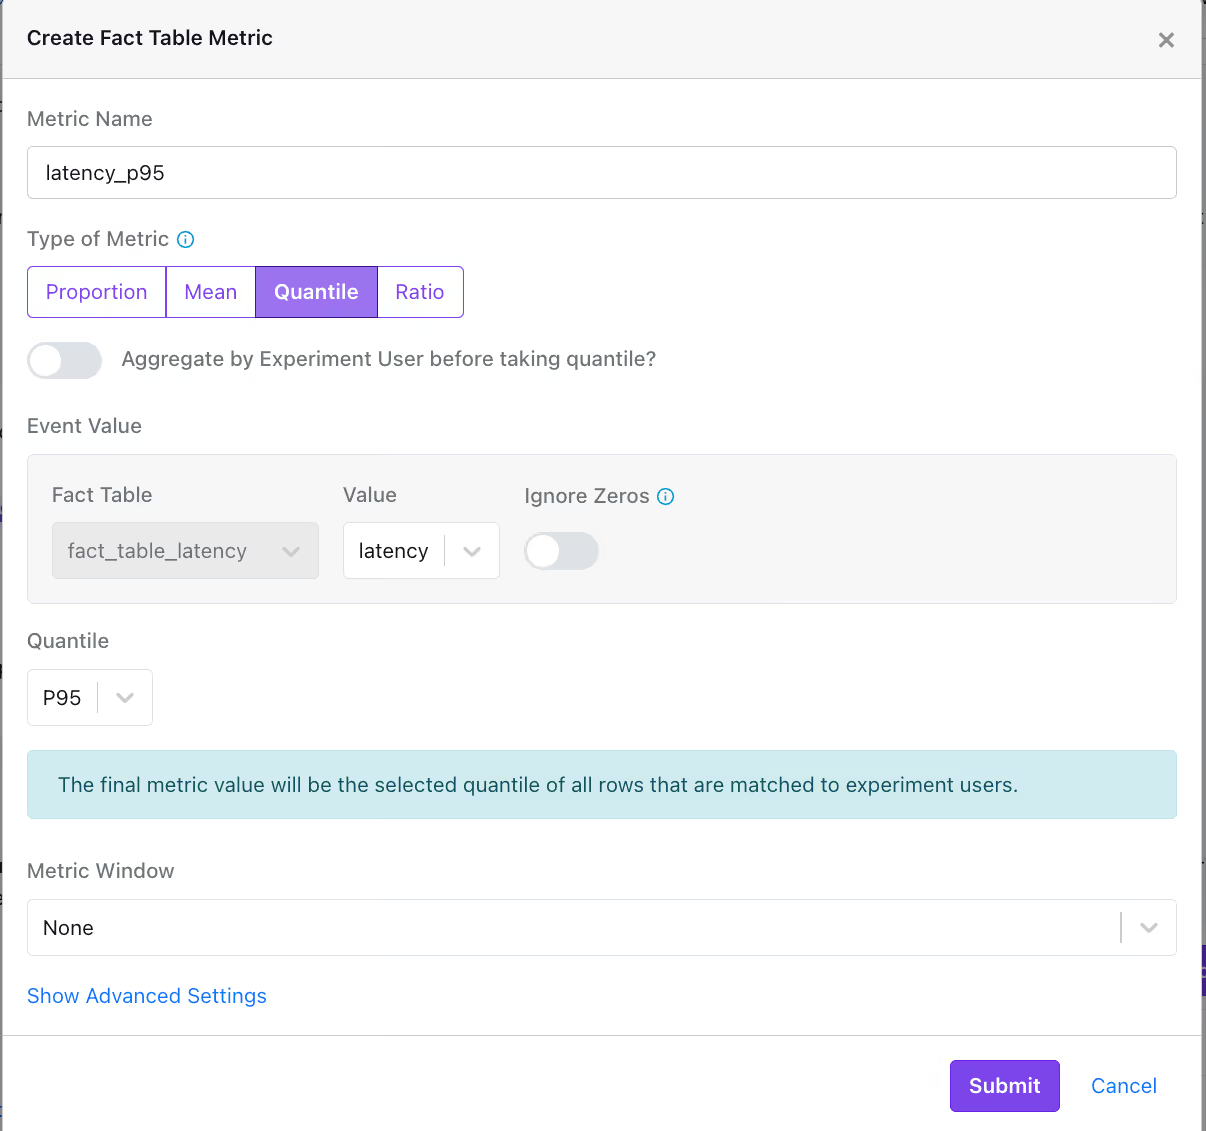
You can create a mean metric for the average latency, as well as different quantile metrics, such as P99.
Running your quantile test
Now that you have created your metrics, add them to your experiment just like any other metric. Quantile metrics can be analyzed alongside mean metrics. Below are your quantile metric results.
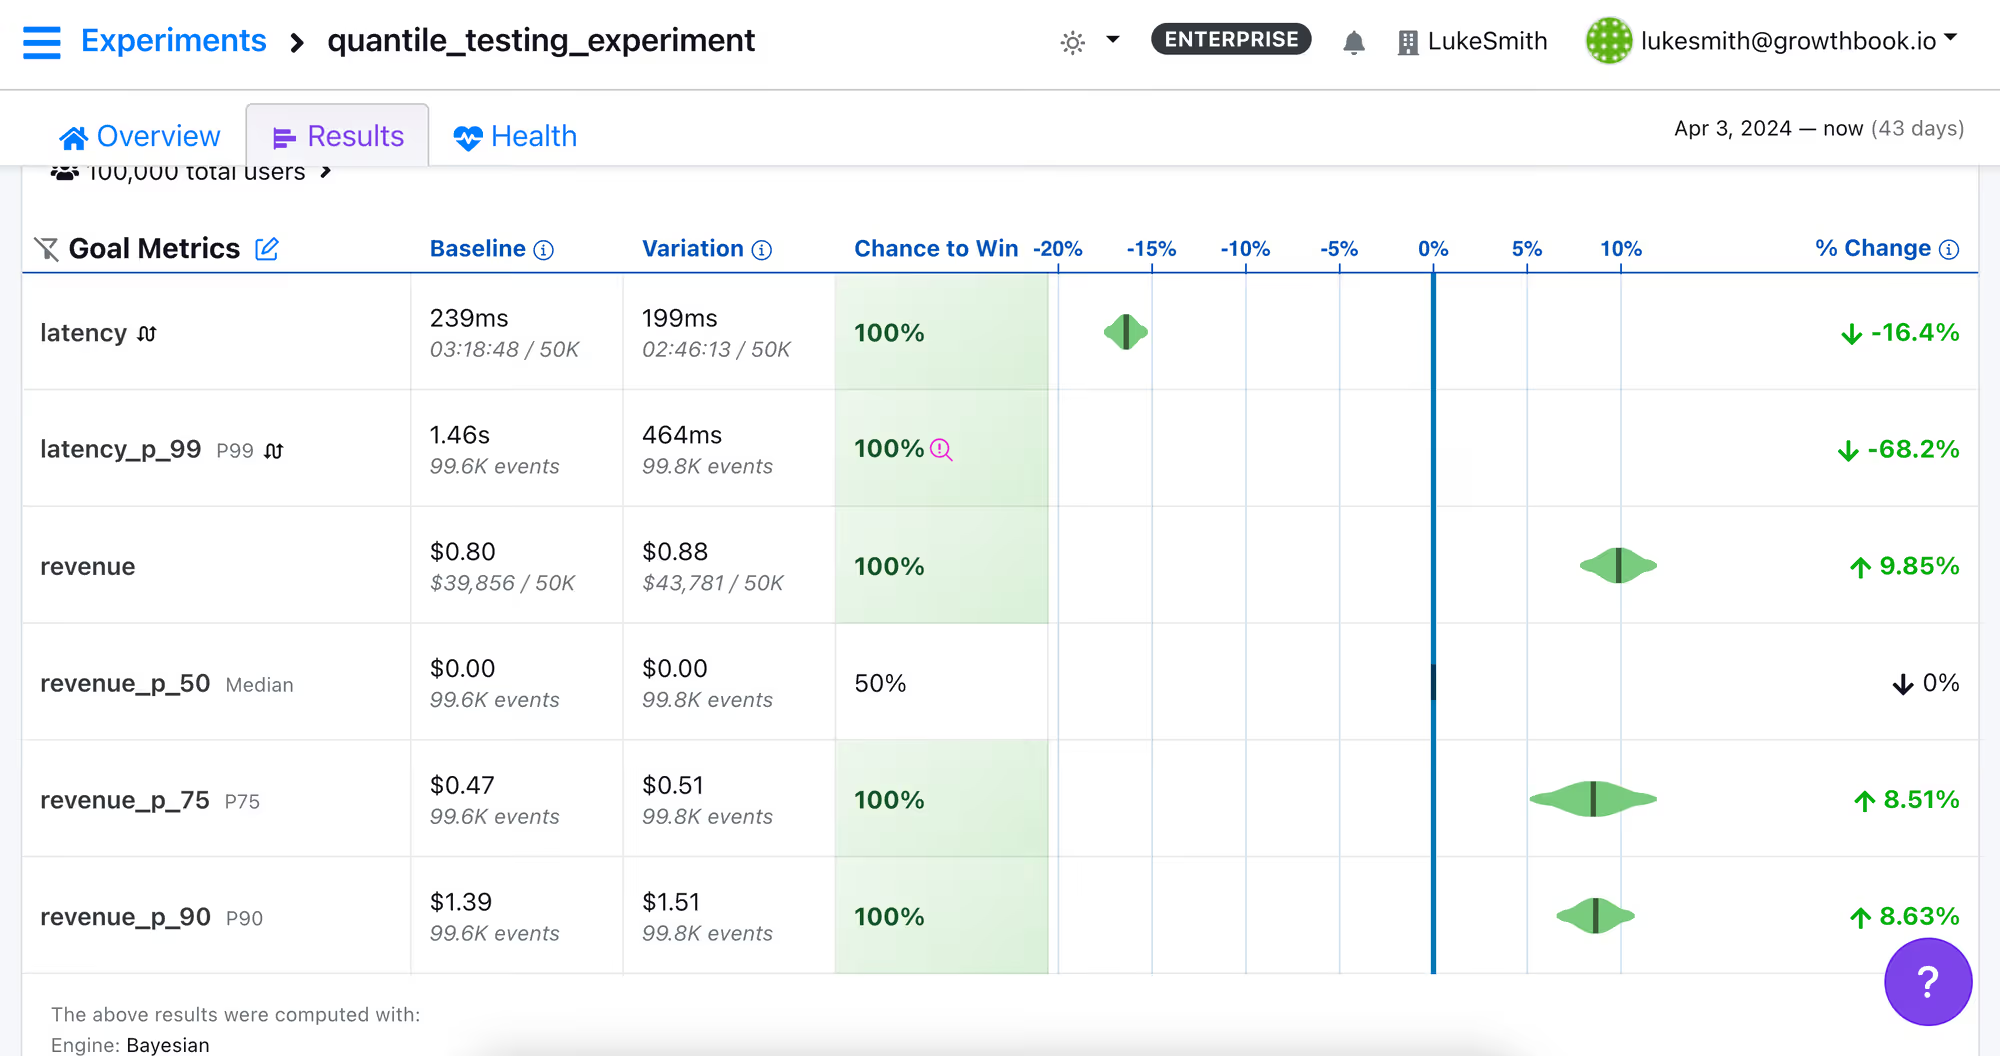
Suppose you want to answer the question, “Did I improve the worst website latency experiences for our users?” The first metric to look at is latency, which is a mean metric. There is a 40 ms reduction from 239ms to 199ms. While this reduction is helpful, quantile metrics can better answer this question. The metric latency_p_99 estimates P99 latency for a variation. Treatment reduced P99 latency from 1460 ms to 464 ms. So treatment had a big impact on the worst latencies!
Suppose you also want to answer the question, “did improving latency also improve revenue, and if so, on which users?” The mean metric revenue shows a 10% increase in mean spend from $0.80 to $0.88. You created three quantile metrics (revenue_p_50, revenue_p_75, and revenue_p_90 ) to examine which subgroup of users is benefitting. That is, are gains coming from typical users (median revenue, represented by revenue_p_50), moderately high spenders (represented by revenue_p_75), or the highest spenders (represented by revenue_p_90)? The table above shows no improvement for typical spenders, who have spend of $0. Further, the table also shows roughly 9% improvement for both moderately high and high spenders. Finally, you can see that in both groups at least 50% of customers have 0 spend, and you can see P75 and P90 spend. So quantile testing provides a more complete picture of the distributions of both groups, as well as the feature impact along the distribution.
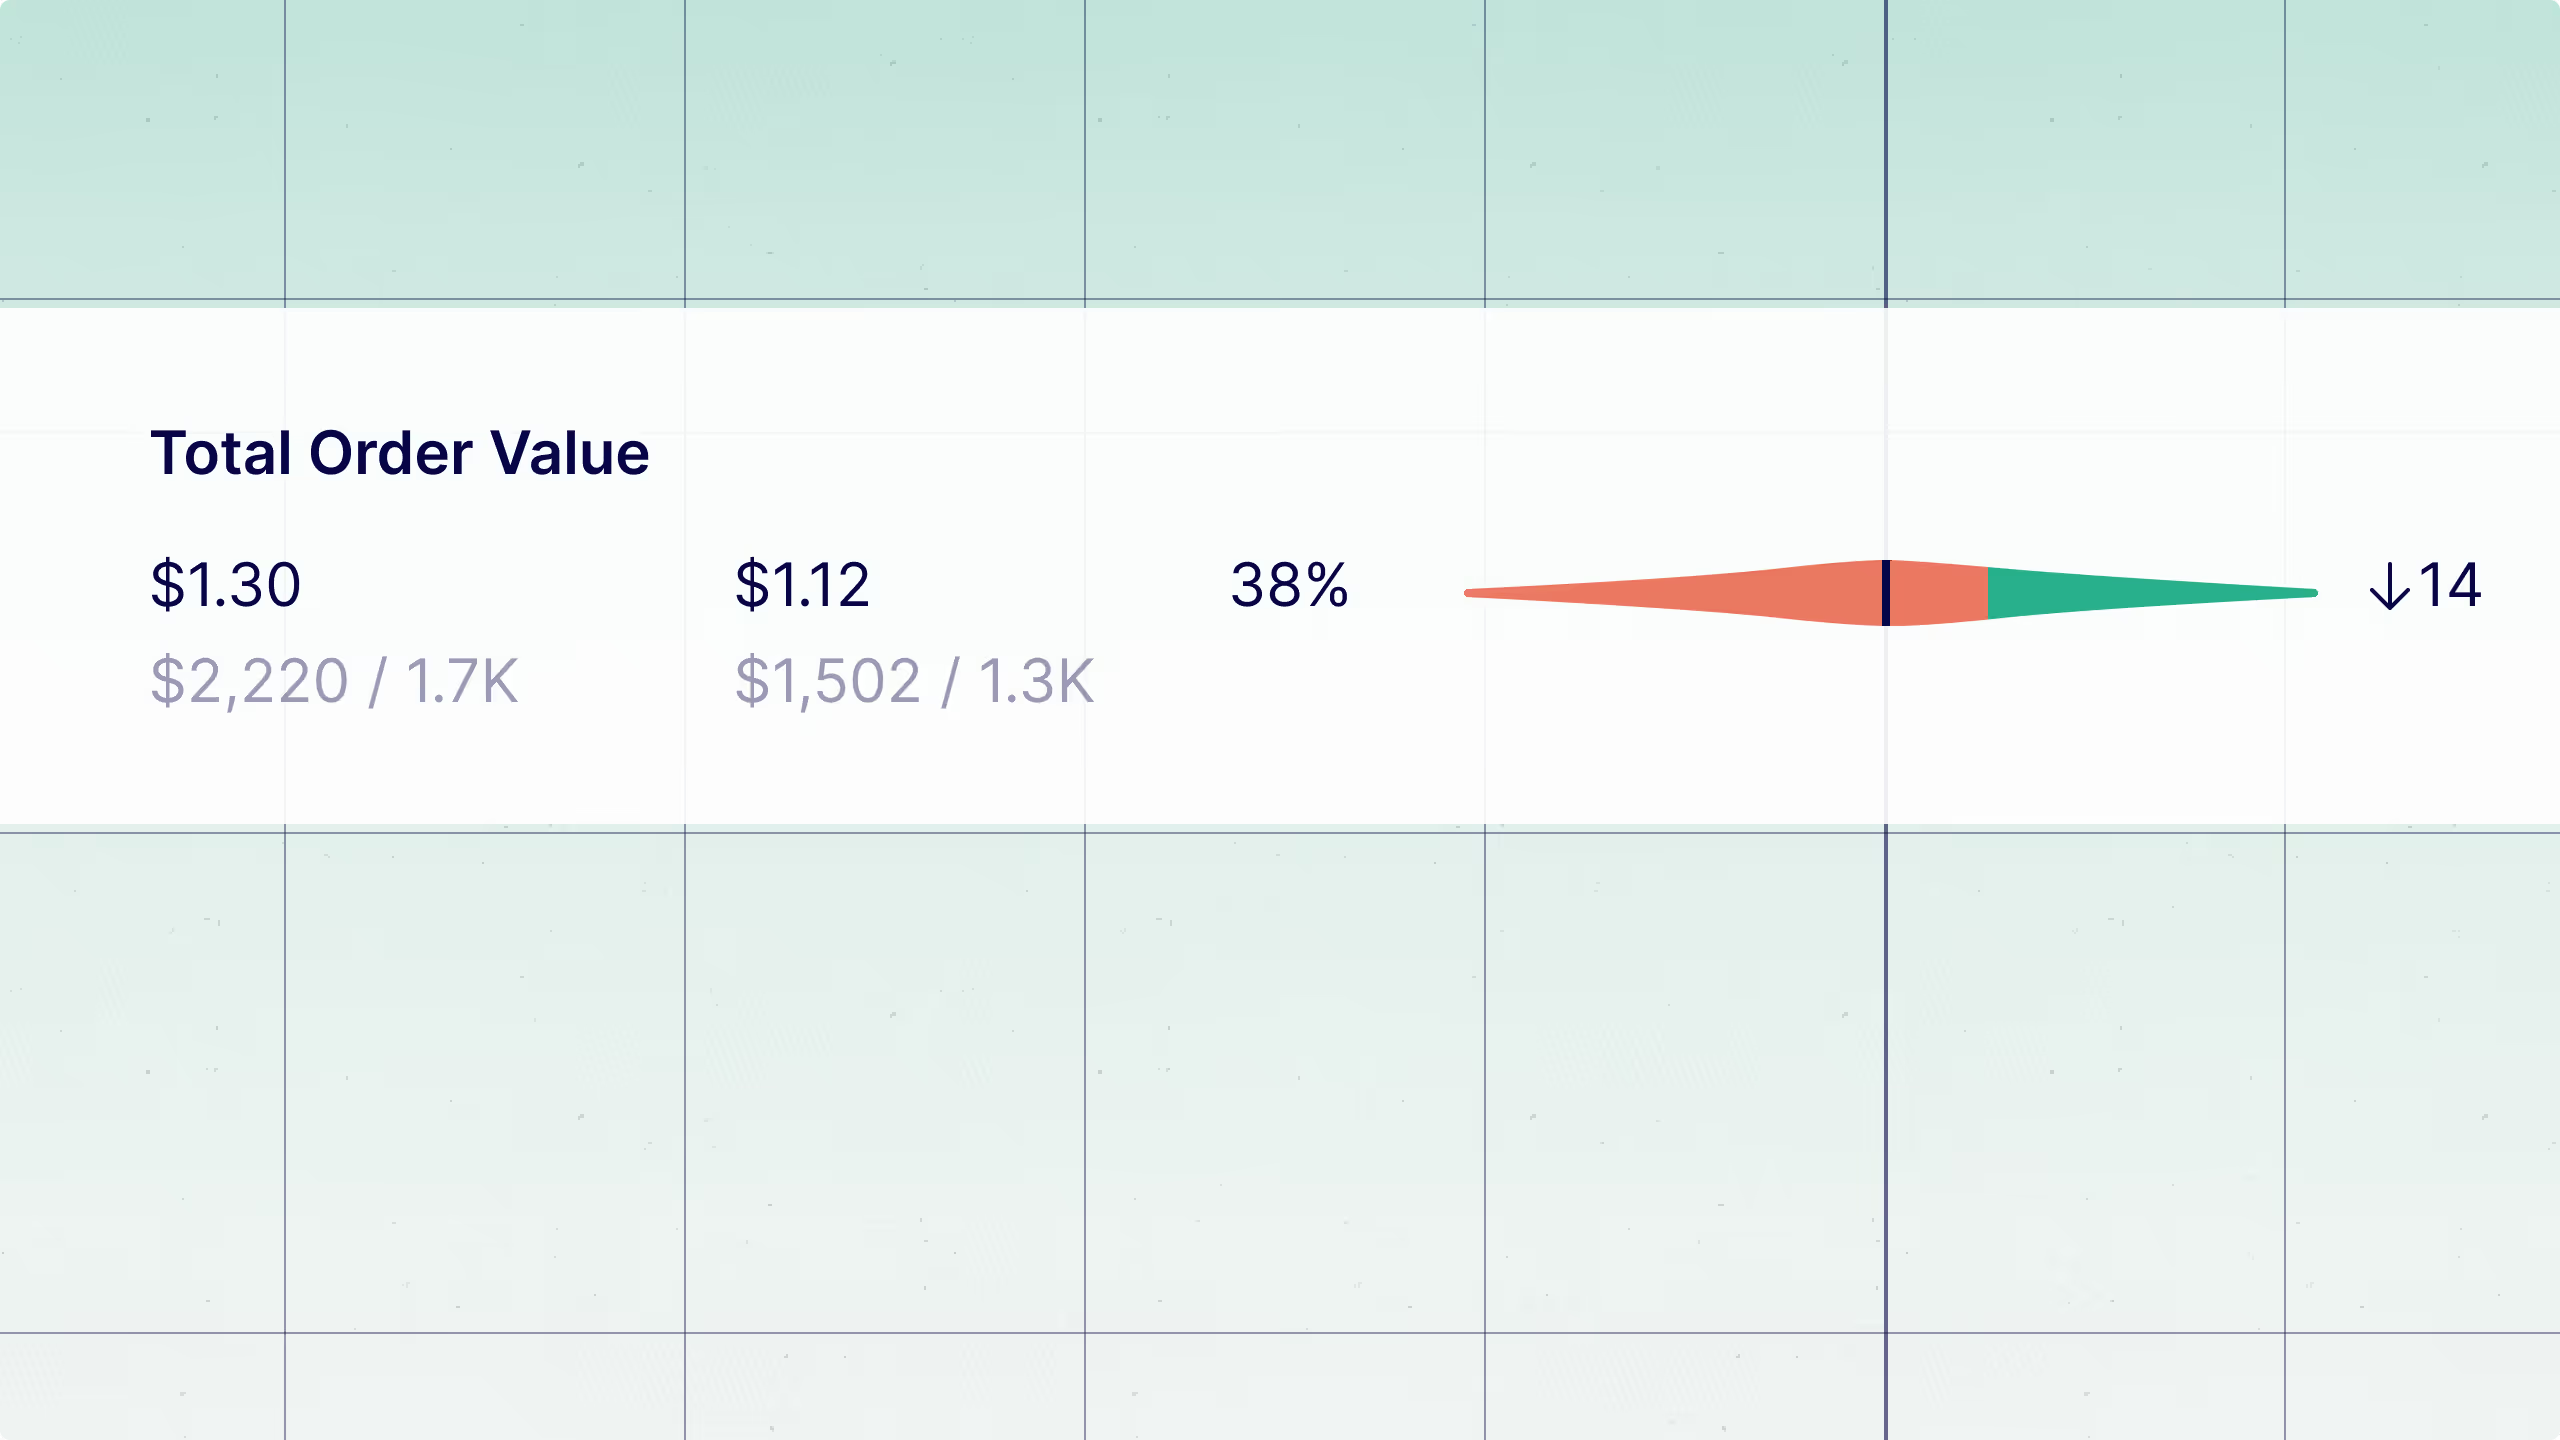
Bayesian model updates in GrowthBook 3.0
In anticipation of the forthcoming GrowthBook 3.0 release, we’re making several changes to how our Bayesian engine works to enable specifying your own priors, bring variance reduction via CUPED to the Bayesian engine, and improve estimation in small sample sizes.
What does this update mean for your organization? In some cases, you may notice a slight shift in the results for existing experiments. However, the magnitude of these shifts is minimal, only applies in certain cases, and serves to enhance the power of our analysis engine.
This post will give a high-level overview of what’s changing, why we changed it, and how it will affect results. Prefer video? Watch the walkthrough on Loom:
The new Bayesian model
In Bayesian inference, we leverage a prior distribution containing information about the range of likely effects for an experiment. We combine this prior distribution with the data to produce a posterior that provides our statistics of interest — percent change, chance to win, and the credible interval.
The key difference in our new Bayesian engine is that priors are specified directly on treatment effects (e.g. percent lift) rather than on variation averages and using those to calculate experiment effects. With this update, you only need to think about how treatment will affect metrics instead of providing prior information for both the control variation and the treatment variation. This simplifies our Bayesian engine and the work involved for you.
This change is largely conceptual for many customers. If you’re interested in the details, you can read about the new model here and the old model in the now outdated white paper.
3 key benefits of the new model
1) Specify your own priors
The previous model required at least 4 separate values to be specified for every metric in order to set custom priors. This involved more effort to come up with reasonable values.
Now, you set a single mean and standard deviation for your prior for the relative effects of experiments on your metric. For example, a prior mean of 0 and a standard deviation of 0.3 (our defaults if you turn on priors) captures the prior knowledge that the average lift is 0% and that ~95% of all lifts are between -60% and 60%, in line with our existing customer experiments.
The default is not to use prior information at all, but you are able to turn it on and customize it at the organization level, the metric level, and at the experiment-metric level.
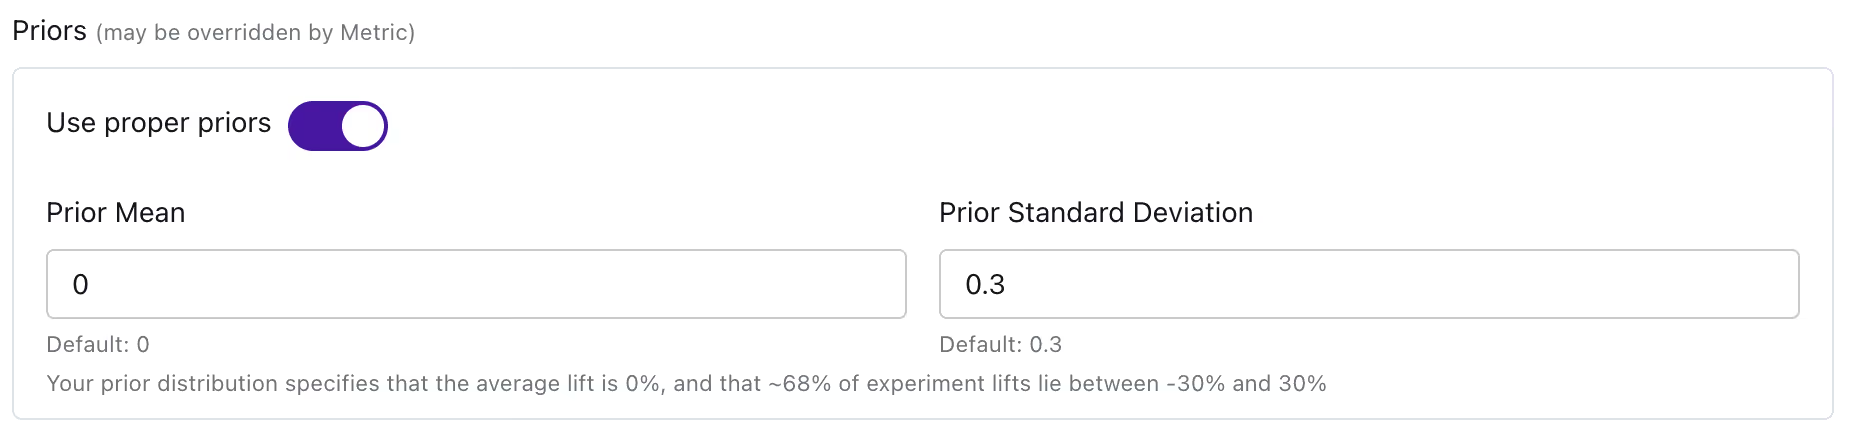
2) CUPED is now available in the Bayesian engine
By modeling relative lifts directly, the new model unlocks CUPED in the GrowthBook Bayesian engine for all Pro and Enterprise customers. CUPED uses pre-experiment data to reduce variance and speed up experimentation time and can be used with either statistics engine in GrowthBook. You can read a case study about how powerful CUPED is here and you can read our documentation on CUPED here.
3) Fewer missing results with small sample sizes
Our old model worked only when the model was reasonably certain that the average in the control variation was greater than zero. When the control mean was near zero, the log approximation we previously relied on could return no chance to win or credible intervals (CI). You might have seen something that looked like the following computation of confidence intervals:

The 50% is a placeholder as we could not compute the inference and the CI is missing. This is somewhat frustrating, given that there’s almost 3k users in this experiment! In the new model, we do not have the same constraints and we can instead return the following, more reasonable results:

How does it affect existing estimates?
Any new experiment analyses, whether that be a new experiment or a results refresh for an old experiment, will use the new model. If the last run before refreshing results used the old model, results could shift slightly even if you do not use the new prior settings.
- For proportion/binomial/conversion metrics, the % change could shift, along with chance to win and the CI. However, these shifts should be minimal (< 3 percentage points) in most cases, especially if the variations are equal size.
- For revenue/duration/count/mean metrics, the % change should not shift at all, but the chance to win and the CI could change slightly (again up to around 3 percentage points except in some edge cases).
For example, here’s a typical proportion metric and what it looks like before and after the change.
Before:

After:

The changes for revenue metrics (and other count or mean metrics) should be even less pronounced on average.
Were the old results incorrect?
No.
The results from the old Bayesian model were not less accurate or incorrect. In general, Bayesian models can take many forms, each with their own pros and cons. The old model was tuned to specify priors for each variation separately, which made it highly customizable but more tedious to set up. The new model makes setting priors easier and improves our ability to compute key inferential statistics in small sample sizes.
The new model moves the Bayesian machinery to focus on experiment lifts; this allows us to leverage approaches like the Delta method to compute the variance for relative lifts as well as CUPED to make the new model more tractable in certain edge cases and more powerful for most users.
Feel free to read more about the statistics we use in our documentation here or reach out in our community Slack here.

GrowthBook version 2.9
We’re proud to announce the release of GrowthBook 2.9, which includes many highly requested features, including feature flag approvals, URL redirect testing, and quantile metrics. Full details are below.
URL redirect testing

One of the most common use cases for A/B testing is comparing two versions of a page hosted on different URLs to see which performs better. This was possible already with feature flags, but it required writing a lot of custom code and manually handling tricky edge cases. Now, GrowthBook has built-in support for this.
Simply design a new experiment, add a URL Redirect, and start the test! All you need on your site is the latest version of our JavaScript, React, or new HTML Script Tag SDK (see below). When a user visits the targeted URL and is assigned one of the treatments, they will be redirected to the new URL immediately.
This initial release is geared toward client-side redirects in a browser, but we’re actively working on support for CDNs and Edge Workers, which we’re super excited about! URL Redirect tests require a Pro or Enterprise license. View the docs here.
Feature flag approvals

GrowthBook now supports advanced approval flows for feature flag changes. It behaves similarly to GitHub — make a change in a new draft revision, mark it as “ready to review”, another person on your team reviews it and decides whether to approve, request changes, or just leave a comment. Once approved, you can publish your draft to make it live. There’s also a brand new “Drafts” page where you can see all of the active feature drafts and their statuses.

In this initial release, we let you configure which environments require approvals and whether approvals should be dismissed when further changes are made. The Drafts tab is available to everyone, but approval flows require an Enterprise license key. Contact sales@growthbook.io or view the docs if you’re interested in learning more. We have a lot planned here in the future, so stay tuned!
Quantile metrics (median, P99, and more)
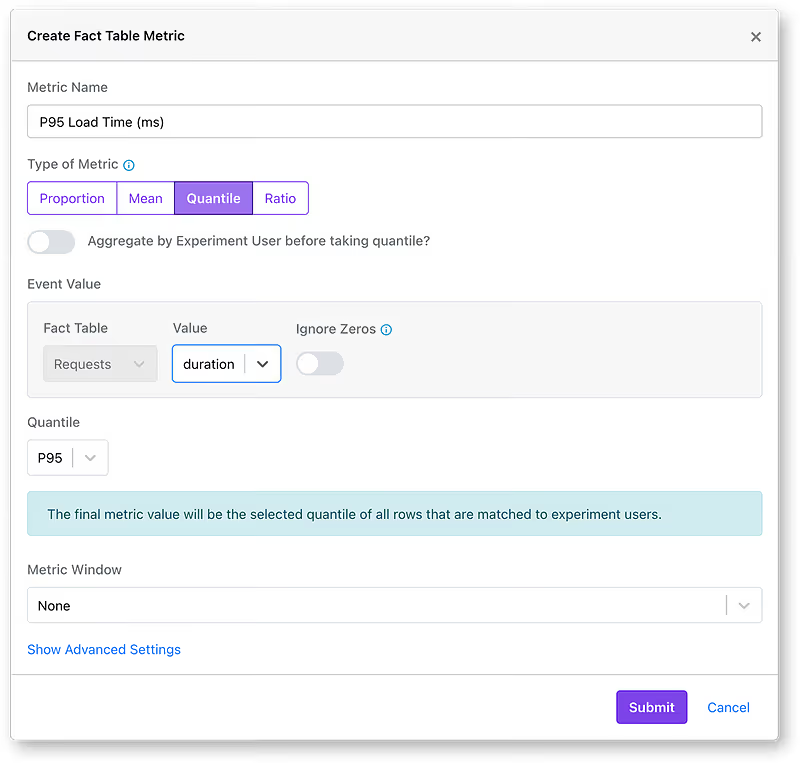
We’re proud to announce that GrowthBook is the first experimentation platform to fully support Quantile metrics. You can now report on things like P99 Latency, Median purchase price, and even use quantiles for decomposition deep dives!
Quantile metrics are built on top of Fact Tables and utilize advanced techniques to keep your SQL fast and efficient while maintaining high accuracy in the statistical results. You can read more about this (including a technical deep dive) in our docs. Quantile metrics are available to all Pro/Enterprise customers and support all data sources except for MySQL and Mixpanel.
Project-scoped attributes and environments

For large complex applications, projects in GrowthBook are crucial for organizing your features and experiments. For example, you might have separate projects for your front end, back end, and mobile app. In previous versions of GrowthBook, targeting attributes and environments were global and shared between all projects. This resulted in some weird situations, like a mobile app having a “browserVersion” attribute or your marketing site having a “staging” environment when that was only relevant to your back end.
Now, you can restrict attributes and environments to a subset of your projects, simplifying the GrowthBook UI and reducing the chance for typos and mistakes. Plus, when combined with project-scoped roles, you now have fine-grained control over exactly who can manage which attributes and environments.
New HTML script tag SDK
There’s a brand new GrowthBook SDK available, perfect for all low-code websites (Webflow, Shopify, WordPress, and more). All you have to do is add a single `<script>` tag to your website, and you’ll get support for our Visual Editor, new URL Redirect tests (see above), and even Feature Flags! No configuration required (although there are lots of knobs and switches for those who want them). Check out the docs here!
New and improved webhooks with Sslack/Discord support

We’ve revamped our event webhooks with more powerful filtering. Want to trigger a webhook for all feature flags that change in `production` with the tag “important”? You can do that! And to make integration easier, there’s a new Formatter option to automatically render the webhook in a format that Slack or Discord understands.
Now, with only a few clicks, you can enable fine-grained notifications directly in your messaging app. Support for MS Teams, as well as more event types, is coming soon! Read the docs here.
Other improvements
- New improved LaunchDarkly importer
- Improved documentation on holdouts
- 50+ other bug fixes and improvements

Code references
As companies grow, they often find themselves increasingly reliant on feature flags. While these are valuable tools, they sometimes linger in the codebase, leading to technical debt. It's important for developers to be aware of this and consider regular clean-ups. If not addressed in a timely manner, this can become a challenging issue, potentially affecting the engineering team's efficiency and effectiveness. Proactive management of these feature flags can help ensure smooth and sustainable operations.

Code References is a new feature that allows teams to quickly see instances of feature flags being leveraged in their codebase. By scanning customers’ code bases via CLI tool and sending results to our application backend, GrowthBook can help surface valuable information early and direct devs to the exact lines of code that need addressing.
Let's take a high-level look at how Code References in GrowthBook works and how your company can get started with its GrowthBook account.
Overview
Code References requires implementing a step in your development CI workflow.
Since the task of searching for multiple feature flag keys across a potentially large codebase can be hard, we've provided a low-level Go utility meant to run quickly on your CI infrastructure that can produce results that your GrowthBook API can process.
This utility is called gb-find-code-refs, and is a fork of an existing open-source tool created by LaunchDarkly called ld-find-code-refs. Our changes have made the tool more general purpose, so you can use it for your own purposes in addition to using it with GrowthBook.
Using gb-find-code-refs, you can create a CI job that will fetch feature flags from GrowthBook, then scan your codebase for those flags using gb-find-code-refs, and finally submit those generated code references back to GrowthBook.
The diagram below illustrates the flow of information from gb-find-code-refs to GrowthBook.
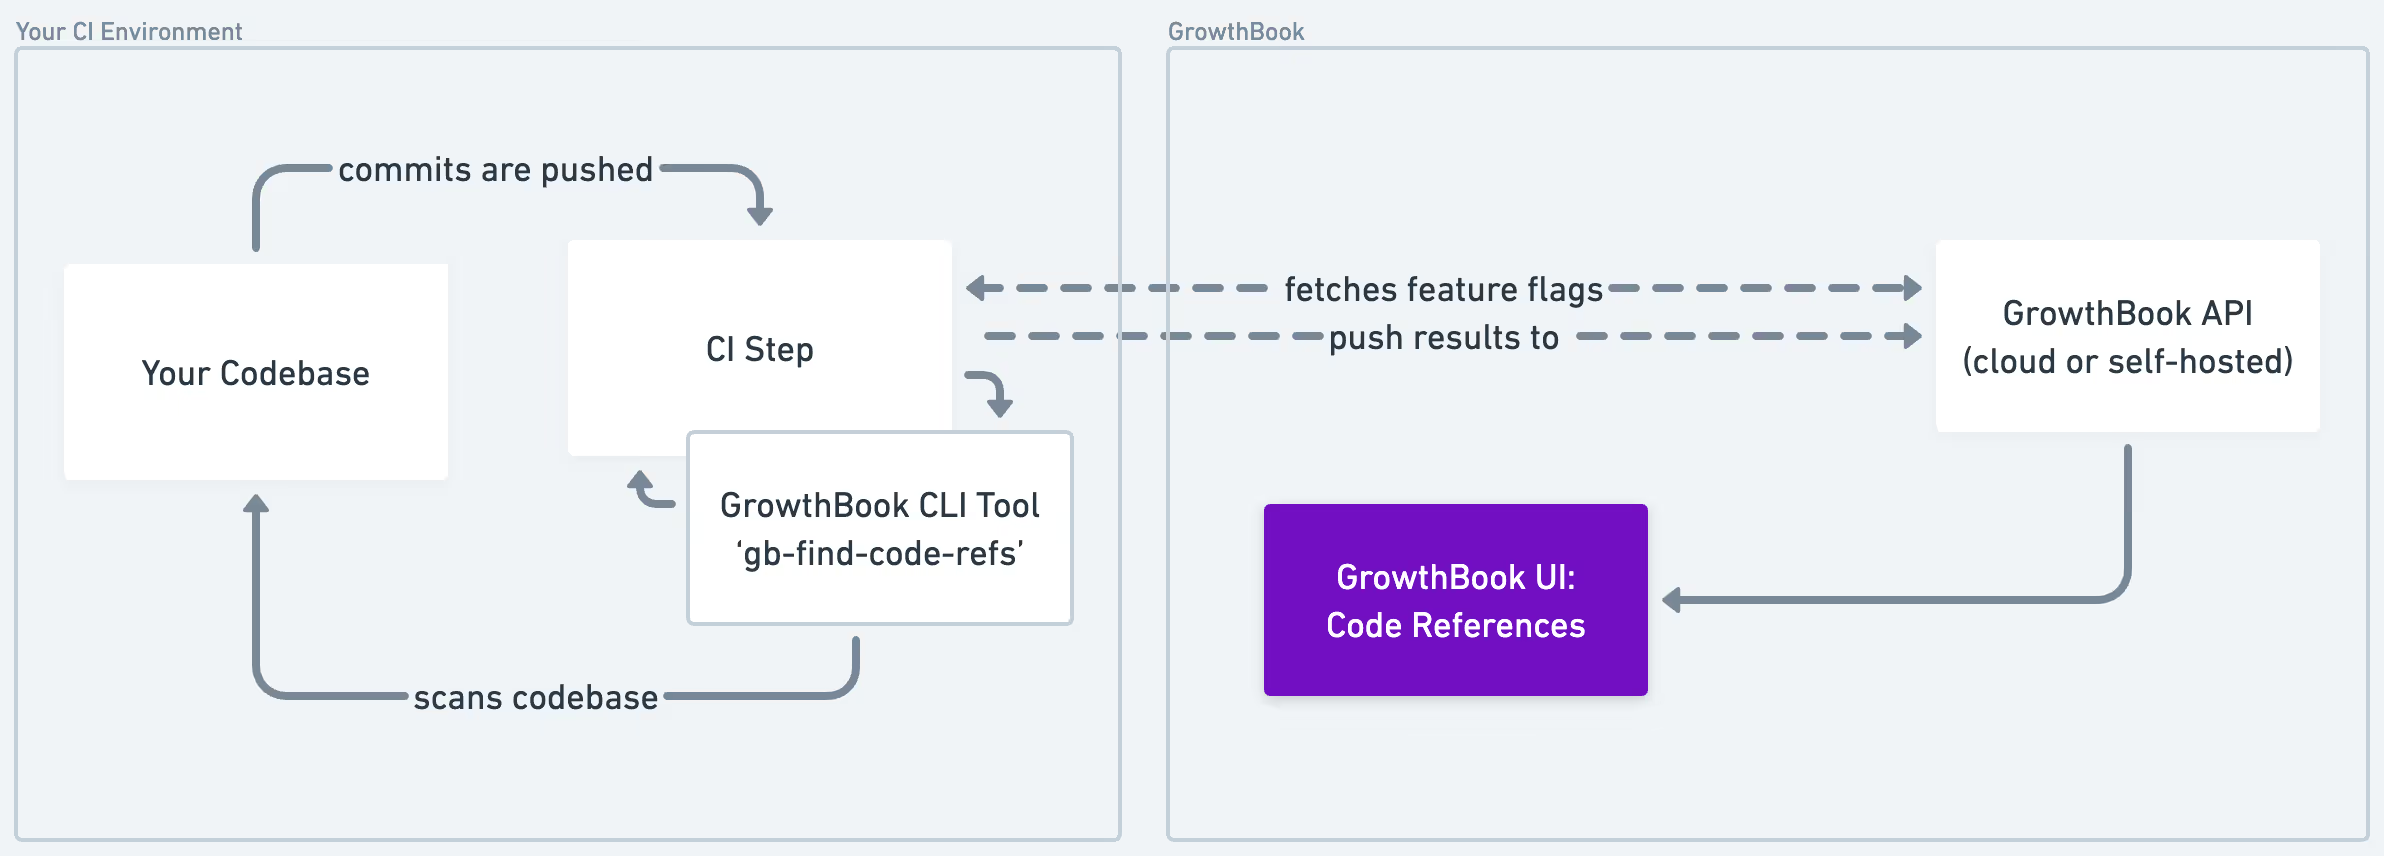
Getting started
To support Code References, we provide a streamlined, all-in-one GitHub Action that integrates easily with your existing GitHub workflow. For non-GitHub users, we provide all the tooling you'll need to set it up yourself.
-See the Getting Started section in our documentation for more information.
Conclusion
The significance of Code References underscores a broader goal of more sustainable and efficient development practices, focusing not just on introducing new features but also on the long-term health and scalability of the software.
For companies seeking to maintain a competitive edge in software development, adopting tools like Code References is essential. We hope you find Code References in GrowthBook a powerful tool in your toolkit for managing feature flags efficiently and effectively.

GrowthBook version 2.8
We’re excited to announce the release of GrowthBook 2.8, with many highly requested features, including Prerequisite Flags, Code References, and a new “No Access” role. Full details are below.
Prerequisite flags

With Prerequisites, you can group together related feature flags and describe complex relationships between them. For example, you can have a bunch of features that all reference a `release-2.8` parent flag as a prerequisite. The child features will only be enabled when the parent flag evaluates to `true`.
Prerequisites can also be defined at the individual rule or experiment level. For example, only include users in your experiment who are getting assigned `b` of a separate `pricing-page-version` feature flag.
Top-level Prerequisites are available to all Pro and Enterprise customers. Rule-level and Experiment-level Prerequisites are only available to Enterprise customers. Simple cases where the prerequisite is deterministic (e.g., always true or always false) work in all SDKs with no configuration required. Advanced cases (e.g., prerequisite’s value depends on an experiment) are currently only supported in the latest JavaScript and React SDK versions. Read more about this in our docs.
Feature code references

Back in GrowthBook 2.6, we added stale feature flag detection. Now, with Code Refs, we’re making that more actionable by showing you exactly where a feature is used in your application’s codebase.
Setup is easy — Just add a new job to your application’s CI pipeline that runs whenever code is pushed. This CI job fetches a list of feature flags from the GrowthBook REST API, scans your codebase for references, and sends the line numbers and surrounding code back to GrowthBook so it can be displayed in the UI.
If you use GitHub Actions, we provide a pre-built action you can install. We don’t have official integrations for other CI platforms at this time, but we have published a low-level CLI script and Docker image you can use to integrate manually. Code References are available to all Pro and Enterprise customers.
Official (version controlled) metrics

It’s not uncommon for large organizations to have hundreds or thousands of experimentation metrics. These are often a mix of “Official” metrics (widely used and vetted by the data team) and Ad-Hoc metrics (one-off, created by a product team, etc.). GrowthBook 2.8 introduces a brand new workflow that can make this distinction clearer and lead to more trustworthy experimentation.
In a nutshell, you can now store your Official Metric definitions as code in a version control system like GitHub, and changes can be automatically synced to your GrowthBook account. These Official Metrics are marked with a special badge and cannot be edited from within the GrowthBook UI. Whenever you see the Official badge, you can be confident that the definitions have gone through your version control and review process.
Check out our tutorial for storing Official Metrics in GitHub.
“No access” role
In previous versions, the lowest role you could grant someone in your GrowthBook account was “read-only”. This meant that every user you invited to your organization could, at the very least, see every feature flag, experiment, and other settings in your account.
GrowthBook 2.8 introduces a new role called “No Access”. As the name suggests, this is even lower than “readonly” and essentially grants no permissions whatsoever. When combined with project-scoped roles, this becomes super powerful. For example, grant someone the global “No Access” role, then override it with a more permissive role for specific projects. That user would not even be able to see the projects they don’t explicitly have access to, and all of the associated feature flags, experiments, etc. would be hidden from them.
This new role is available to all Enterprise customers. You can read more about this in our docs.
Webhooks for SDK connections
Every SDK Connection in GrowthBook gets a dedicated API endpoint that returns a JSON payload of all included feature flags and experiments. You can now attach Webhooks to an SDK Connection to be alerted whenever this payload changes. For example, if you have a caching layer in front of GrowthBook, you can use a Webhook to invalidate your cache, resulting in faster feature releases to your users.
Other improvements
- New guide on integrating GrowthBook with WordPress sites — view it here
- Metric lookback windows
- Option to ignore zeros in percentile capping
- JumpCloud SSO support
- Plus, more than 50 documentation and bug fixes!

Changing running experiments safely and flexibly in GrowthBook
Running experiments can be a messy business, and you often want to make changes mid-experiment.
Making changes to running experiments in GrowthBook 2.7 is:
- Safer than ever. With guided flows that ensure you don’t introduce bias when changing targeting or traffic rules, you are able to pick the least disruptive deployment strategy for your changes.
- More flexible than ever. Sticky bucketing allows you to preserve user experience when making certain kinds of changes.
This article walks you through three kinds of changes you can make in GrowthBook, how our UI helps you navigate them, and how sticky bucketing can help you make changes safely.
Decreasing traffic to an experiment
In some cases, you may wish to decrease traffic to an experiment, either because you have enough users and want to ramp down new enrollment, or you want to begin restricting your experiment to some subset of users using more restrictive targeting attributes.
Imagine you add a targeting attribute to only target US-based users for your experiment. If you simply make the change and push it live, your experiment analysis will include users from before you pushed the change, who are no longer eligible for the experiment. They will still be in your experimental sample, which means their behavior may be affecting your experiment results, but they’ll no longer be receiving the same feature values as before since they are now excluded by the new targeting rules.
In this case, you have three options:
- New phase, re-randomize users. This ensures your analysis is accurate, but it throws away your existing data and may change users’ experiences.
- Same phase, apply changes to everyone. This lets you leverage existing data, with the understanding that some users may be in your experimental data but are no longer receiving the new experiment feature, thereby biasing your results.
- In GrowthBook 2.7, we have added sticky bucketing, which, if enabled for your org, provides you with a third option: Same Phase, apply changes to new traffic only. This lets you (a) keep all of your data in your analysis, (b) ensure users do not change their originally assigned variation, and (c) avoid suffering any bias as users in each variation will continue receiving those feature values.
Increasing traffic to an experiment
Increasing traffic to an experiment is less problematic. You can safely make any of the following changes without starting a new phase:
- Increasing the percent of traffic to an experiment
- Removing restrictive targeting (i.e. making targeting more permissive)
- Removing an experiment from a Namespace

Restarting an experiment, or starting a new phase
Sometimes, we need to start an experiment over and throw away our old data, either due to a bug in implementation, a change in experiment design, or if we want to restart an A/A test to make sure that some imbalance was due to chance and not due to an issue with your GrowthBook implementation.
In these cases, starting a new phase of the experiment will require that you re-randomize in order to avoid carry over bias.
As with other changes, we provide this information directly in the app to ensure you can make fully informed choices.

Feel free to check our docs on sticky bucketing or making changes to running experiments for more detail.

New GrowthBook version 2.7
Sticky bucketing, reusable targeting conditions, experiment health tab, fact table optimizations, and more!
Happy New Year, everyone! We’re back at it with the release of GrowthBook 2.7. This version features sticky bucketing, reusable targeting conditions, an experiment health page, and more. Full details are below.
Sticky bucketing
When running an experiment, you want to ensure users are not exposed to multiple variants (e.g., a single user seeing both A and B at different times). GrowthBook accomplishes this by using deterministic hashing, which works great most of the time. However, there are certain scenarios where this can break down. For example, if your experiment targets only German visitors, a user could switch from seeing variation B to A if they take a train to France.
Sticky Bucketing allows you to remember the first variation a user sees, so their experience remains consistent, even if something changes that would otherwise reassign them. This behavior is opt-in and is currently supported only in the latest versions of our JavaScript and React SDKs. Read more in our Sticky Bucketing Docs.
Reusable targeting conditions

We’ve expanded Saved Groups to support more advanced use cases. Instead of just a list of IDs, you can now create Condition Groups with arbitrarily complex targeting rules (e.g., UK Chrome users with a Pro subscription). Just like existing Saved Groups, these can be reused across multiple features and experiments, and updating the group will immediately update everywhere it is referenced. You can read more about this in our completely revamped Targeting Docs.
Fact table query optimization
It’s common for an experiment to have multiple metrics coming from the same underlying database table — for example, Revenue per User and Orders per User, both driven by a Purchases table. In this latest release, we’re leveraging this relationship to drastically reduce the number of queries we need to run. For data warehouses with usage-based billing, such as BigQuery or Snowflake, this can lead to significant cost savings.
This optimization is available only to Enterprise customers using the new Fact Tables to define their metrics. Read more about this on our Blog.
Experiment health tab
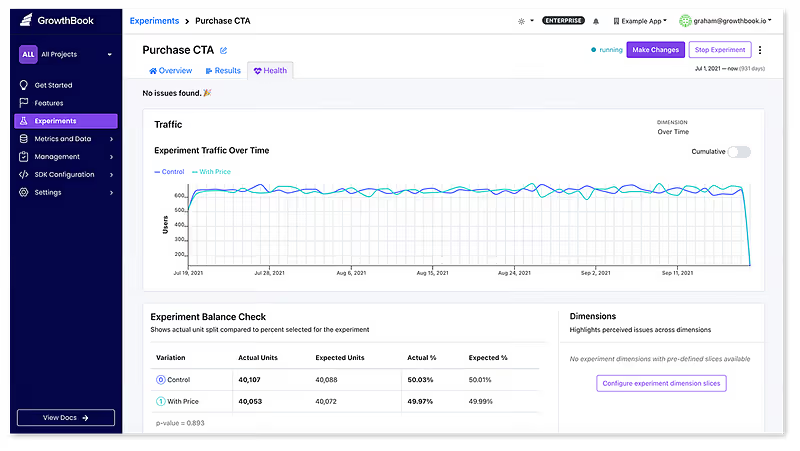
GrowthBook has always run data quality checks on your experiments to detect issues such as Sample Ratio Mismatch (SRM) and multiple exposures. In this latest release, these checks live under a new dedicated “Health” tab.
In addition, you can now pick a set of dimensions that will be checked automatically for every experiment you run. For example, if you pick a “browser” dimension, you will be able to easily detect SRM errors that only affect Safari. Read more on our Health Tab Docs.
Safely update live experiments

Changing a live experiment mid-flight is much more complicated than many people realize. If you aren’t careful, it can lead to carryover bias, SRM errors, or add significant noise to your results.
The safest approach is to basically start over — begin a new experiment phase, throw away the old data, and completely re-randomize all of your users. However, on lower-traffic sites, this can be prohibitively expensive.
Now, there’s a brand new “Make Changes” button at the top of running experiments. It will guide you through the process and recommend a safe release strategy that preserves past data whenever it’s safe to do so. If you choose a different release strategy, we will give you detailed warnings outlining the risks so you can make an informed decision.
This new flow is available to everyone, but Pro and Enterprise users also have access to additional release strategies powered by Sticky Bucketing (see above). Read more about this and see more examples on our Blog.
New best practices guide

There is a new section in our documentation that includes guides on experimentation in general, as well as chapters on how to get the most out of GrowthBook. Among other things, it covers how to organize your account with projects and tags, how to understand and interpret experimental results, and checklists to ensure your self-hosted GrowthBook deployment is secure. You can find the guide here.
Contextual AI bot

We’ve added an AI bot trained on GrowthBook's content and systems that can provide detailed answers to any questions you may have. You can try it out from the documentation site by clicking on the ‘ask AI’ box on the bottom right.
Other improvements
- Validate advanced targeting conditions before saving
- Okta SCIM Improvements
- More information on the compatibility of SDK versions
- Display helpful query stats for BigQuery (bytes scanned, execution time, etc.)
Plus many more changes and bug fixes, which you can read about here: https://github.com/growthbook/growthbook/releases

Fact table query optimization
Back in October 2023, GrowthBook 2.5 added support for Fact Tables. This allowed you to write SQL once and reuse it for many related metrics. For example, an Orders fact table is being used for Revenue, Average Order Value, and Purchase Rate metrics.
However, behind-the-scenes, we were still treating these as independent metrics. We weren't taking advantage of the fact that they shared a common SQL definition.
With the release of GrowthBook 2.7 in January 2024, we added some huge SQL performance optimizations for our Enterprise customers to better take advantage of this shared nature. Read on for a deep dive on how we did this and the resulting gains we achieved.
Understanding experiment queries
The SQL that GrowthBook generates to analyze experiment results is complex, often exceeding 10 sub-queries (CTEs) and 200 lines total. Here's a simplified view of some of the steps involved:
- Get all users who were exposed to the experiment and which variation they saw
- Roughly filter the raw metric table (e.g., by the experiment date range)
- Join [1] and [2] to get all valid metric conversions we should include
- Aggregate [3] on a per-user level
- Aggregate [4] on a per-variation level
An important thing to note is that these queries are metric-specific. If you add 10 metrics to an experiment, we would generate and run 10 unique SQL queries.
Abstracting out the common parts
The queries above can be expensive, especially for companies with huge amounts of data. Reducing duplicate work can yield significant savings, especially for usage-based data warehouses like BigQuery or Snowflake.
It's pretty clear that step 1 above will always be identical for every metric in an experiment, whether or not they share the same Fact Table. That's why in GrowthBook 2.5, we released Pipeline Mode to take advantage of this by running that part of the query once and creating an optimized temp table that subsequent metric queries could use.
Now that we have Fact Tables, we can take this optimization even further. If multiple metrics from the same Fact Table are added to an experiment, it's pretty easy to see that step 2 will be the same*. What's not so obvious is that with a little tweaking, the remaining steps (3-5) can also become largely identical, paving the way for significant performance gains. We don't need temp tables; we can just run a single query that operates over multiple metrics at the same time.
Filters
I said above that step 2 (roughly filtering metrics) would be the same for all metrics in a fact table. This isn't 100% true because of Filters. We let you add arbitrary WHERE clauses to a metric to limit the rows that it includes. This lets you, for example, define both a Revenue and a Revenue from orders over $50 metric using the same Fact Table.
Filters are super powerful, but can pose a problem when combining metrics into a single query. If two metrics have different filters, we can't use a WHERE clause to filter because it will apply to both metrics.
The solution turns out to be easy - the all-powerful CASE WHEN statements. This lets each metric have its own mini WHERE clause without interfering with any other ones.
SELECT
  amount as revenue,
  (CASE WHEN amount > 50 THEN amount ELSE NULL END) as revenue_over_50
FROM orders
Combining metrics
This is a simplified view of the data at step 3, when we join the experiment data (variation) with the metric data (timestamp/value) based on userId.
Notice how each event has its own row (UserId 123 purchased twice and has 2 rows). To support multiple metrics, we can't have a single value column anymore. We need each metric to have its own column. We can just prefix these with the metric number. m0_value, m1_value, etc.. m0 might represent the revenue, m1 might represent the number of items in the order.
We do the same thing in step 4, aggregating by userId. The structure is identical; there will just be one single row per userId, and we will sum each prefixed value column.
SELECT
  userId,
  variation,
  SUM(m0_value) as m0_value,
  SUM(m1_value) as m1_value
FROM
  step_3
GROUP BY userId, variation
Step 5, aggregating by variation, is similar, but a single number per metric is no longer enough. We need multiple data points to calculate standard deviations and other more advanced stats. So we end up with something like this:
SELECT
  variation,
  COUNT(*) as users,
  -- Multiple prefixed columns for each metric
  SUM(m0_value) as m0_sum,
  SUM(POWER(m0_value, 2)) as m0_sum_squares,
  ...
FROM
  step_4
GROUP BY variation
Pulling them apart again
The results we get back from the data warehouse can be very wide, with potentially hundreds of columns (each metric needs between 3 and 10 columns, and there could be dozens in an experiment).
Our Python stats engine was written to process one metric at a time, so to avoid a massive refactor, we simply split this wide table back into many smaller datasets before processing. For example, to process m1, we would close the dataset, remove all of the m0_, m2_, etc. columns, and rewrite the m1_ column names to remove the prefix. Now the result looks 100% identical to how it was before this optimization.
Ratio metrics, CUPED, and more
All of the examples above show the simplest case. Combining metrics is even more powerful for advanced use cases.
Ratio metrics let you divide two other metrics, for example, Average Order Value (revenue/orders). Previously, we would have to select 2 metric tables, one for the numerator and one for the denominator, and join them together, which could get really expensive. Now, if both the numerator and denominator are in the same Fact Table, we can avoid this costly extra join entirely, making the query significantly faster and cheaper.
CUPED is an advanced variance reduction technique for experimentation. It involves looking at user behavior before they saw your experiment and using it to control for variance during the experiment. This makes metric queries more expensive since they now have to scan a wider date range. Because of this, users had to be really judicious about which metrics they enabled CUPED for. Now, since that expensive part of the query is shared across multiple metrics, it becomes feasible to run CUPED for everything without worrying about performance costs.
The story is similar for other advanced techniques, such as percentile capping (winsorization), time-series analyses, and dimension drill-downs.
The gains
So, was all of this work worth it? Absolutely.
BigQuery is the most popular data warehouse for our customers. BigQuery charges based on the amount of data scanned and compute used, so any performance improvements translates directly to cost savings for our users.
For a large company adding 100 metrics to an experiment, it's not uncommon for those to be split between only 5-10 fact tables, lets say 10 to be conservative.
Selecting additional columns from the same source table is effectively free from a performance point of view, so going from 100 narrow queries to 10 wide ones is a 90% cost reduction! When you factor in the savings from Ratio Metrics and CUPED, it's not unheard of to see an additional 2X cost decrease!
We're super excited about these cost savings for our users. The biggest determinant of success with experimentation is velocity - the more experiments you run, the more wins you will get. So anything we can do to reduce the cost and barrier of running more tests is well worth the investment.

Stale feature flag detection
Feature flags are a fantastic way to reduce risk during deployments, but they can also be a source of technical debt. It’s common for engineers to forget to clean up feature flags from the code that aren’t being used anymore.
To help solve this problem, GrowthBook now alerts you when we detect a "stale" feature flag. These stale flags are good candidates for removal from your code, reducing your technical debt.
It’s common for engineers to forget to clean up feature flags from the code that aren’t being used anymore, especially when teams are focused on scaling feature flags.

We define a "stale" feature flag as one that has not been updated in the past two weeks and serves the same value to all users - that means there are no active experiments or force rules.
This detection isn't perfect. There are times when a long-lived feature flag makes sense - for example, a kill switch for when a 3rd party provider has an outage. For these features, you can easily dismiss the stale notification by clicking on the icon.

We have a lot more planned in the future to help you stay on top of your technical debt - everything from integrating with GitHub Code References to detecting actual realtime usage from our SDKs. Stay tuned and let us know your thoughts!
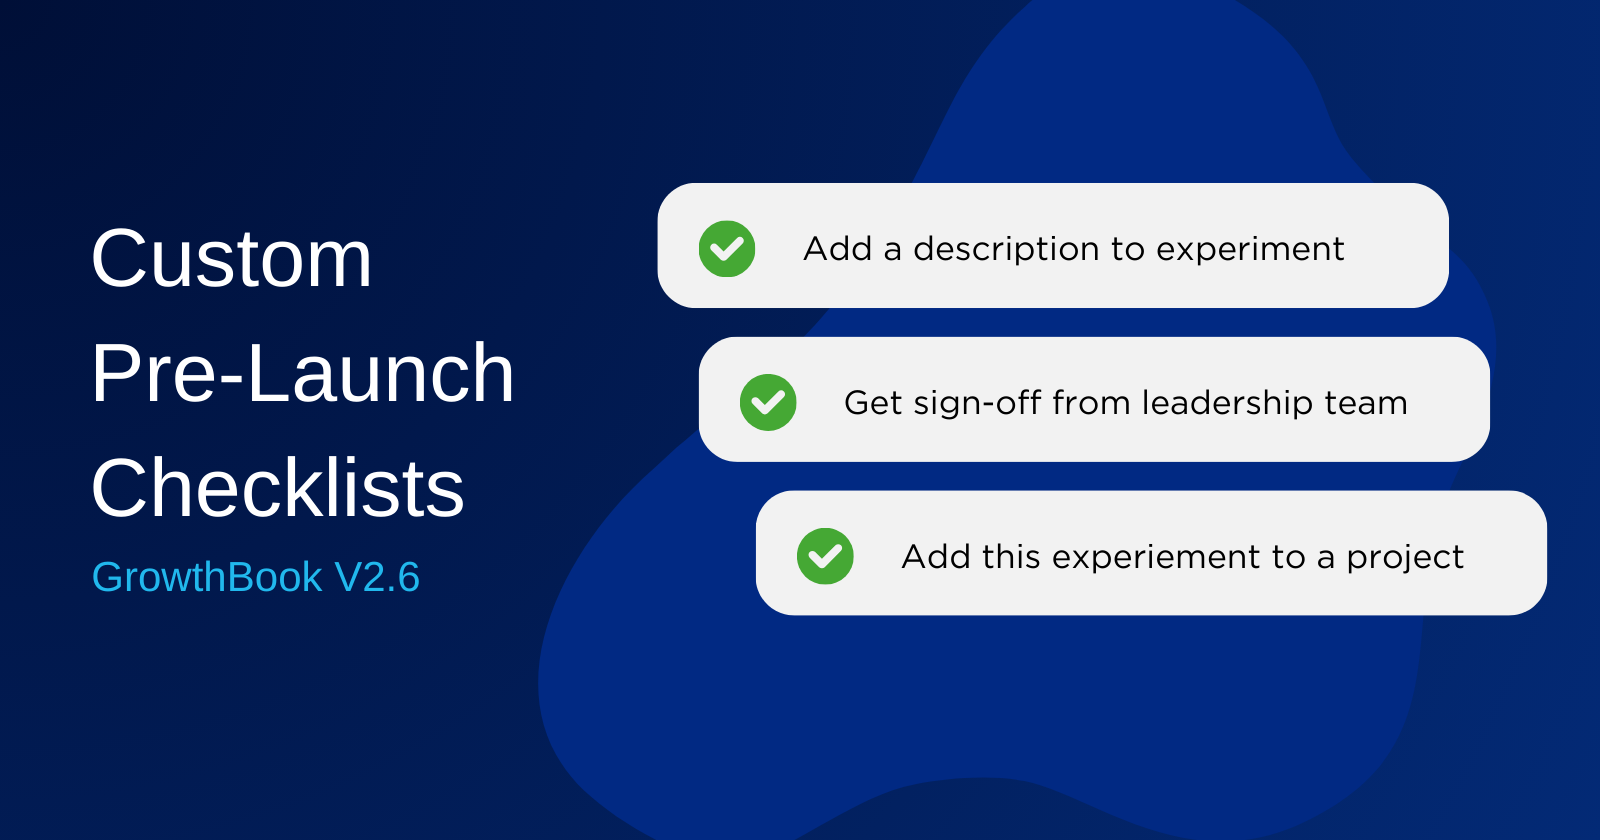
Boost confidence in experiment launches with GrowthBook's pre-launch checklists
At GrowthBook, our mission has always been to empower organizations to optimize their online experiments seamlessly. We are thrilled to announce our latest Feature-Customizable Pre-Launch Checklists.
Experimentation is at the heart of progress, but launching an experiment involves meticulous preparation and attention to detail. To streamline this process and ensure a smoother launch experience, we've introduced customizable checklists. Now, organizations leveraging GrowthBook's Enterprise Plan for their online experiments can tailor their pre-launch requirements precisely to their needs.

Why customizable checklists matter
Launching an experiment isn't just about hitting the "Go" button. It's about confidence, precision, and ensuring that every aspect is in place for a successful rollout. With our new feature, organizations can choose from a range of pre-defined checklist options, such as requiring screenshots for each variation or mandating an experiment hypothesis.
But that's not all. We understand that each organization has its unique set of protocols and requirements. That's why GrowthBook now allows you to define your own checklist items. Need to alert the support team before an experiment goes live? No problem. Want to ensure that specific accessibility standards are met? You got it. The power is in your hands to create a tailored checklist that aligns with your processes.

Enhanced confidence in experiment launches
Launching an experiment can be nerve-wracking, especially when multiple stakeholders are involved. The customizable pre-launch checklist feature is designed to instill confidence. It acts as a safety net, ensuring that all necessary steps are completed before an experiment sees the light of day.
By providing this level of customization, GrowthBook aims to empower teams, mitigate risks, and ultimately drive more successful experiments. With a checklist that reflects your organization's unique requirements, you can proceed with the certainty that everything is in place for a successful experiment launch.
Getting started

Customizing your pre-launch checklist in GrowthBook is easy. Simply navigate to your organization's Experiment Settings by selecting Settings > General from the Sidebar and scrolling down to Experiment Settings. Updating the checklist will affect any experiment that isn't already live.
When it comes time to launch an experiment, we'll calculate the completion of any pre-defined checklist option automatically, and give you an opportunity to manually complete any items we can't calculate automatically. All manually checked items are logged and available in your in-app audit log.
Ready to level up your experiment launches?
Experience the difference by trying out the customizable pre-launch checklist today.
Stay tuned for more updates as we continue to evolve and innovate to support your experimentation journey.

GrowthBook version 2.6
We’re back from Thanksgiving with a new version of GrowthBook! Version 2.6 contains many highly requested features and improvements and results from a lot of hard work from the team and community. Check out some of the highlights below.
Custom pre-launch checklists for experiments
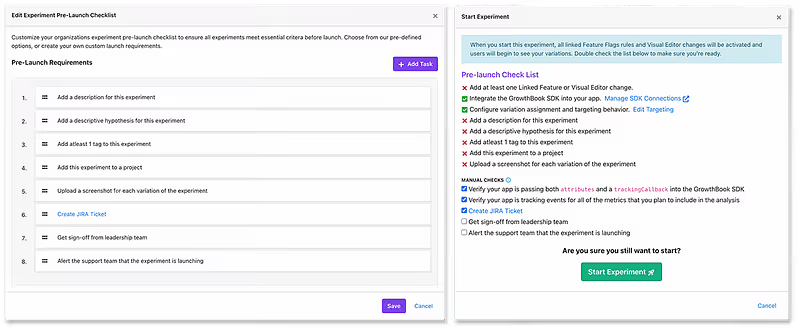
Top experimentation teams empower everyone at their company to design and launch their own A/B tests. Removing a centralized bottleneck is great for velocity, but also tends to lower the overall quality of the experiments. With our new Customizable Pre-launch Checklists, you can now enforce your organization’s best practices around experiment design without slowing things down. There are a number of predefined options, such as requiring a hypothesis or screenshots, as well as the ability to add your own custom ones, such as creating a Jira ticket or alerting the support team. This feature is available to our Enterprise customers, and you can read more about it on our blog: https://blog.growthbook.io/custom-prelaunch-checklists
Saved groups improvements
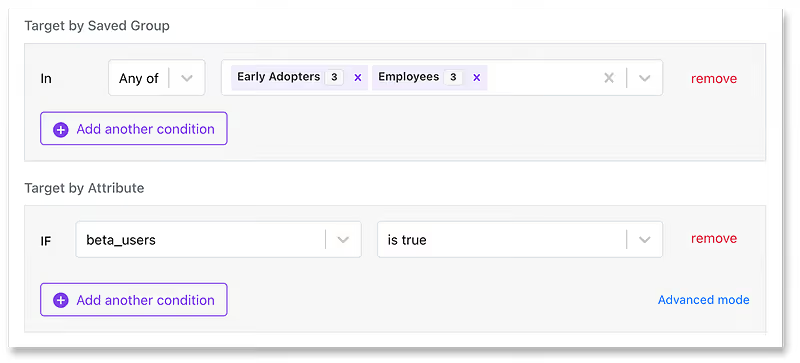
We’ve completely revamped Saved Groups and made them a first-class citizen for targeting feature flags and experiments to your users. In addition to Inline Groups, where a list of ids is added directly in the GrowthBook UI, there is now support for a new type — Runtime Groups, where group membership is determined within your application and passed into the GrowthBook SDK at runtime. We have much more planned for Saved Groups in the future, so stay tuned! You can read about the new improvements in our docs: https://docs.growthbook.io/features/targeting#saved-groups
Teams

You can now organize your GrowthBook users into teams, each with its own set of permissions! When combined with projects, this gives Enterprises a really powerful way to manage their organization at scale. Teams are also fully integrated into our SSO and SCIM offerings so they can easily be synced from Okta, with more Identity Providers coming soon. Read more about teams in our docs: https://docs.growthbook.io/account/user-permissions#teams
Stale feature flag detection
Feature flags are a fantastic way to reduce risk during deployments, but they can also be a source of technical debt. It’s common for engineers to forget to remove feature flags from code that aren’t being used anymore. In this release, we added basic stale feature flag detection to help address this problem. There is a new “Stale” column on the Features page that will highlight features we think are good candidates for cleanup (with a reason that appears on hover). Read more about this feature and our future plans on our blog: https://blog.growthbook.io/stale-feature-flag-detection
Easier installation on low-code platforms

For users of low-code platforms like Shopify or Webflow, you can now drop a single script tag on your site and launch your first experiment within minutes using our Visual Editor. This pre-bundled script tag handles everything for you automatically — it stores a unique anonymous cookie ID for the user, sets helpful targeting attributes such as deviceType and UTM params, and sends events to Segment.io and GA4/DataLayer when available. View our dedicated guides for Shopify and Webflow for more info.
Other improvements
- Feature Flag Drafts Refactor
- SDK Connections now support multiple projects
- Visual Editor improvements
- View absolute and scaled impact on experiment results
- Tons of bug fixes and smaller improvements
Plus many more changes and bug fixes, which you can read about here: https://github.com/growthbook/growthbook/releases
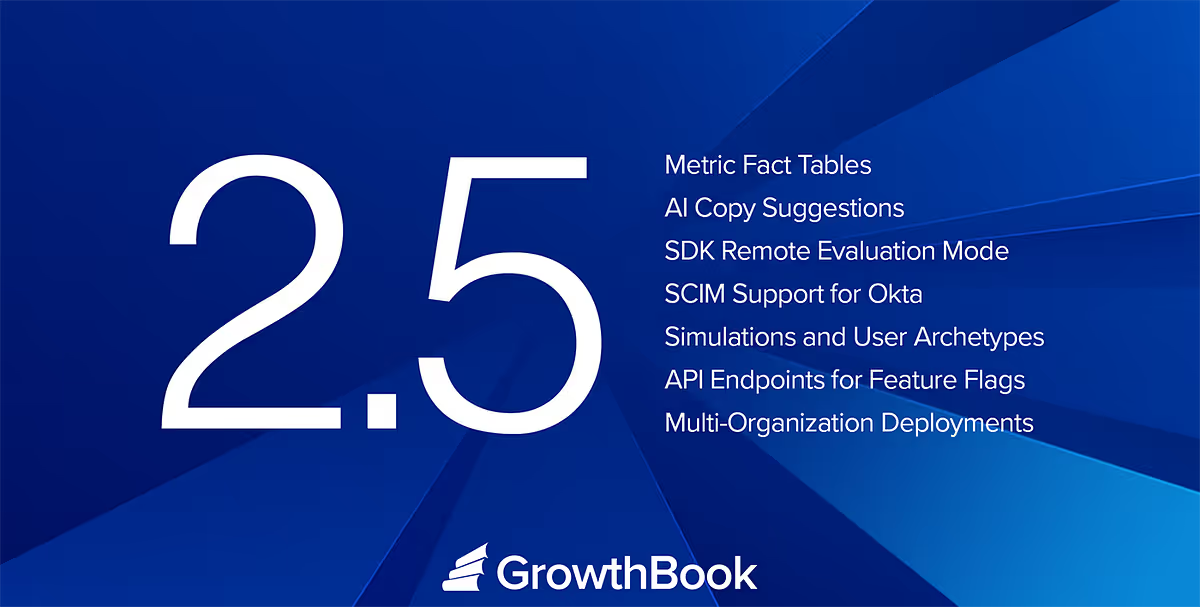
Announcing GrowthBook 2.5
GrowthBook 2.5 may be our biggest release to date! This packed release includes metric fact table support, SCIM integration for Okta, remote evaluations for JavaScript/React SDKs, data pipelining mode for Snowflake and BigQuery, AI copy suggestions in the visual editor, and more. See the full list below.
This release reflects a ton of hard work from our team and the community and we could not be more excited to hear what you think. Our primary focus is building the best feature flagging and A/B testing platform that allows companies to adopt and scale an experimentation-driven software development process.
Metric Fact Tables

Fact Tables are a brand new way to create Metrics in GrowthBook. Every analytics event usually results in several very similar metrics. For example, when an order is placed, you may want to know how many people ordered, how much they spent, what percent of orders used a coupon code, and more. With Fact Tables, you define the SQL for getting order data once and can quickly create tons of metrics on top of this without writing any code.
We have a lot planned for Fact Tables in the near future, including some massive SQL performance/cost improvements and the ability to easily add dimension slices for metrics. Stay tuned!
SDK remote evaluation mode

When we first built the client-side GrowthBook SDKs, we took a radically different approach from other feature flagging tools — all evaluations happened locally on a user’s device. This had huge performance benefits (extremely cacheable) and much better data privacy (no user PII sent to 3rd parties). There is a downside, though — your users can see all the business logic and experiments that you’re using to assign feature flag values.
With this release, we’re adding a new Remote Eval option to our JavaScript and React SDKs where feature evaluation happens on a back-end server and your users only see their own personalized result. The most exciting part is that we found a way to preserve many of the benefits of local evaluation! Evaluation happens entirely on your infrastructure, so you can still have amazing performance and privacy. We’ll be adding support to mobile SDKs soon and adding more deployment options.
SCIM support for Okta

SCIM, or System for Cross-domain Identity Management, is an open standard that allows for the automation of user provisioning. Any of our Enterprise customers using Okta for SSO can now add and remove users from GrowthBook directly from within the Okta UI. Support for other identity providers is coming soon.
Data pipeline mode
We added a new option for BigQuery and Snowflake to enable Data Pipeline Mode. In this mode, GrowthBook will write some intermediate tables back to your data warehouse while analyzing experiment results. This can drastically reduce the query cost, especially for teams that run a lot of experiments, each one with tens or hundreds of metrics. We’re adding support for other data warehouses soon.
AI copy suggestions

Enhance your written content using GPT-powered AI. Transform human-readable text into any desired emotion effortlessly. Our visual editor just got better with the inclusion of AI powered copy suggestions. Simply click on any text element, and then have the AI suggest alternative copy. Give it a try, you might be surprised with some of the improvements it suggests!
Simulations and user archetypes

When setting up feature flag values, it is helpful to know that you’ve set up the rules correctly for the users you’re targeting. With Simulations, you can now easily see how rules will be applied to users by setting the attributes. We will also show debug information about why each rule is used or skipped. And, as many teams have specific sets of users they often target features to, you can now save sets of attributes as an ‘Archetype’ to quickly see what values they will get.

Feature flag rule testing is free for everyone, while Archetypes are available to our enterprise customers.
API endpoints for feature flags
We’ve added REST endpoints that allow you to create, edit, and toggle feature flags via our API. We’re excited about all of the use cases this unlocks and can’t wait to see what the community builds! You can read more about these endpoints in our API docs: https://docs.growthbook.io/api#tag/features
Multi-organization deployments

GrowthBook has Projects, which let you group together related feature flags and experiments. Companies often use this to give each team or product its own space. Some larger Enterprises need an additional layer to represent their complex business structure, which is why we now offer self-hosted Multi-Organization deployments. Organizations in GrowthBook share a common SSO identity provider, but are otherwise completely isolated from each other. Users in GrowthBook can belong to one or more organizations and can easily toggle between them in the top nav. Along with this change comes a dedicated Super Admin page and REST API endpoints to manage your deployment.
Other changes
- Improved experiment velocity graphs, with the ability to segment by status, results, or projects.

- Experiment search improvements
- Snowflake query tagging for easier cost accounting
- Stats engine selection for experiments
Plus, there are many more changes and bug fixes which you can read about here: https://github.com/growthbook/growthbook/releases

GrowthBook version 2.4
We’re excited to announce the latest release of GrowthBook! Version 2.4 includes significant UI improvements, more powerful feature flag experiments, built-in sample data, a Datadog integration guide, and much more. Here are the highlights:
Redesigned experiment page V2
We continued listening to your feedback and iterating on the experiment page. This release contains a ton of changes, including:
- A new tabbed layout to quickly switch between overview info and the results
- Vertical stacking of results when there are 3+ variations (no more horizontal scrolling!)
- Clear CTAs at the top of the page to start an experiment, ramp up traffic, and make a decision
Feature flags + experiments = better together

We’ve made massive changes behind the scenes to integrate Feature Flags and Experiments better. You can now have multiple Features controlled by a single Experiment, more control over the Experiment lifecycle, and combo experiments that use both Feature Flags and our Visual Editor. This background work will enable much more in the future, so stay tuned!
Datadog tntegration guide

By integrating GrowthBook and Datadog, you can set up custom workflows to automatically toggle Feature Flags based on changes in your Datadog metrics. For example, roll back a release if error rates increase. You can find the guide in our docs, here.
Improved onboarding & built-in sample data
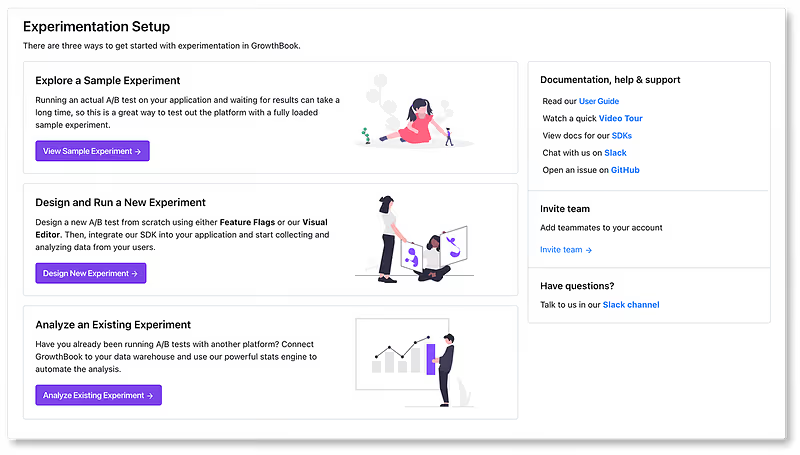
It’s now much quicker and easier to set up a new GrowthBook account from scratch. If you aren’t ready to connect GrowthBook to your application and data yet, there’s a built-in sample dataset that includes metrics, experiments, and feature flags (with an easy cleanup button when you’re done). And once you’re ready to fully integrate GrowthBook, we've streamlined the database connection and SDK integration processes.
Additional features and improvements
- BigQuery performance and cost improvements
- Full Handlebars support for SQL template variables
- Self-hosted Docker image now supports multiple platforms (x86 + arm)
- New documentation organization
- New organization setting to specify a default data source
- Real-time streaming support in the Java SDK
Plus, there are many more changes and bug fixes which you can read about here: https://github.com/growthbook/growthbook/releases

GrowthBook Version 2.3
We are thrilled to announce the launch of our latest GrowthBook version, packed with a host of new features and enhancements! This version includes a redesigned experiment page, automatic metric creation, a new CDN, OpenTelemetry support, and more. Here are some of the highlights in this update:
Redesigned experiment page and left nav
We listened to your feedback and improved the design of the experiment results page and adjusted the structure of the left navigation. The top of the experiment page now gives all the context you need to understand exactly what was tested, including any linked feature flags. This section can also collapse to focus on the results. Check it out, and let us know what you think! We have some more big changes planned for the experiment results section in the next release, so stay tuned!
Automatic metric discovery with Segment, Rudderstack, or GA4
For users of these popular event-tracking tools, we can now automatically detect and create metrics for your tracked events, including all SQL. This feature can be accessed when adding a new data source or by viewing the details of an existing data source. Soon, we will be adding support for additional event trackers, such as Amplitude. Read more about this feature on our engineering blog here.
New cloud CDN with real-time purging and streaming

We migrated our CDN from GrowthBook Cloud to Fastly, resulting in faster response times and greater reliability. This also allowed us to enable instant purges and real-time streaming for everyone. When a feature is published, it is available globally in under one second, and updates are automatically streamed to supported SDKs (JavaScript/React only for now; more will be coming soon).
For self-hosted users, we are working on documentation to help you configure your own CDN to get many of the same benefits.
Percentile capping (Winsorization)
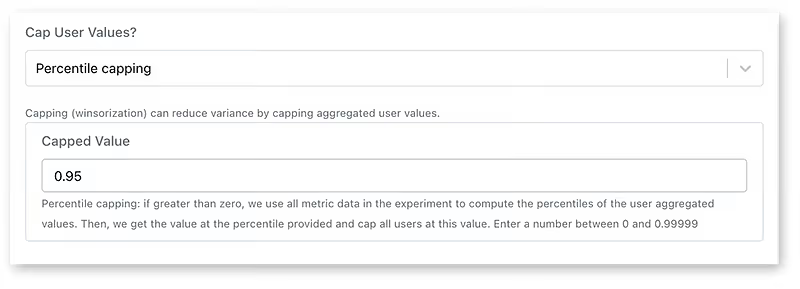
Since the beginning, GrowthBook has supported capping metric values to remove outliers and reduce variance in experiments (also known as Winsorization). Previously, it required custom analysis outside GrowthBook to determine the best capping value to use, but with GrowthBook’s new support of percentiles, this process is now much simpler and less error-prone.
Observability for self-hosted GrowthBook instances (OpenTelemetry)

For our self-hosted users, we have integrated OpenTelemetry into GrowthBook. With this integration, you can easily monitor the health and performance of your GrowthBook instances in production. Learn how to configure this with our instructions in the docs.
Import from LaunchDarkly

Migration from LaunchDarkly to GrowthBook is now easier than ever! Easily transfer features, projects, and environments from LaunchDarkly directly from within GrowthBook from the new “Import Your Data” page in the Settings menu.
Additional features and improvements
- Optional confirmation step for feature kill switches
- New REST API endpoints for metrics and experiments
- SQL performance improvements (up to 40% in some cases!)
- Improved experiment presentations
Plus many more changes and bug fixes, which you can read about here.

New feature: save time with automatic metric generation!
In the fast-paced world of software development, staying ahead of the competition and continuously improving your product is crucial for success. One of the most powerful tools at a software company's disposal is feature flagging and experimentation. These practices allow teams to release new code with confidence, gather valuable data, and make data-driven decisions to optimize key performance indicators (KPIs). However, before an organization can make experimentation a core activity, they need to go through the time-consuming process of building a robust metrics library.
Automatic Metric Generation, a new feature in GrowthBook, jump-starts this process. Teams using Segment, RudderStack, and Google Analytics 4 (GA4) can automatically have tracked events turned into metrics for use in GrowthBook.
How automatic metrics work
Before we hop into exactly how GrowthBook can automatically generate metrics for your organization, we need to outline how GrowthBook works. At its core, GrowthBook handles data a bit differently than other feature flagging and experimentation platforms: instead of organizations sending event data to GrowthBook, GrowthBook operates on a bring-your-own-warehouse model. Meaning, you continue to track your events as normal and connect GrowthBook directly to your data warehouse, and GrowthBook will query it directly via safe, read-only queries.
This not only simplifies your event tracking but also eliminates the need to store tracked events in multiple places, resulting in much lower storage costs.
GrowthBook's warehouse-native structure, paired with the well-documented schemas used by Segment, RudderStack, and GA4, allows us to identify unique events tracked and use those to automatically create metrics.

Example: An organization tracks page_view and purchase events via Segment, which are sent to the events table. GrowthBook can then automatically create two metrics from each event tracked by Segment.
countmetrics: This metric sums the number of each type of event fired per user. For example, how manypage_viewevents did this user have in total?binomialmetrics: This metric counts whether a user fired at least one of these events. For example, was this user someone who fired anypurchaseevents or not?
Automatic Metric Generation is currently only available with GrowthBook Data Sources connected to Segment, RudderStack, and GA4. Additionally, GrowthBook only identifies unique events that your application has tracked in the last 7 days.
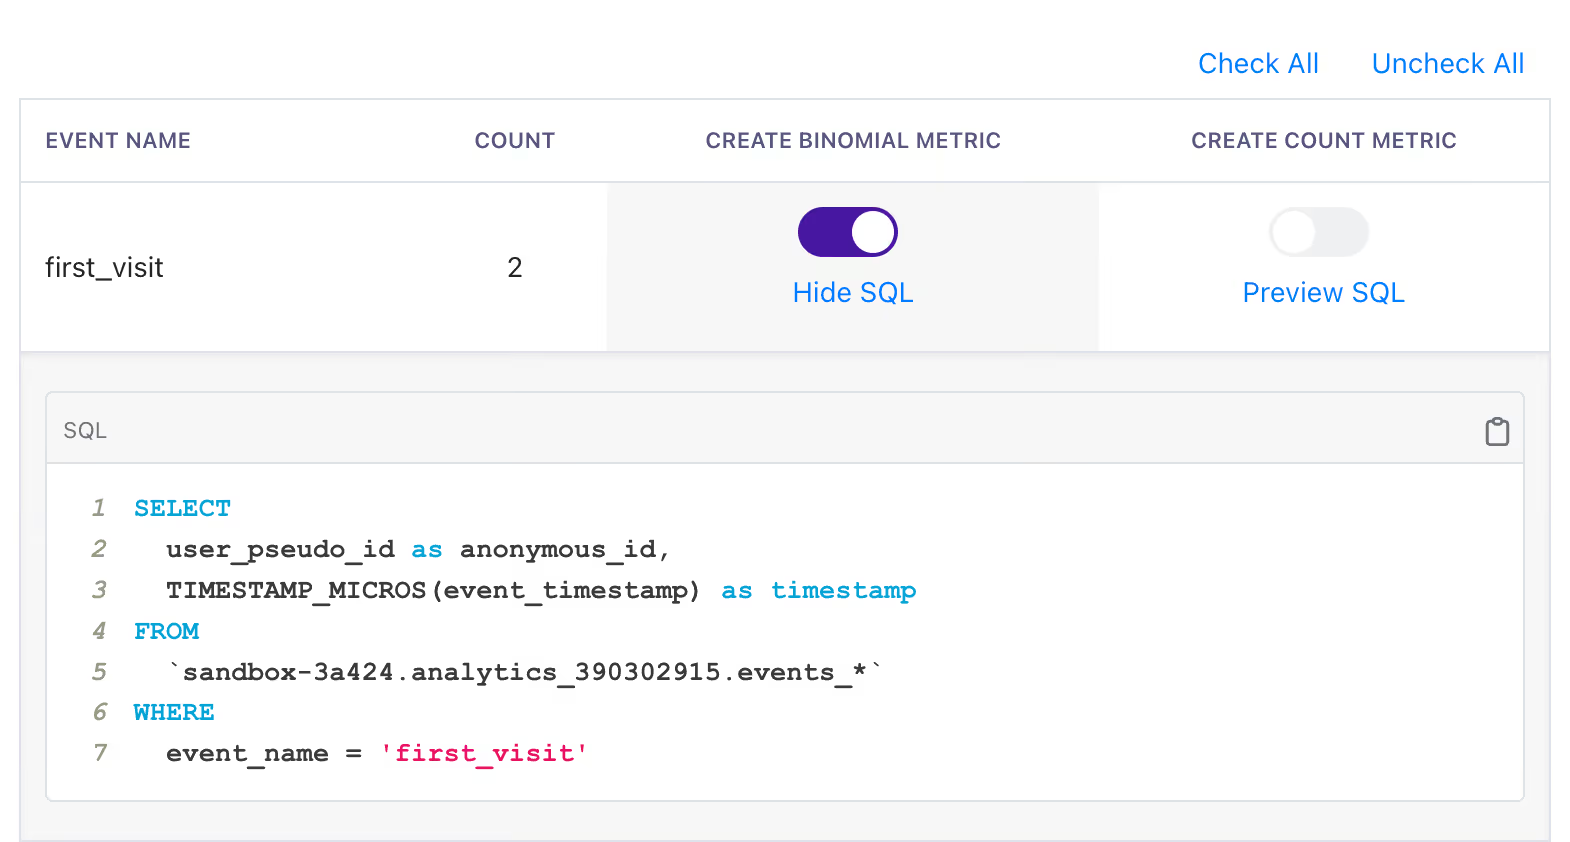
When it comes to metrics, we know that you ultimately know your organization and your users best. So you can always preview the underlying SQL for an automatically generated metric, and once created, you can always edit the SQL just as you would a normal metric. You are also free to create new, more complex metrics yourself!
Give it a try
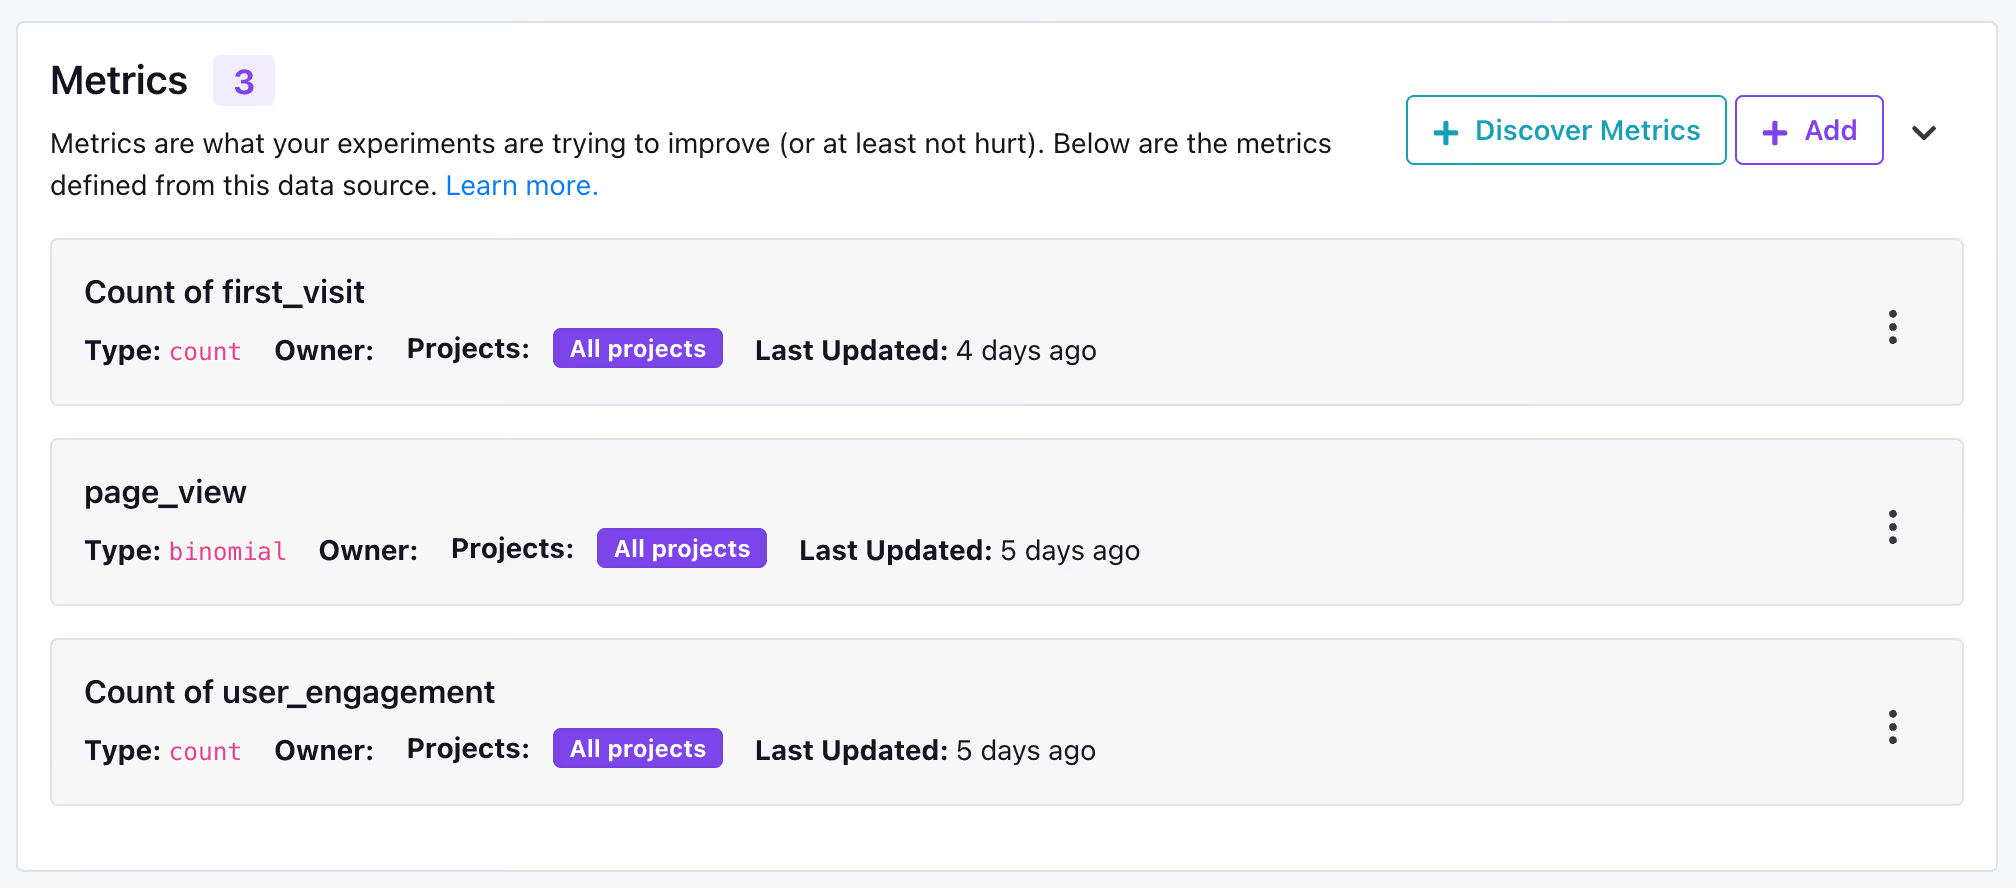
See what metrics GrowthBook can create for your organization in three easy steps.
- Confirm you have a Data Source in GrowthBook that receives events from Segment, RudderStack, or GA4.
- On the Data Source page, click the
Discover Metricsbutton. - Follow the on-screen prompts to preview which metrics can be automatically generated for you.
We are working to expand automatic metrics to additional event trackers and data source types, so keep an eye out for updates.
Join our User Slack if you have any questions.
Not a GrowthBook customer? Try it out, completely free today.
Have an idea to make this better, or another feature of GrowthBook - submit a GitHub issue.
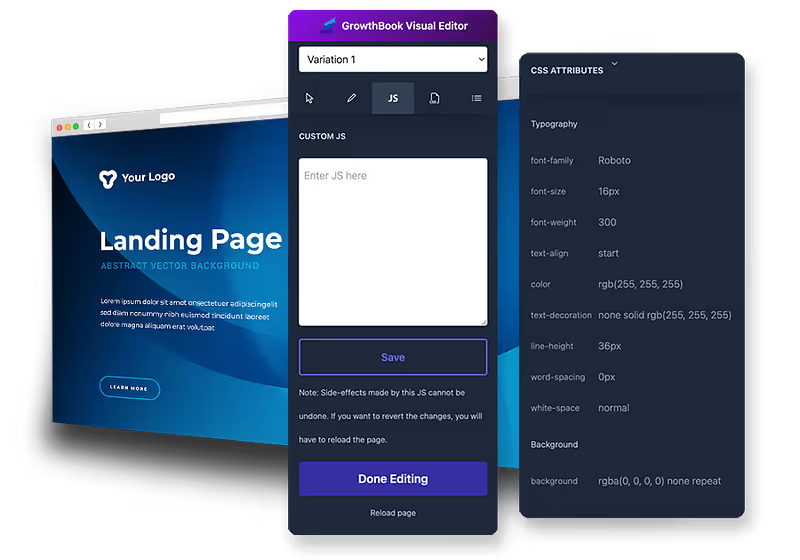
GrowthBook version 2.2
We are pleased to announce the release of version 2.2. This version includes improvements to the Visual Editor, secure feature values, JSON validation, semantic version targeting support, and more. Find out more below.
Visual Editor — JS injection and CSS property editing
This release expands the types of A/B tests you can create with our Visual Editor. You can now run custom JavaScript per variation to make complex changes to the page. Plus, you can now edit CSS properties (font size, color, etc.) for an element directly without needing to manipulate class names.
JSON schema validation

One of the really powerful ways to use GrowthBook is as a remote configuration tool. You can pass down entire JSON objects to your application and make changes without a new deploy. However, typing JSON into a text area can be very error-prone. With version 2.2, you can now attach a JSON Schema to a feature flag to validate every value before saving. This feature is available to Enterprise customers.
Secure targeting attributes
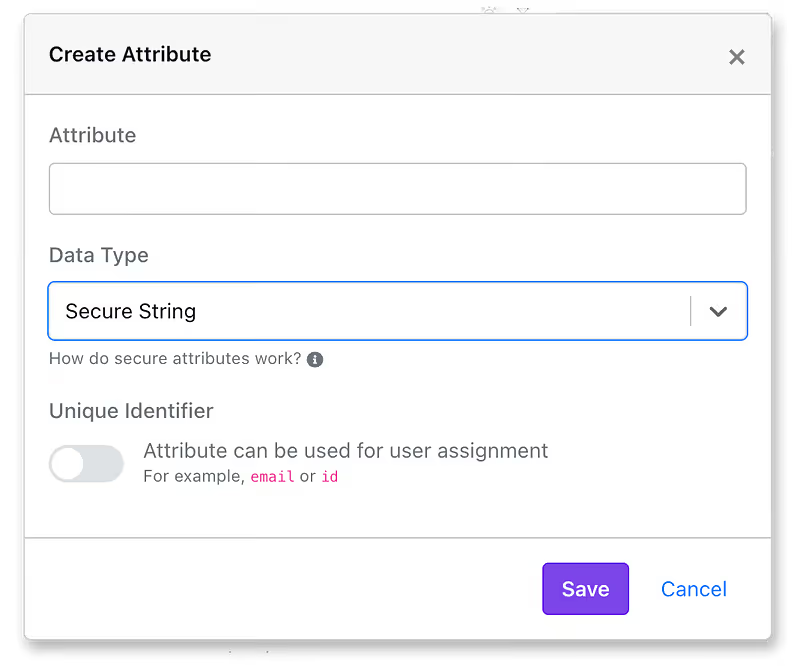
There are times when you want to target feature flags to specific users, but don’t want their IDs or emails exposed in the JSON payload when using our client-side SDKs. You can now mark any attribute as a “secure string,” which will apply SHA256 hashing to the values in targeting conditions before sending the JSON payload to our SDKs. For additional protection, we even allow you to specify a unique salt for your organization. You must enable this feature in your SDK Connections for it to take effect. This feature is available for Pro users.
REST API permissions
As we add more REST endpoints to programmatically interact with your GrowthBook data, there’s been a growing need for more fine-grained permission controls for API tokens. This release adds two new token types to accomplish this.
First, any user can now create their own Personal Access Tokens, which will assume their current role when used. If the user’s role changes in the future (or if they are removed from your organization), their access tokens will be updated immediately to reflect the changes. Personal Access Tokens are accessible from the user drop-down menu.
Second, admins can now create Read-only Tokens on the API Key settings page. These are great for scripts that don’t need write access, such as one that syncs experiment results into your data warehouse. You can now confidently build on top of GrowthBook without the risk of accidentally deleting or modifying something in your account.
Custom currencies
By popular request, we’ve added the ability to adjust the currency shown within GrowthBook for revenue metrics. You can select any global currency from the drop down on the General Settings page.
FullStory integration

Users of FullStory who have set up a data destination to BigQuery or Snowflake can now use that data for metrics and experiment results from within GrowthBook. This event source is in beta and may require some small adjustments.
MongoDB 6.0 support
We updated our internal drivers for MongoDB, so you can now use GrowthBook with the latest MongoDB 6.0.
-As part of this upgrade, we did have to drop support for super old MongoDB versions (version 3.4 and lower). In some rare cases, you may also have to adjust the query string options in your MongoDB Connection URL. See here for more details.
Other features and improvements
- Version string comparison operators in client-side SDKs (semantic versioning)
- Lots of UI and SDK bug fixes
- Tons of new commands in the GrowthBook CLI
Plus many more changes and bug fixes, which you can read about here: https://github.com/growthbook/growthbook/releases

GrowthBook version 2.1
This May we released a new version of GrowthBook. In Version 2.1, we’ve added sequential testing support, multiple testing correction, element reordering in the visual editor, SDK improvements, and more. Read about all the new developments we’ve been up to.
Sequential analysis and multiple testing correction
With experimentation, the more ways you look at a test, the more likely you are to see a significant result when there really isn’t one (a false positive). This is especially an issue for Frequentist statistics and p-values. We added 2 optional settings to help combat this. For the Multiple Testing Problem (adding lots of metrics and dimensions to an experiment), we let you specify a p-value correction method — either Bonferroni or Benjamini-Hochberg. For the “peeking problem” (looking at results too early), we let you enable Sequential Analysis to ensure p-values are always valid.
Visual editor improvements: multi-page experiments and element reordering

GrowthBook’s visual editor continues to improve in 2.1. It now supports running experiments across multiple pages (e.g., changing both a landing page and the next page in the funnel). We also added the ability to reorder elements on the page, expanding the types of experiments that non-technical users can run without engineers.
Major SDK updates for PHP, Python, Ruby, Kotlin, and Java
We’ve been hard at work updating our many SDKs to support the latest GrowthBook features, including encrypted feature flags and built-in fetching and caching. We’ve also greatly improved the code quality and developer experience. For example, adding typed Ruby support (with RBS), snake case APIs for Python, better debug logging in PHP, and more.
Saved groups API
Saved Groups let you easily target feature flags to user groups. Until now, the only way to update this list of users was through the GrowthBook UI. Now, there are new REST API endpoints so you can update the lists programmatically (e.g. add a company id to your “paid users” group when they start a subscription).
Project-scoped stats engine
In some larger organizations, there may be some teams that prefer Bayesian statistics and others that are more comfortable with Frequentist. Now, you can configure the stats engine on a per-project basis. We plan to add many more project-scoped settings in the future, so stay tuned.
Exportable audit logs
For larger organizations, auditing events that happen on the GrowthBook system is important for accountability and compliance. With this new Enterprise feature, you can now easily download a complete list of all the changes that have been made on the GrowthBook platform.
OtherfFeatures and improvements
- Stats engine adjustable per project
- Data source schema browser in SQL editor
- Redis support within the GrowthBook Proxy
And many more changes and bug fixes, which you can read about here: https://github.com/growthbook/growthbook/releases

Visual editor 2.0
We're proud to announce the upcoming release of our brand-new Visual Editor! Soon, you'll be able to design A/B tests on your website directly in your browser, ship the tests to production, and analyze the results, all without writing a single line of code.
The history
We launched our original Visual Editor in Beta last year. This first version was more of a proof of concept to gauge community interest and determine whether we wanted to invest in it going forward. The answer was clear - people really want this feature.
We had been planning to work on Visual Editor 2.0 later this year, but with the sunset of Google Optimize, we decided to accelerate our plans and give the 250,000 Optimize users a compelling, affordable alternative that can work with their existing Google Analytics data.
What is changing?
This new Visual Editor was completely rewritten from scratch. Below are the major improvements available at launch. More importantly, our new design and architecture will enable us to iterate rapidly and add more features in the coming months.
- Chrome Extension instead of IFrames. By switching to a browser extension, we were able to fix a whole host of bugs and security issues associated with IFBy switching to a browser extension, we were able to fix a whole host of bugs and security issues associated with iframes. Also, this lets you try out the visual editor on your live site without deploying any code first.
- Integrated with our JavaScript and React SDKs
Instead of a separate<script>tag, the visual editor is now fully integrated into our JavaScript and React SDKs. This means you can share a single implementation for both visual experiments and feature flags. It also means you can enjoy faster load times and fewer flickers! - Powerful Assignment and Targeting Rules
You can now use the same assignment and targeting system that powers our world-class feature flagging platform for your visual experiments. Plus, our URL targeting is now more intuitive and powerful with support for wildcards and multiple rules.
JavaSThis is just the start. We have a ton more planned for the Visual Editor in the future, including the ability to inject custom javascript, re-order elements on the page, and run multi-page experiments!
When can I use it?
We're putting the final touches on the Visual Editor now and expect it to be fully ready to use next week. At first, the Visual Editor will only be available to GrowthBook Pro and Enterprise customers, but we're working on a way to let everyone try it out for free. Stay tuned for more info!

CUPED for faster experimentation in GrowthBook

There are many ways to improve the speed of your experimentation program. One of the easiest is variance reduction via regression adjustment, often called CUPED (short for Controlled Experiment Using Pre-Experiment Data).
To get started using CUPED with GrowthBook, head over to our documentation.
How does it work?
There are many blog posts and papers on how CUPED works to increase experiment velocity. These are excellent resources that include motivation, intuition, code examples, and evidence of impact.
Rather than rehash the nitty-gritty, let's focus on a high-level example:
Imagine you're running an experiment that looks to increase sales in your online store. You release a new feature in the checkout experience and measure the total value of all purchases by each user. Some users will make large purchases, others small purchases, and others will make no purchases. In your experiment analysis, you'll average purchase across all users in variations A and B and compare the averages.
Because these users are so different, you will have considerable uncertainty about the average. However, imagine you knew how much each user spent on your site in the month before the experiment. CUPED lets you use that information to adjust purchasing behavior during the experiment, taking away the part that can be easily explained by past behavior!
You can read more about our exact implementation and how it works in our documentation. In a nutshell, we fit a very simple linear model to the pre-experiment (or pre-experiment exposure) data and use it to adjust the post-exposure data, reducing its variance.
How can you make the most of CUPED?
Measure experiment effects on leading metrics
To best take advantage of CUPED, make sure to estimate effects on predictable, repeated metrics that are leading indicators of key metrics. The more predictable metrics will likely benefit from greater variance reduction.
Why? The correlation between pre- and post-exposure data for metrics that users generate less frequently will tend to be lower. Using our example above, if we don't have reliable historical purchase data for users, then that data won't provide a big advantage in reducing variance. However, if we know how many items a user views on our site on each visit, that might be a leading indicator of purchasing and may be more strongly correlated over time.
The figure below illustrates the difference in variance reduction from CUPED across different levels of correlation between pre- and post-exposure data. Variance reduction is the difference between the orange and green distributions; the smaller spread of the green distribution indicates that we have reduced variance after using CUPED to adjust metric values. You can see that the variance reduction is greater in the right panel, where the correlation is 0.7.
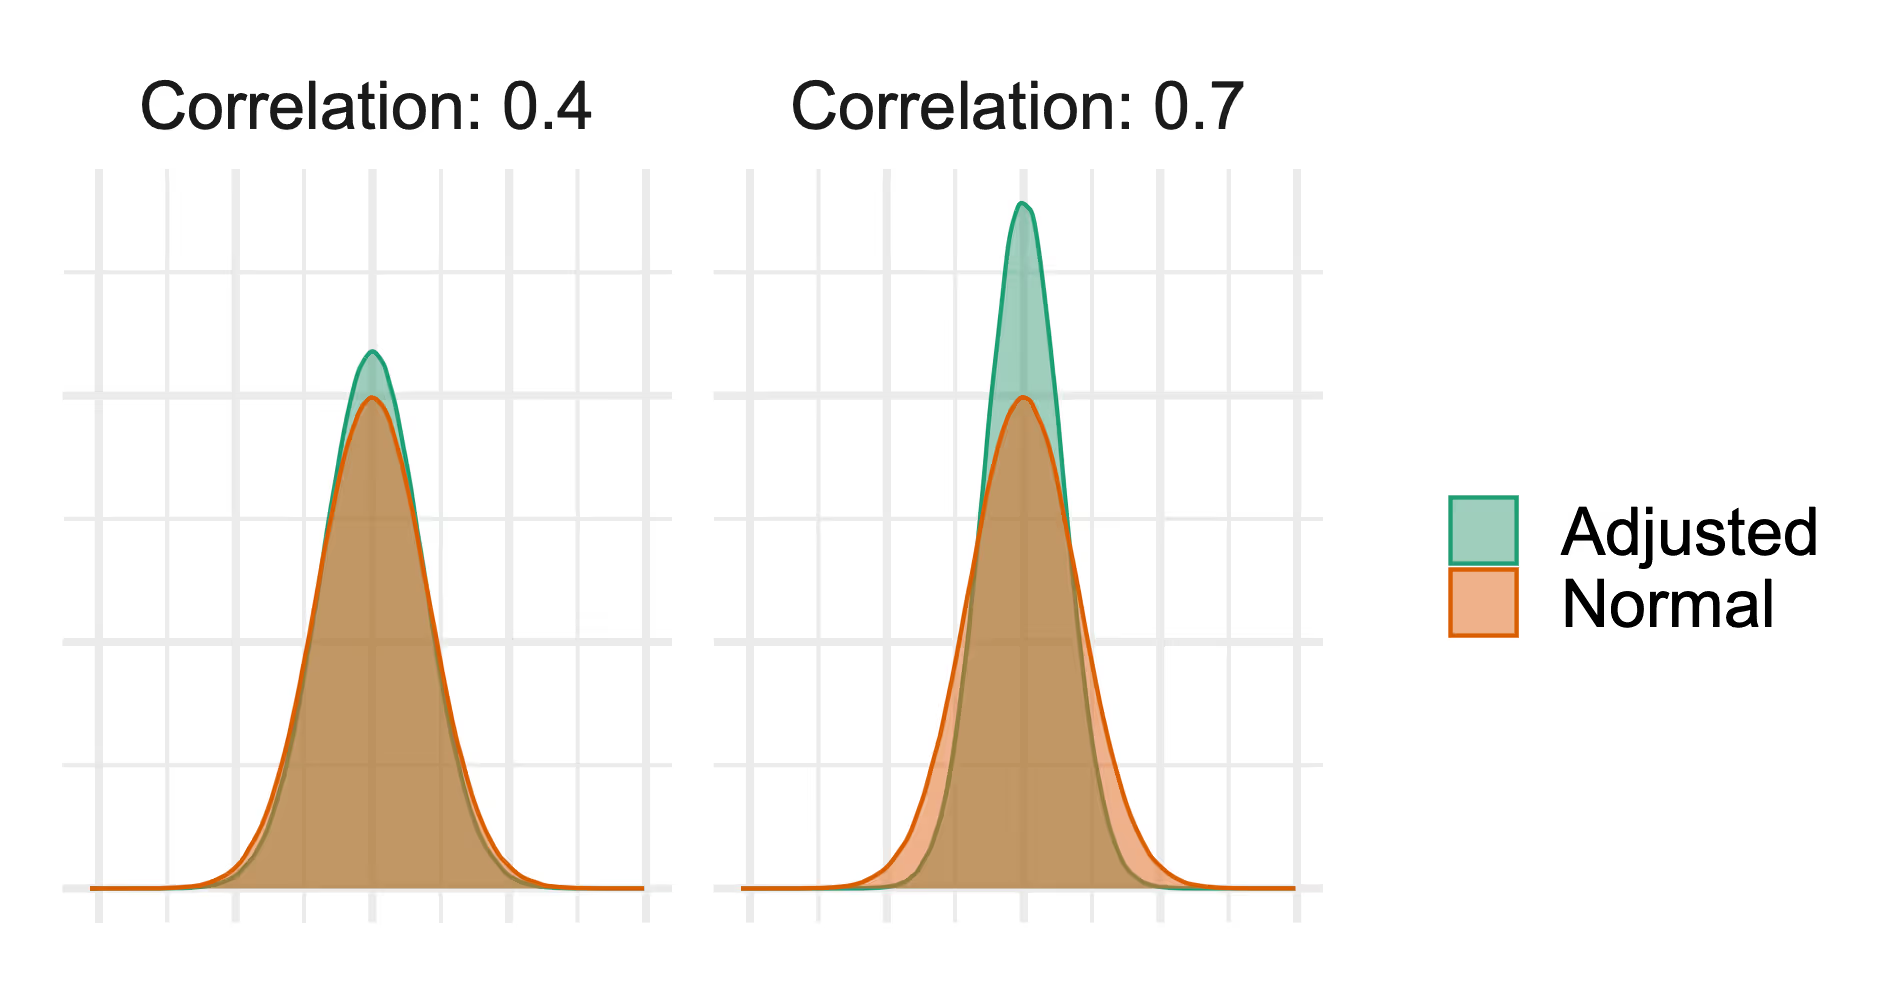
Correlation will tend to be higher for more frequent metrics, like engagement metrics, than for less frequent ones, like purchase behavior, and thus CUPED will do more to improve analyses of those more frequently produced metrics.
This advice is not unique to CUPED; the idea of using leading metrics to get faster answers from experiments is widespread. It's worth noting that the value of leading metrics increases with the availability of CUPED.
Understand your metric behavior and set the right lookback window
GrowthBook uses a (customizable) 14-day lookback window; this is the period before a user is exposed to an experiment that we use to compute their pre-experiment metric totals. The following figure shows you how this works for users who are exposed to the experiment at two different time periods.

We will roll up the green days and use them as the pre-exposure measure to adjust the data from the blue days (post-exposure data).
GrowthBook is highly customizable; you can adjust this lookback window (the green area) using the CUPED settings, and you can adjust the post-exposure conversion window (the blue area) using Conversion Windows and Conversion Delays.
We recommend reviewing your metrics to determine whether there is sufficient user behavior at regular intervals to use this 14-day window, or if you need to set a longer lookback window. If the events are rare, you may find that setting a larger lookback window is more beneficial for variance reduction.
Collect data early
Set up and collect metric data before you start experimenting. CUPED only works if you have data on your users from the period before your experiment starts. If you start collecting data as early as possible, you're more likely to have data available for CUPED to work with.
How does this work for users exposed to the experiment across? Sadly, this means that CUPED will not work well for experiments involving new users or for metrics that are only collected after experiment exposures
In those instances, you are free to use the customizable settings in GrowthBook to turn CUPED off for an experiment or an individual metric. While leaving CUPED on will rarely make your variance worse, it does require scanning more days of your metric source data, and turning it off for metrics it cannot help could improve query performance.
What's next?
More sophisticated adjustment
Initially, GrowthBook uses only the pre-exposure data for the analysis metric in the regression adjustment, but future refinements to incorporate dimensional data, auxiliary metrics, and more complex models are possible.
With great power comes great responsibility
CUPED enables faster experimentation, but it does not resolve the "peeking" problem (for a discussion of this in both the Frequentist and Bayesian frameworks, see: http://varianceexplained.org/r/bayesian-ab-testing/). In Q2 of 2023, GrowthBook will add sequential testing to the Frequentist engine to help mitigate the problem, both with and without CUPED.
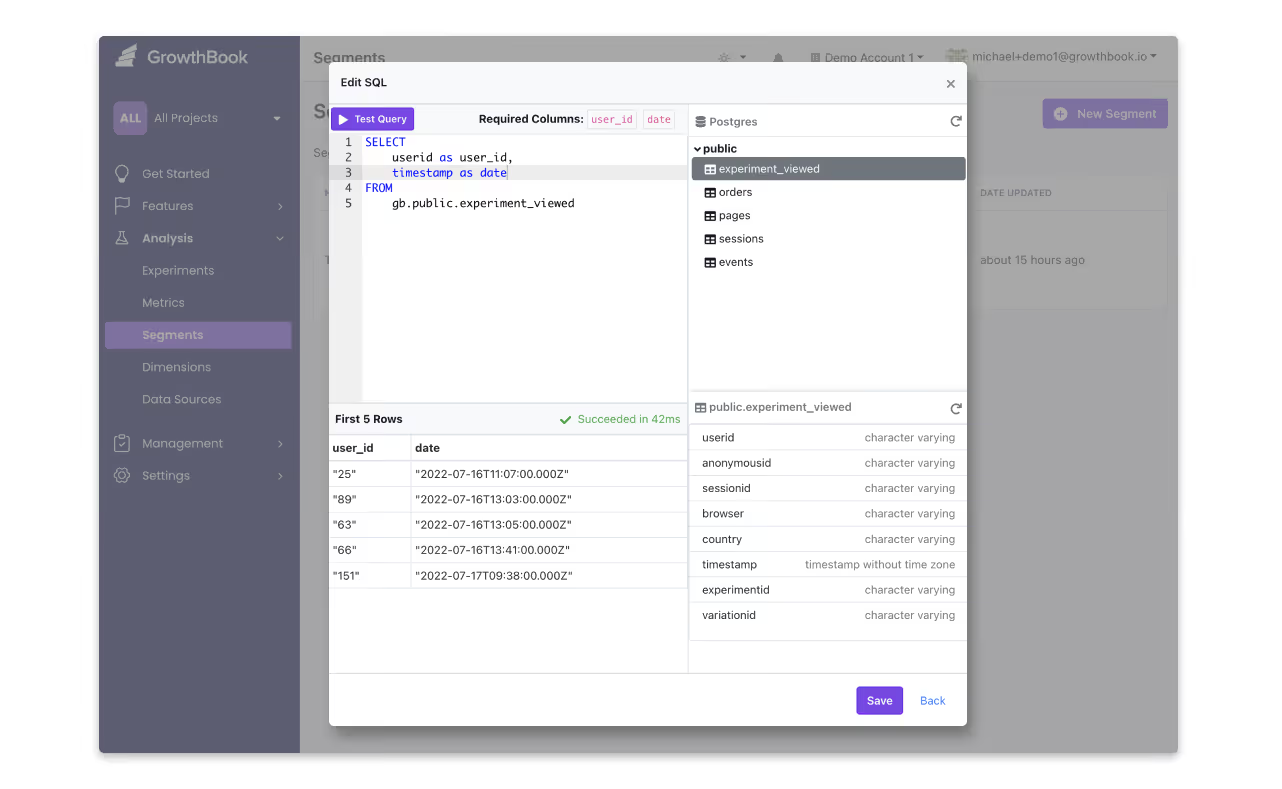
Introducing: the GrowthBook schema browser
GrowthBook is a warehouse-native feature flagging and experimentation platform - which means, instead of having to send data to us, GrowthBook integrates with your existing data infrastructure. Once you connect GrowthBook to your Data Source, you can write SQL to configure Metrics, Segments, and more.
But writing SQL can be challenging. Nearly 36% of the engineers surveyed in Stack Overflow’s 2022 Developer Survey dreaded writing SQL*. To make it easier to define Segments, Metrics, and Dimensions, we built the GrowthBook Schema Browser.
Before, unless you were intimately familiar with a particular data source, you may not have known exactly what schemas, tables, and columns were available, requiring you to switch back and forth between GrowthBook and your data source. Now, with the Schema Browser, you can easily see and search through all of the schemas, tables, and columns available within a data source.

As of GrowthBook 2.0, all new BigQuery and Postgres data source connections will automatically support the new Schema Browser. If you have an existing Postgres or BigQuery data source defined within GrowthBook, simply go anywhere you can write SQL, and you’ll see a call-to-action to generate an Information Schema View for the data source.
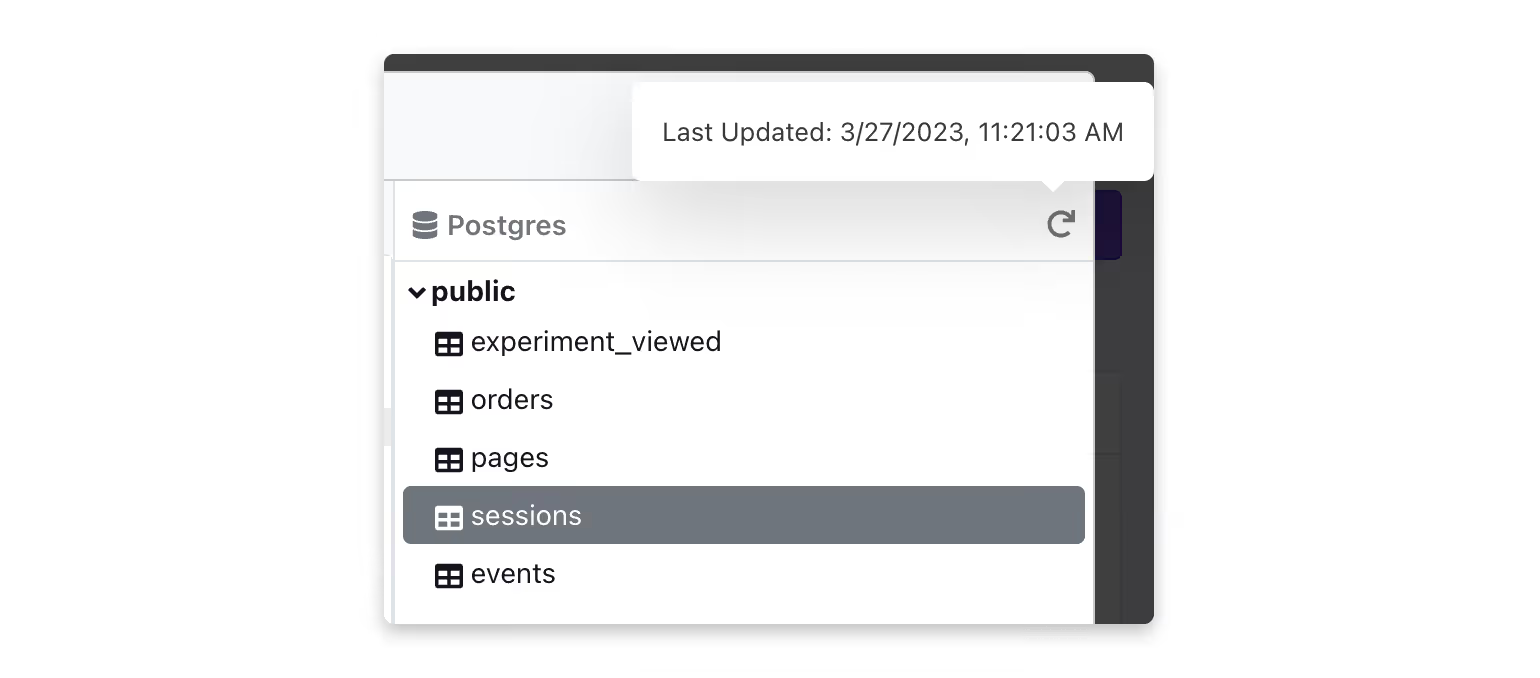
By default, the Information Schema is refreshed every 30 days; however, if you make a change to your data source, you can always click the “Refresh” button to force an update.
We will be expanding the list of supported data source types in the coming weeks, so be sure to keep an eye out for follow-up announcements if you use a data source other than BigQuery or Postgres.

GrowthBook 2.0 —Product Day!
This is the last day of feature announcements for our upcoming GrowthBook 2.0 release. Today we’re highlighting some of the improvements we’ve made for product managers and other non-technical GrowthBook users.
New visual editor 🔥

We’re proud to announce the upcoming release of our brand new Visual Editor! Soon, you’ll be able to design A/B tests on your website directly in your browser, ship the tests to production, and analyze the results, all without writing a single line of code. We’ve made huge improvements since our initial Beta release last year. Read more about the new features on our blog.
Slack integration

We’re excited to announce our much-requested Slack integration! Now you can configure GrowthBook to send alerts to a Slack channel of your choosing every time something you care about happens in GrowthBook — new features created, experiments stopped, etc. Read more about this feature and see instructions for setting it up in our docs.
A/B testing best practices guide
The team here at GrowthBook has put together a best practices guide for A/B testing. This guide outlines everything you need to know as you scale up experimentation at your company. It covers everything from foundational knowledge (“what is an A/B test?”) to advanced topics and common mistakes. This is intended to be a living, continually updated, and fully open-source document. You can find the first version of it here.

GrowthBook 2.0 — Data Day!
This is the second day of feature announcements for our upcoming GrowthBook 2.0 release. Today, we’re focusing on changes related to data and statistics.
CUPED (variance reduction) for faster experimentation

Waiting to collect enough data can be a significant roadblock in increasing experimentation velocity. CUPED, a form of variance reduction, is one of the simplest and most effective ways to remove those roadblocks and get answers faster. For example, Microsoft estimates that using CUPED was equivalent to getting 20% or more of traffic for most of the metrics used by one of its product teams.
CUPED is now available in the Frequentist engine in GrowthBook 2.0. Read more about it on our engineering blog.
Improved SQL editing experience

Getting your metric queries exactly right can require a lot of switching between your database environment and GrowthBook. With the schema browser, you can now browse the database schemas directly from GrowthBook, making adding exposure and metric queries easier to build. Read more about this feature on our engineering blog: https://blog.growthbook.io/introducing-the-growthbook-schema-browser
Faster SQL and simpler configuration
GrowthBook 2.0 can execute SQL queries up to 2X faster than before. By introducing a new attribution model and applying other internal optimizations, the median query runtime is consistently better across test queries and up to twice as fast in certain configurations.
Furthermore, the new “Experiment Duration” attribution model makes it easier to analyze metrics from experiment exposure until the end of the experiment, rather than requiring arbitrarily large conversion windows. The following figure shows the two Attribution Models you can select from in GrowthBook 2.0.

You can read more about the faster SQL queries on our engineering blog.
Databricks integration

GrowthBook now natively supports Databricks as a data source for experiment data. Simply add a new data source, choose the event tracker you use, then select “Databricks” and add your connection details. (This is the 14th data connector for GrowthBook — let us know if you have a request for any more!)

Simpler, faster SQL queries
Experiment analysis queries in GrowthBook now run up to 2X faster!
This performance improvement is due to 3 main changes.
One dimension and variation per user
When users are exposed to multiple variations in an experiment (due to bugs) or have multiple dimension values (e.g., by using multiple devices), we have to figure out what to do.
The previous behavior in GrowthBook was both counterintuitive and bad for performance, so fixing this was a win-win.
Now, when a user is exposed to multiple variations, we remove them completely from the analysis. We also keep track of how many users fall into this bucket. If it's above a critical threshold (1% of experiment users), we show a big warning on the experiment results. This is a sign that something went seriously wrong in your experiment.
When a user has multiple dimension values, we now pick the earliest dimension they had when viewing the experiment. So if someone first viewed an experiment on a phone and then later on a desktop, their "device" dimension will be set to "phone".
You can read more about how we treat dimensions in our documentation here.
New attribution models
Back in GrowthBook 1.7, we introduced a new attribution model called "Multiple Exposures". This model was great for increasing the number of conversions included in the analysis, but it had one main drawback - performance.
We are replacing this model with a new one - "Experiment Duration". This new model also increases the number of conversions in the analysis but in a much more performant way.
The following figure is another representation of the different attribution models, and which data they use, for an example metric with a 6-hour conversion window and 0 conversion delay.

How can I use the new model?
You can change the model on a per-experiment basis under the Experiment Settings.
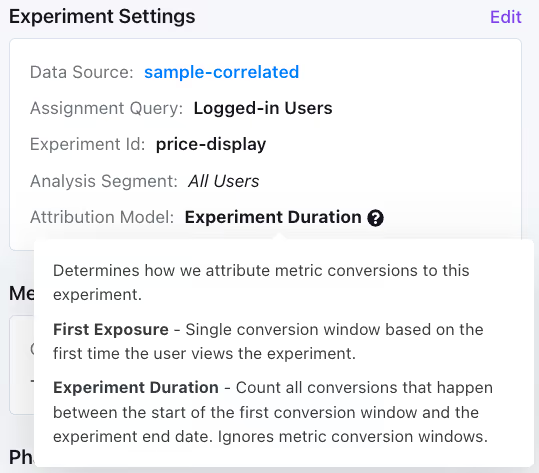
You can also choose the default attribution model for new experiments under your general organization settings.
Removing OINs and GROUP BYs
Due to the above changes, we eliminated multiple JOINs and GROUP BYs, resulting in significant performance improvements, especially for ratio metrics.
To give you a sense of how much we were able to simplify, some of our test queries went from 130 lines of SQL down to only 80!
Thanks to our extensive testing infrastructure, we were able to safely make these big sweeping changes to our SQL structure while ensuring the results remain accurate.
This is just the beginning, and we have big plans for further performance improvements. Stay tuned for more!

GrowthBook 2.0 — Developer Day!
GrowthBook 2.0 is here! Learn about the developer-focused improvements in 2.0, including Typesafe SDK, REST API, and more!
GrowthBook 2.0 is finally here, and this new version is so packed full of feature announcements that we had to split it up over 3 days. Today, we’re focusing on class developer experience.
Typesafe SDK
GrowthBook is pleased to offer the first-ever fully typesafe feature flag SDK for Typescript. Now you can detect typos and bugs in your feature flag checks during compile time. To make this possible, we built a GrowthBook CLI that can auto-generate type definitions based on features defined in your GrowthBook account. You can read more about this feature and get detailed instructions for setting it up on our engineering blog — https://blog.growthbook.io/fully-typesafe-sdk
Instant feature releases

After the success of our self-hosted GrowthBook Proxy release in version 1.9, we’re excited to bring the same benefits to our Pro and Enterprise customers on GrowthBook Cloud. Over the next several weeks, we will enable instant feature rollouts on these accounts. When enabled, feature changes you make in the GrowthBook UI will be released to all of your users in under a second. Read more about this feature and how we’re scaling it to billions of feature requests on our blog — https://blog.growthbook.io/faster-feature-releases-on-growthbook-cloud
REST API
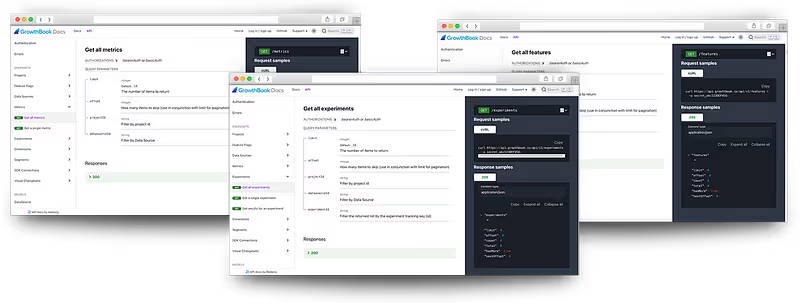
We have been hard at work expanding our REST API, adding over 20 new endpoints and a brand new documentation site: https://docs.growthbook.io/api. We’re super excited about all of the use cases this unlocks, including the ability to sync experiment results to your data warehouse, one of our most requested features! Read more about the new endpoints and changes on our blog — https://blog.growthbook.io/new-rest-apis
More code examples
We’ve improved our example repository to include even more examples on how you can integrate GrowthBook with your code. You can check out the examples repo here: https://github.com/growthbook/examples
Other developer focused features and improvements
- Improved GoLang documentation and examples
- Add variation IDs to experiment feature API payloads on Developers and the work we’ve been doing behind the scenes to enable a world-
- Add support for Experiment CRUD events in webhooks
Tomorrow, we’ll turn our attention towards the many data scientists and analysts using GrowthBook every day. Stay tuned!

Faster feature releases on GrowthBook Cloud
In GrowthBook 1.9, we launched the GrowthBook Proxy server to enable faster feature rollouts for self-hosted instances. With the Proxy, changes you make in the GrowthBook UI (e.g., disabling a feature) are released to all of your users in production in under a second.
We've gotten great feedback from our self-hosted community, and we're excited to bring the benefits of the GrowthBook Proxy server to more people. Over the next several weeks, we're going to enable these same instant feature releases on all Pro and Enterprise accounts on GrowthBook Cloud!
No need to deploy and scale your own Proxy servers, everything will just work automatically.
How does it work?
GrowthBook Cloud serves billions of feature flags every month. To do this reliably at scale, we rely on a globally distributed CDN, short TTLs, and stale-while-revalidate headers.
If a user requests feature flags from our Cloud, it will get routed to an edge location closest to them. Most of the time, the edge location will already have a cached copy and can return instantly. If that cached copy is more than 30 seconds old, the CDN will refresh it in the background. In the rare event a cached copy does not exist, we forward the request to our Origin server and cache the response for future requests.
This is all well and good, but it means features could be 30-60s out-of-date. If a feature is causing your site to break, you want to be able to turn it off immediately, not in 30-60 seconds.
To solve this issue at scale, we use Redis Pub/Sub and Server-Sent Events. After receiving a cached copy of features, SDK clients connect to one of our globally distributed proxy servers, replay recent updates, and subscribe to future changes. When you toggle a feature in GrowthBook Cloud, we use Redis Pub/Sub to notify all proxy servers, which in turn notify all connected clients via Server-Sent Events. All of this happens quickly - typically within 1 second.
You get the best-in-class uptime and speed of a global CDN combined with the responsiveness of a real-time system.
SDK support
Right now, these instant feature releases only support our JavaScript and React SDKs. We plan to add support to all of our SDKs over the coming months.
Interested in contributing and helping us implement this in your language? Join our community Slack
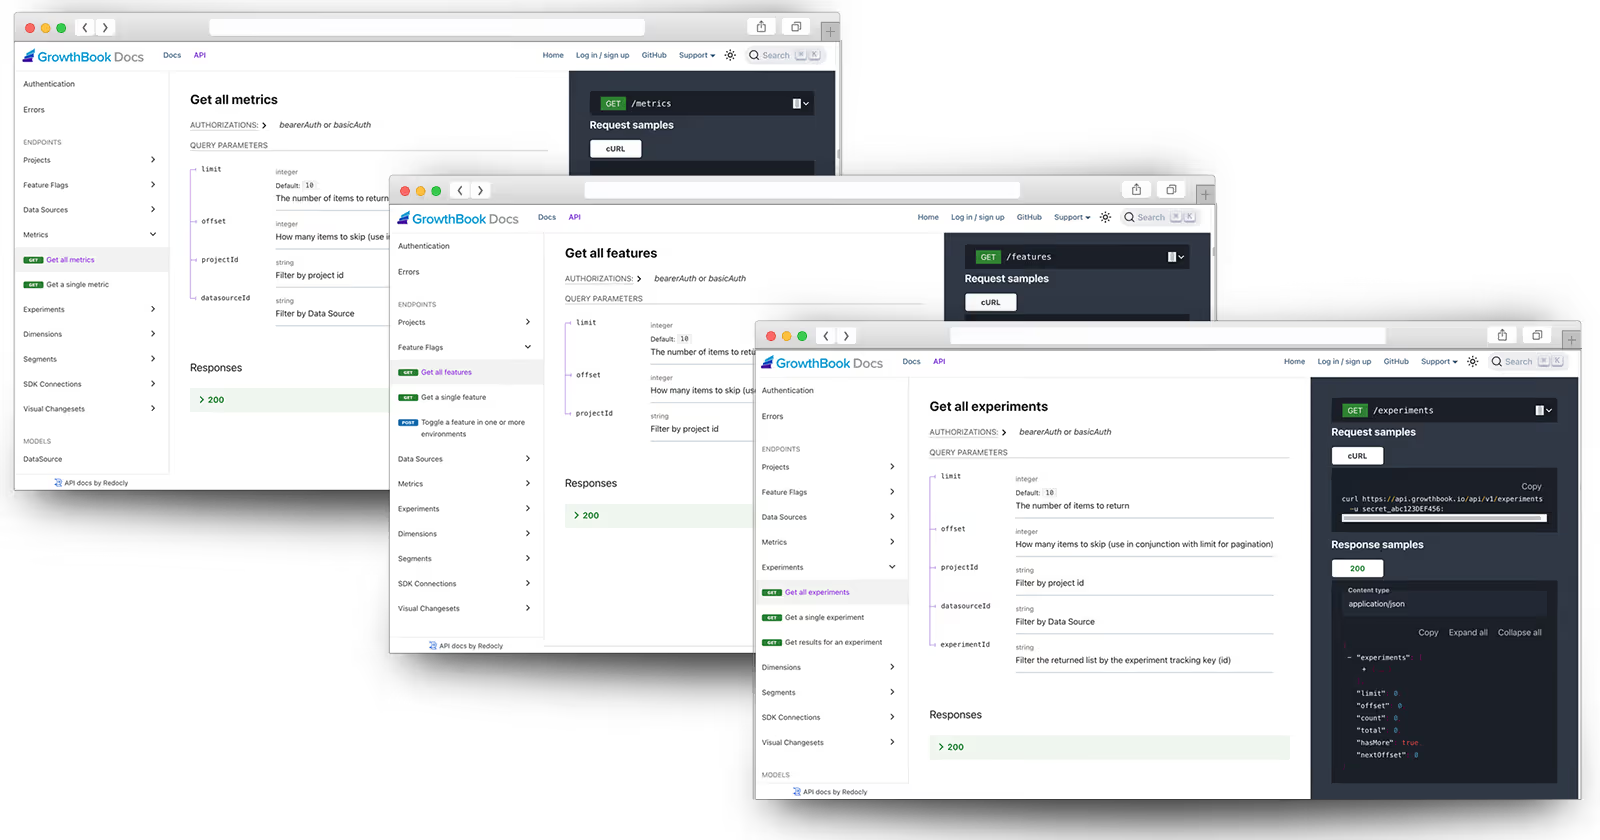
New REST APIs
Back in October, we launched our very first REST API endpoint (GET /features) to list all of the feature flags in your GrowthBook account. Since then, we've been adding new endpoints and improving documentation. There's still a lot of work to do, but we wanted to highlight some of the cool new use cases unlocked by our recent work.
OpenAPI and new documentation
Our REST APIs are now fully documented using the latest OpenAPI 3.1 standard. For those unfamiliar with OpenAPI (formerly Swagger), it's a standardized way to describe API endpoints, their inputs and outputs, and how everything ties together.
The coolest part about this is our new documentation site - https://docs.growthbook.io/api. Everything you see there is 100% auto-generated. When we add a new API endpoint or change the source code, the docs will always stay completely up to date. This lets us iterate quickly and is the main reason we've been able to add so many new endpoints in such a short amount of time.
Syncing experiment results to a data warehouse
When you run an experiment in GrowthBook, we query the raw data in your data warehouse, do some fancy aggregations, and pass it through our statistics engine. This final processed data is what powers the GrowthBook UI. But what if you want these processed results to be available back in your data warehouse alongside the raw data?
This is something we want to support natively in GrowthBook eventually, but now that we have a REST API, you no longer need to wait for us to implement this functionality. Now, you can use the /experiments/{id}/results endpoint and a cron job to build out this functionality yourself.
Automatically disable a feature based on guardrails
If you launch a feature as an A/B test, you can specify Guardrail Metrics in GrowthBook. These are things you are not specifically trying to improve but want to keep an eye on. For example, if you're testing a new signup form, you might add "bounce rate" as a guardrail.
To use this guardrail today, you have to manually log into GrowthBook, refresh experiment results, and if you notice a guardrail metric is failing, manually disable the feature flag.
Using the REST API, you can now fully automate this process. Fetch experiment results and use the /features/{id}/toggle endpoint to disable a feature programmatically if you detect a failing guardrail.
And lots more...
Check out the docs at https://docs.growthbook.io/api for all of the currently supported endpoints.
Most endpoints are read-only today, but we're adding support for additional methods shortly to unlock even more advanced use cases.

Fully typesafe SDK
GrowthBook client-side SDKs have always been written in 100% Typescript, which provides a great baseline level of type safety. Trying to use a numeric feature flag value as a string? Get a compile-time error.
const value: string = gb.getFeatureValue("my-feature", 5.0);
// Error: Type 'number' is not assignable to type 'string'This was done entirely through type inference. In the above example, we noticed you passed a number (5.0) as the fallback value, so we inferred the feature value was numeric. When you try to assign that to a string variable, TypeScript complains.
The missing link
However, there were two glaring holes in our approach:
- What if you made a typo in the feature name itself? (e.g.
my-faeture) - What if you used the wrong fallback value? (e.g.
my-featurereally is a string, the5.0is the real mistake)
With the latest release of our SDK, we are now able to catch both of the above during compile-time type checks:
gb.isOn("my-faeture");
// Argument of type '"my-faeture"' is not assignable to parameter...

gb.getFeatureValue("my-feature", 5.0);
// Argument of type 'number' is not assignable to parameter of type 'string'
How does it work?
The magic happens when creating the GrowthBook instance. You pass in an object describing all of your features and their data types. From that point forward, all of the methods on the GrowthBook instance will be strictly typed.
type AppFeatures = {
  "my-feature": string;
  "other-feature": boolean;
}

const gb = new GrowthBook<AppFeatures>(...);
The GrowthBook CLI
Creating AppFeatures manually and keeping it up-to-date can be tedious and error-prone. Luckily, we also released a handy command-line tool to generate these for you automatically.
First, install our CLI.
yarn add growthbookThen, authenticate the CLI to your GrowthBook account using a Secret Access Key, which you can generate under Settings > API Keys.
yarn growthbook auth login --apiKey XXXLastly, add a script to your package.json to generate feature types and store them in a file:
{
  "scripts": {
    "type-gen": "growthbook features generate-types --output ./types"
  }
}
Now you can run your script anytime features change within GrowthBook and it will generate a new TypeScript file that defines an AppFeatures type:
yarn type-genTo use the generated types in your application, import them as follows:
import { AppFeatures } from "./types/app-features";

const gb = new GrowthBook<AppFeatures>(...);
What's next?
We're just getting started with type safety. In the future, we want to support strongly typed targeting attributes and integration with all of our SDK languages - client-side, back-end, and mobile.
We also have a lot more planned for our GrowthBook CLI. Imagine being able to create and toggle features as part of a CI/CD pipeline. Or quickly spinning up a local webhook listener for development.

GrowthBook now supports Databricks
Growth Book now natively supports Databricks as a data source for experiment data. Databricks users can now easily run A/B tests with their data using GrowthBook. Simply add a new data source, choose the event tracker you use, then select “Databricks” and add your connection details.
This is the 14th data connector for GrowthBook. Let us know if you have a request for any more!


GrowthBook version 1.9 🚀
We’ve been hard at work on GrowthBook 1.9 for the past two months, and are excited to release one of our biggest updates ever! This release includes a Frequentist statistics engine, our GrowthBook Proxy server, scheduled feature flags, and event-based webhooks.
Frequentist stats engine
Does your team have a strong opinion about Frequentist vs Bayesian statistics? You can now select which statistics engine you want to use when analyzing experiment results. By default, we will continue to use Bayesian statistics, but you can change this on our general settings page. We have a lot planned for our Frequentist engine in the near future — variance reduction with CUPED, sequential analysis, and more, so stay tuned!
GrowthBook proxy server
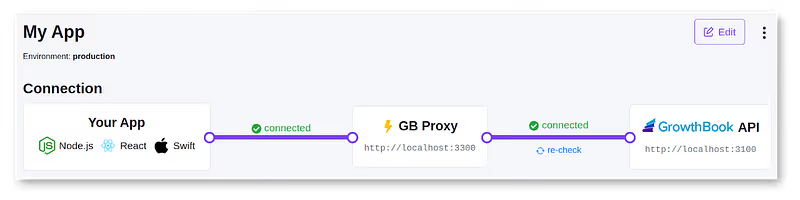
The GrowthBook Proxy server sits between your application and GrowthBook. It turbocharges your GrowthBook implementation by providing extra speed, scalability, security, and real-time feature rollouts. We’ve also made substantial improvements to our JavaScript and React SDKs to better take advantage of these new capabilities. Check out the docs here — https://docs.growthbook.io/self-host/proxy
Feature flag scheduling

You can now schedule feature rules to be enabled or disabled at specific times. No more waking up at midnight to turn on a sales banner or setting calendar reminders to turn off experiments in two weeks. This feature is available on Pro and Enterprise plans.
Event-based Webhooks

One of our goals is for GrowthBook to integrate with all of the existing tools you use — Slack, Jira, DataDog, you name it. We started this effort in the last release with our REST API and are continuing it now with Event-based Webhooks. As we expand both of these systems in the coming months, you will be able to build complex custom workflows — for example, “post in Slack every time an experiment reaches significance” or “turn off feature flag X if DataDog detects an increased error rate.”
Other features and improvements
- Override metric settings on a per-experiment basis
- Limit metrics and data sources to specific projects
- Added the ability to easily duplicate features
- Archivable targeting attributes
- SQL tester for segments, dimensions, and metrics
Plus many more changes and bug fixes, which you can read about here: https://github.com/growthbook/growthbook/releases

4000 Stars!
GrowthBook now has over 4000 stars on GitHub! A big thank you to all the community members who contributed to building GrowthBook and helped make it the best open-source feature flagging and experimentation platform. (https://github.com/growthbook/growthbook)
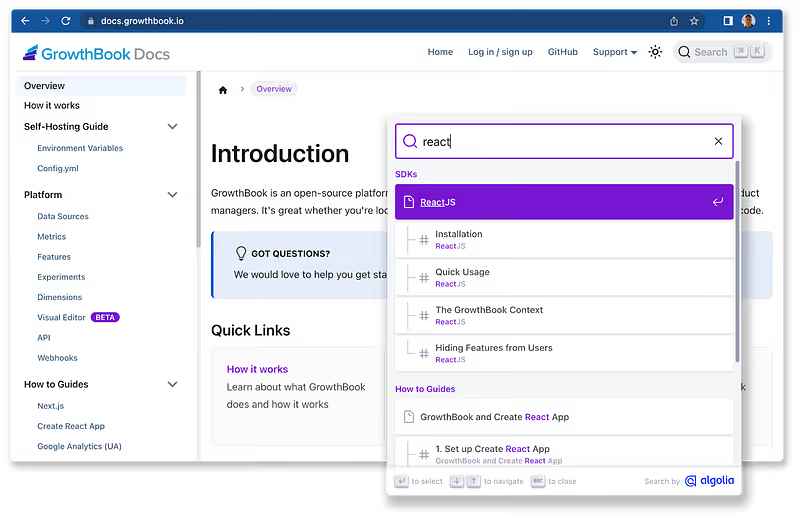
GrowthBook version 1.8
GrowthBook continues to improve, and in this version, we’ve launched some highly requested features, including a new REST API, a Java SDK, and advanced permissions. The highlights of the release are below.
We’re doing a live event to demo all the new features in this release and answer your questions. You can join us here.
REST API
You can now list and toggle feature flags programmatically with our new REST API. Use this to integrate GrowthBook into your CI/CD pipelines and internal admin tools. This is just the start; we have many more endpoints planned, which we will release over the coming weeks and months to enable even more integrations and use cases. Stay tuned!
Java SDK ☕
We are proud to release an official Java SDK for GrowthBook! Check out the docs and examples at https://docs.growthbook.io/lib/java
Fine-grained permissions by environment and project 🔑

We added advanced permissions to our Pro and Enterprise plans, available both on GrowthBook Cloud and when self-hosting. You can now restrict access by environment and assign project-specific roles to users. This opens up a ton of use cases. For example, let engineers make changes to feature flags in dev, but require admin approval before publishing to production.
New documentation site
-We launched a completely new documentation site, now with built-in search powered by Algolia. We also added a table of contents to every page to make navigation easier.
Encrypted Feature Flags

When you use feature flags in a client-side application, it’s possible for technically savvy users to inspect your network requests and see which features you have defined and how you’re rolling them out to users. We added an option to encrypt the SDK endpoint so features won’t be exposed in plain text anymore. Read more about this feature and its limitations in our docs. Encryption is only available with our Pro and Enterprise plans.
VS Code extension
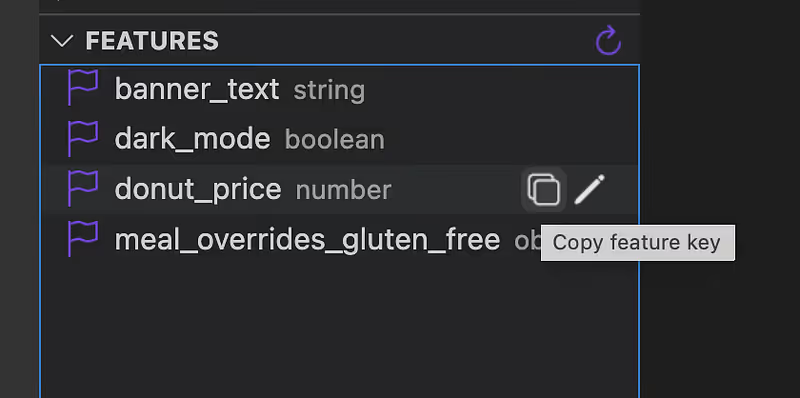
We launched our first ever VS Code extension! Configure the extension with your GrowthBook account info, and it will list all of your feature flags directly in the UI. Developers can now easily use our SDKs without constantly switching back to the GrowthBook application. We’re always trying to improve the developer experience, so let us know what else you’d like to see added to this extension!
Other Features and Improvements
- “Test Query” button to debug experiment assignment queries
- Improved sorting and searching throughout the app
- Auto-authentication and default catalog support for AWS Athena
- Better formatting of SQL queries
Plus many more changes and bug fixes, which you can read about here: https://github.com/growthbook/growthbook/releases
GrowthBook version 1.7
One of our biggest releases yet! This version includes over 50 highly requested features and bug fixes. We are super excited to share the highlights of the release. As always, please let us know if you have any feedback.
🌙 Dark mode
At GrowthBook, we always strive to build a great developer experience, and sometimes that means embracing the dark side. Our new Dark Mode is more friendly for the eyes, extends laptop battery life, and just plain looks cool. We’ll try to detect your OS preferences automatically, but you can switch themes at any time in the top nav bar.
➗ Ratio metrics v2 with the delta method
Back in version 1.4, we added initial support for Ratio Metrics, but there was a big restriction — the randomization unit and analysis unit had to be the same. If you split traffic per user, all of your metrics had to also be per-user. That means you couldn’t do things like “Pages per Session” or “Average Order Value”, which, instead of users, are based on sessions and orders, respectively.
In this latest release, we lifted this restriction. You can now have metrics based on any unit — orders, sessions, page views, whatever you want. Behind the scenes, we use the Delta Method for variance correction to make sure our statistics engine can give you accurate results, no matter what units you pick.
🎯 Reusable targeting groups
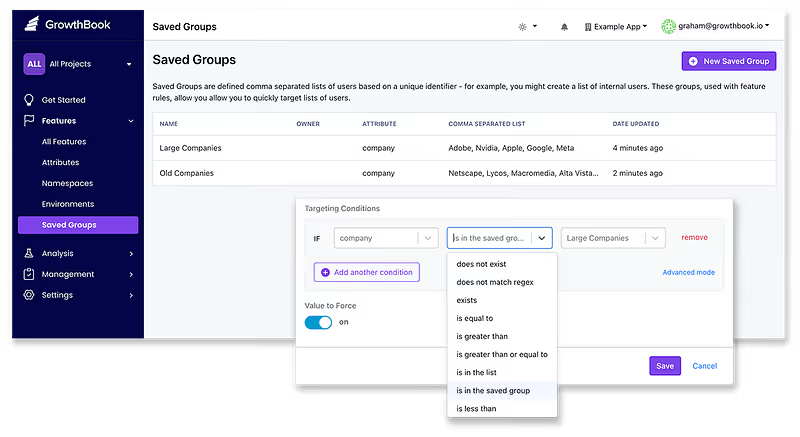
One of our most requested changes is now live! Instead of copy/pasting lists of user IDs between feature targeting conditions, you can now define that list once in a Saved Group and easily reference it from multiple places.
For example, you could make a Saved Group called “Enterprise Customer Ids” and use it to release all of your new enterprise features. If you later add or remove a customer from the group, it will automatically update all of the features. We have a lot planned for this section in the future, including the ability to populate groups from a SQL query, so stay tuned!
Different attribution models

The attribution model is how GrowthBook decides which metric conversions to include in an experiment analysis. Until now, we have always used a “First Exposure” model, where only a user’s first time viewing the experiment is considered. If they came back and viewed the experiment again a week later, we ignored it.
With this release, you can now choose to use an “All Exposures” attribution model instead, in which these subsequent experiment views are also considered. Depending on the experiment, this can dramatically reduce the amount of time needed to reach significance, so we highly recommend trying it out to see if it makes sense for your use case. If we get enough positive feedback, we may decide to make this the new default model in the future, so let us know your thoughts!
Self-hosted enterprise SSO

We overhauled our authentication system to support Enterprise SSO, no matter where GrowthBook is deployed — whether it’s on our managed GrowthBook Cloud or in your own infrastructure. Reach out to sales@growthbook.io if you’d like to learn more about our Enterprise offerings.
Microsoft SQL Server support

We added Microsoft SQL Server as an officially supported data source. Our goal at GrowthBook is to let you experiment on top of your existing data infrastructure, no matter where it lives. This brings us one step closer to that vision. Let us know what other data sources you’d like to see us add next!
Other features and improvements
- Support for Snowflake authenticated proxies when self-hosting
- Add documentation and examples for Swift and C# SDK
- Invite multiple team members at once
- Added SSL support for MySQL and Trino/Presto data sources
- Validate SQL and feature values before saving
- Added experimentId as a SQL template variable
- Allow OR in Mixpanel metric event names to match against multiple events
And many more changes and bug fixes, which you can read about here: https://github.com/growthbook/growthbook/releases

GrowthBook is now SOC 2 compliant!
From the start, we built GrowthBook with privacy and security as core principles. We recognize that building this trust is critical to our success as a feature-flagging and A/B testing platform. This focus has affected many aspects of how we have architected our product, and now by completing the System and Organization Controls (SOC) 2 Type 1 audit, we demonstrate how GrowthBook safeguards customer data and ensures good security practices.
SOC 2 is an audit conducted by certified third-party auditors who check an organization against trust criteria. The official audit report provides a thorough review of the GrowthBooks systems, including the suitability of the design and the operating effectiveness of controls in achieving the Trust Services Criteria: security, availability, confidentiality, and processing integrity.
You can learn more about GrowthBook’s security and privacy philosophy, and request a copy of our SOC 2 report, on our site.

GrowthBook version 1.6
Version 1.6 of GrowthBook includes big UI improvements when installing and configuring the platform, plus lots of time-saving improvements for existing users.
New data source form and pre-built schemas!
We’ve added built-in support for tons of additional event sources, including Firebase, Matomo, Heap, Jitsu, and Freshpaint! When adding a new data source, you’ll be presented with the above screen, and based on your event source, we will pre-fill SQL queries and settings for you to help you get started quickly.
New Getting Started flow

We added a brand new onboarding flow when first installing GrowthBook. We also added a persistent “Get Started” section to the left nav so you can easily get back to where you left off. This new setup process will walk you through installing our SDK, adding a feature flag, connecting to a data source, and defining metrics.
Always show user counts in experiment results
When dealing with new experiments or experiments with low traffic, it’s not uncommon to have 0 conversion events on your goal metrics.
This change allows you to see the total traffic exposed to the experiment even when the number of conversion events is zero.
Support optional experiment/variation name columns
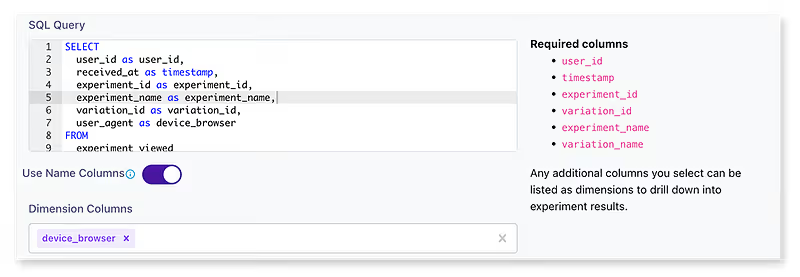
You can now select variation_name and experiment_name in the experiment exposure query to make the results more human-readable. This setting can be adjusted in the ‘edit data sources’ modal.
Miscellaneous other features and fixes
- Added the ability to change roles on invites (thanks reecenil!)
- Added dev containers support for easy developer setup
- Added the ability to rename and delete namespaces
- Update how we display suspicious results
And many more changes and bug fixes, which you can read about here: https://github.com/growthbook/growthbook/releases
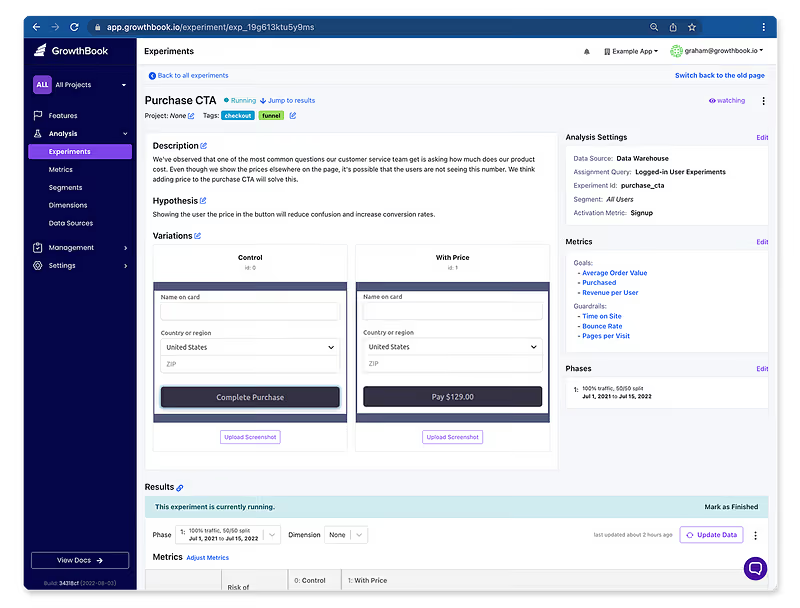
GrowthBook version 1.5
We are pleased to announce the release of GrowthBook 1.5! In this version, we redesigned the experiment page, added a CSV export, and a lot more. As always, please let us know if you have any feedback!
New UI for experiments
The redesigned experiment page now features everything in a single view instead of needing to switch back and forth between different tabs and menus. Also, you can now quickly see whether or not an experiment has an activation metric or segment applied, as well as a history of all the experiment phases. We’d love to know what you think!
New “How To” guides

We have created step-by-step guides for setting up GrowthBook with Mixpanel, RudderStack, BigQuery, GA, and Next.js, with more coming soon. You can check out the guides at https://docs.growthbook.io/guide and let us know what other ones you think we should have!
Export experiment results as CSV
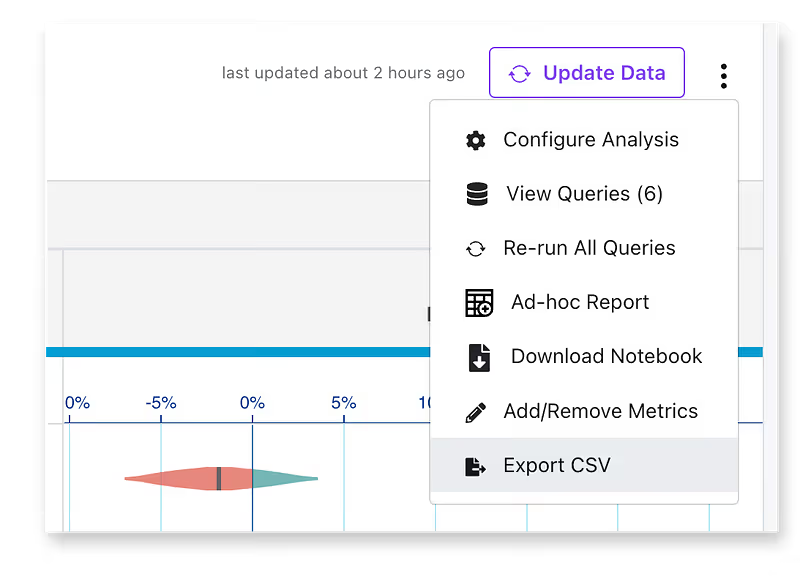
Way back in version 0.5, we added the ability to download results as a Jupyter Notebook. This was great for data teams to dive in and perform deeper analyses, but less technical users were out of luck. Now you can also download the results as a CSV file, which you can open in any spreadsheet tool. This furthers our quest for data transparency and lowers the barrier to truly owning your own data.
Support Google Cloud Storage

Screenshots and images are an important part of documenting features and experiments. Almost exactly 1 year ago, we added the ability for self-hosted deployments to use Amazon S3 to securely store uploaded images. In this release, we added support for Google Cloud Storage for all of you hosting GrowthBook in a GCP environment.
Activity log
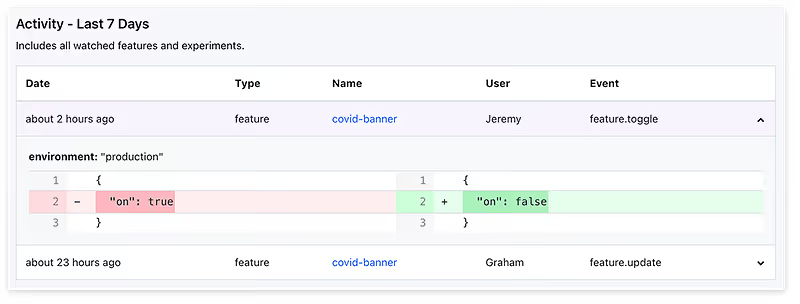
You can now watch specific features for changes by clicking on the Eye icons on the feature list. Then, you can see a list of all their recent activity by clicking the Bell in the top navigation bar. Coming soon, you’ll be able to set up email notifications for all your watched features, so you can easily stay up to date on what’s happening.
Owners
We added an “Owner” field for features, metrics, segments, and dimensions. Use this to keep track of which team or individual is responsible. This is great when onboarding new employees to your GrowthBook account since it’s an easy way for them to know who to ask if they have any questions about how something is defined or implemented.
Miscellaneous other features and fixes
- Clickhouse error caused by missing SQL aliases #446
- Control the default environment toggle states for new features #428
- Metric tooltips on experiment results with helpful info #417
- Sort projects dropdown alphabetically #456
- Update dependencies — React 18, Next.js 12, Tailwind 3, Typescript 4.7 #459
And many more changes and bug fixes, which you can read about here: https://github.com/growthbook/growthbook/releases

GrowthBook version 1.4
Our latest version is here with some highly requested updates, including ratio metrics, and a new UI for showing experiment traffic splits. Check out the changes below. As always, please let us know if you have any feedback or ideas.
Ratio metrics! 🎉

By default, metrics are evaluated against all users in an experiment. Now, we let you customize this by setting a denominator. For example, you can now create ratio metrics like “Revenue per Signup” or “Checkout Completion Rate”. Stay tuned for more updates to ratio metrics to handle even more advanced use cases!
New experiment assignment UI
We improved the UI when creating experiment rules for features. We now let you control the exposure percent independently from the traffic split. The preview at the bottom also now accurately represents how our bucketing algorithm works and shows how you can safely scale the exposure percent without causing users to switch variations.
New permissions and roles for feature flags
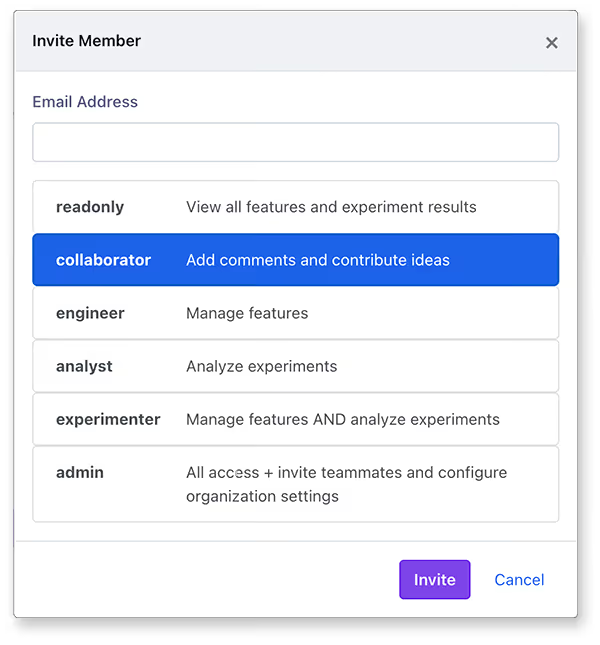
We revamped our permission system to incorporate feature flags into the roles. This change lays the groundwork for future improvements, such as per-environment and per-project permissions.
Syntax highlighting for SQL and Python input
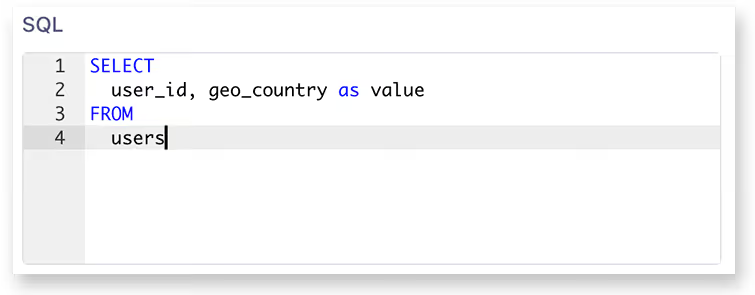
There are several places in the GrowthBook UI where we ask users to write code — usually either SQL or Python. We switched from using a plain text box to a full-featured code editor — the same one used by Mode analytics and others. This brings syntax highlighting, easier indenting, line numbers, and more highly requested UX improvements!
Ability to archive features
You can now archive features and prevent them from appearing in API and webhook payloads without deleting them. Archived features are also hidden by default in the feature list. This is a great way to remove a feature while keeping the full revision history as areference in case you need it later.
Support for feature flags in Ruby SDK

The past couple of months, we’ve been updating all of our SDKs to support feature flags, and we just completed the final one — Ruby! In addition to feature flag support, all of our SDKs now use the exact same test suite (300+ test cases) to ensure we maintain full cross-platform compatibility. You can find the Ruby SDK here.
Miscellaneous other features and fixes
- Search/Filter by tag improvements
- Feature discussion threads #402
- Admins can reset users’ passwords when self-hosting #378
- Search by toggled environment on feature list #366
- Support string, number, and boolean comparisons in Mixpanel metric conditions #355
And many more changes and bug fixes, which you can read about here: https://github.com/growthbook/growthbook/releases

GrowthBook hits 3,000 stars on GitHub! 🎉
In under 1 year since we released the first open source version of GrowthBook on GitHub, we’ve passed over 3,000 stargazers. It has been an amazing journey building GrowthBook with our community.

GrowthBook version 1.3
Version 1.3.0 is here, adding much-needed flexibility for SQL data sources, revision history for features, and a brand-new Flutter SDK! Below is a quick summary of some of the changes. As always, please let us know if you have any feedback or ideas.
Custom Identifier Types (Randomization Units)

Previously, GrowthBook had two hard-coded user identifier types (or randomization units) — user_id and anonymous_id. This worked for some websites, but was not very flexible. For example, B2B products might want to split users by their company instead of an individual user_id. Or an app might only have logged-in users and have no use for an anonymous_id.
Now, you have complete control over the identifier types and can pick the exact ones that make sense for your business. Identifier types can be set from the data source page by clicking on “Edit Query Settings”. This has been one of our most requested features, and we’re excited to finally bring it to you!
Feature versioning and audit logs

When editing a feature, we now queue up changes in a draft version and let you review and publish them all at once, along with an optional commit message. You can see the full revision history and easily revert to a previous state if needed.
You can also now view a detailed audit log that shows exactly what changes were made to a feature and who made them.
Multiple experiment assignment queries
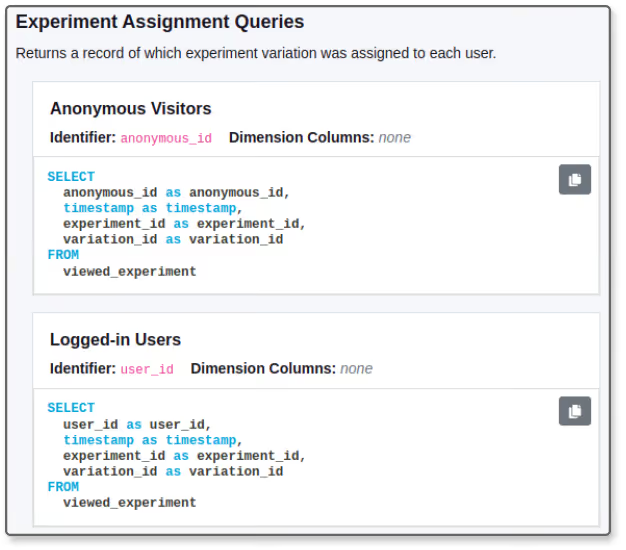
Previously, data sources had a single “experiments’’ query that needed to return all exposure events for all experiments. If you needed different variations of that query for whatever reason, you had to make a bunch of duplicate data sources.
Now, GrowthBook lets you define multiple assignment queries for a single data source. When analyzing an experiment, you choose which assignment query to use.
New Flutter SDK!
We are pleased to announce the release of the GrowthBook Flutter SDK! This SDK was contributed to our open source project by Dhruvin Vainsh and Prince Bansal, Software Engineers at Alippo. You can find the repo here: https://github.com/alippo-com/GrowthBook-SDK-Flutter.
Miscellaneous other features and fixes
- Add the ability to sort goal metrics in an experiment
- Add line numbers and a “copy SQL” button to the “View Queries” modal
- Added SSO/SAML support for GrowthBook Cloud (requires enterprise contract)
- Added support for dimensional analysis when using Mixpanel
And many more changes and bug fixes, which you can read about here: https://github.com/growthbook/growthbook/releases

GrowthBook version 1.2.0
Our latest version is packed full of usability updates and some of our most requested additions. Check out the changes below. As always, please let us know if you have any feedback or ideas via Slack.
Multiple customizable environments

Instead of just the pre-defined ‘production’ and ‘dev’ you can now define an unlimited number of environments for your feature flags to match your infrastructure (eg: adding staging, and QA). Each environment gets its own API endpoint that only includes features enabled for that environment.
Built-in SQL schemas for GA4, Segment, Snowplow, RudderStack, and Amplitude

Many companies use an event-tracking library to load data into their SQL warehouse. GrowthBook now supports many of these database schemas out-of-the-box — Segment, Snowplow, RudderStack, Google Analytics 4, and Amplitude. If you use one of these systems, you no longer need to write SQL to start analyzing experiment results! Let us know if there are additional ones you think we should support.
Mutually exclusive experiments
We added the concept of Namespaces to the GrowthBook UI to enable mutually exclusive experiments! If two experiments are in the same namespace and their ranges do not overlap, users will only be included in at most one of them. To get started, add your first namespace under Settings.
Per-environment rules

Rules are now defined separately for each environment and can easily be copied and moved between them. Use this to test a complicated targeting rule or experiment on dev before enabling it in production.
Tag manager and customizable colors

There’s a new dedicated page under Settings to manage all of the tags you’re using to organize features, metrics, and experiments. You can also now set custom colors for tags to make it even easier to differentiate them visually.
Quick tag-based filtering

When your list of feature flags and metrics starts to get large, organization becomes key. In addition to our powerful search, you can now quickly filter the list by tags.
Redesigned left navigation

We reorganized the left navigation to make it more intuitive, especially for new users. Everything having to do with analyzing experiment results is now grouped under an “Analysis” section. Project management tools like our Ideas board and Presentation generator now live under “Management”.
Miscellaneous other features and fixes
- Custom aggregations support for Mixpanel metrics
- Ability to delete ad-hoc reports
- Tons of bug fixes and documentation updates
You can read about the full list of changes here.

GrowthBook 1.1.0 — Android SDK, UI Improvements, and more
Version 1.1.0 of our open-source feature flagging and experimentation platform is here, which includes new SDKs and numerous other improvements. Below is a quick summary of some of the changes we released. We’re also live on ProductHunt, and we would really appreciate an upvote if you’re a fan of what we’re building.
Android and Go SDK
We released our Go and Android SDK. You can find the Go SDK here: https://github.com/growthbook/growthbook-golang. The Android version is supported through Kotlin; you can find the repo here: https://github.com/growthbook/growthbook-kotlin . The full docs for all the SDKs is here: https://docs.growthbook.io/lib.
Streamlined feature creation modals
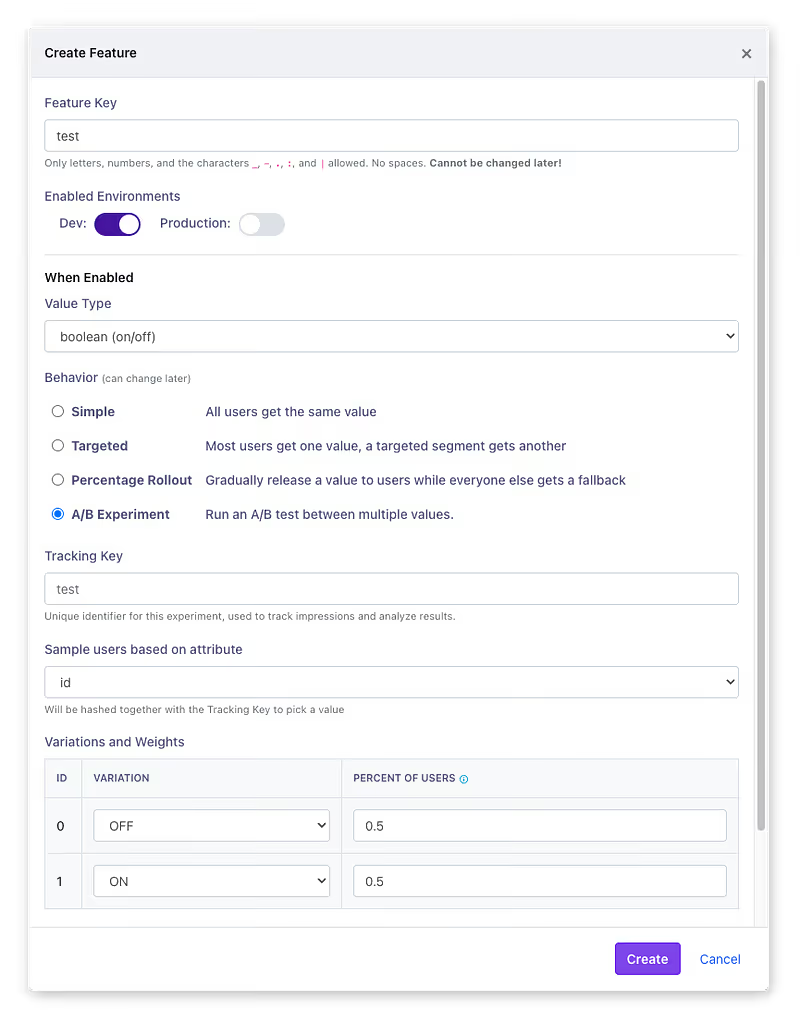
We simplified and restructured the feature creation process so you can now add an initial rule in fewer steps.
Project-scoped APIs and WebHooks

You can now filter webhooks by environment and project. This limits which features trigger the webhook and filters the list of features in the payload. We also added the same filters to the features API endpoint for those of you not using webhooks.
No more ‘pageviews’ data source query
We’ve restructured our SQL query generator and no longer require a ‘pageview’ query, which was a common source of confusion and not applicable to backend or mobile applications.
Miscellaneous other features and fixes
- React Native support in the React SDK
- Support both Datetime and Timestamp data types in BigQuery
- Added Mixpanel tracking instructions, FAQ, and How it works section to the docs.
You can read about the full list of changes here.

Go (Golang) SDK for feature flagging and experimentation
We’ve recently released an SDK for our feature flagging and experimentation platform in Go. The library is extremely lightweight, fast and has no external dependenciees- you can use it entirely stands- you can use it entirely stand alone or integrated with our platform. It allows you to easily do feature flagging, variation assignment, and user targeting
Installation is easy:
go get github.com/growthbook/growthbook-golangHere are some simple examples of how you can use it:
// Parse feature definitions JSON (from GrowthBook API)
features := growthbook.ParseFeatureMap(jsonBody)

// Create context and main GrowthBook object.
context := growthbook.NewContext().WithFeatures(features)
gb := growthbook.New(context)

// Simple boolean (on/off) feature flag
if gb.Feature("my-feature").On {
  // show the feature
}

// Get the value of a non-boolean feature with a fallback
color := gb.Feature("signup-button-color").GetValueWithDefault("blue")
fmt.Println(color)
There are many more use cases that you can read about in our docs. As with all our SDKs, you can use them by themselves to help with feature flag rule evaluation or variation assignment, but the real value comes when you pair them with the GrowthBook API so that you can adjust the values in the JSON payload directly from the UI. For more information, please check out the Go library on GitHub or our full platform.

Goodhart's law and the dangers of metric selection with A/B testing
Experimentation has many parts: choosing the hypothesis, implementing the variations, assigning, results analysis, documentation, etc, and each of these can have their own nuances that make it complicated. Usually, choosing the metric (or metrics) that determines if your hypothesis is correct is straightforward. However, there are some situations where choosing metrics can be problematic, and surface classic issues of Goodhart’s law. Goodhart’s Law says that when a measure becomes a goal, it ceases to be a good measure. It is a close relative of Campbell’s Law, the Cobra Effect, and, more generally, Perverse Incentives. Plainly put, these laws describe conditions where there are unintended negative effects of choosing metrics.
The classic example and etymology behind “Cobra Effect” comes from colonial India, where, as the story goes, they had a problem with too many cobras. To solve the issue, the British government placed a bounty on dead cobras. This caused the locals to start breeding cobras to turn in for the bounty.
A more recent example comes from U.S. News & World Report's Best Colleges rankings. One factor in the ranking is selectivity — how many students applied vs. were accepted. This measure encouraged some schools to game the number of applicants by including every postcard expressing interest as an “application”, and rejecting more students from the Fall admission to increase their ranking.¹
These same unintended negative effects can apply to A/B testing. If you tell your teams to improve one metric, teams can be incentivized to game these metrics. As an example, consider the case where you want to increase pages per visit. One idea that would absolutely work is to paginate your content into smaller and smaller pages (and you can see real examples on many sites). You risk destroying your user experience and annoying your users, but that one metric will almost certainly increase.
Facebook is a classic example of this phenomenon. Facebook is famous for hyper-focusing on growth metrics (eg, active users and user engagement). Teams have these growth metrics as their primary performance indicators, and have bonuses that are dependent on improving them. They therefore have no incentive to improve unrelated metrics that give a more complete picture. Facebook does have teams that measure other impacts of their work, like their Integrity teams or internal researchers, but due to these conflicts of interest, they routinely fail to meaningfully address the concerns. Even when decisions are escalated, growth is put above all. This has led to them building a product that certainly has high engagement, but alienates large segments of the population, and spreads misinformation that has caused real harm in the world (see Jan 6th² or Myanmar³). This relentless focus on a single metric without regard for user sentiment is a prime example of how short-term optimization leads to long-term product degradation, effectively turning your experimentation program into a generator for dark patterns."
Assuming that you have chosen your metrics for your teams carefully to avoid the above problems, and your internal teams are good at avoiding gaming the metrics, there are still other aspects of unintended negative effects to watch out for when choosing metrics with A/B testing.
Correlation, causation, and proxy metrics
A few years ago, we ran an interesting experiment on a freemium content site, where we had a north star metric of improving revenue. The hypothesis for the experiment came from an insight from our data team, who noticed that users who used multiple types of content converted to paid at a much higher rate than normal. With this correlation in mind, our product teams set out to push more users to consume multiple kinds of content with the hope of increasing revenue. For these tests, we used metrics of both the proxy (multiple content use) and the goal (revenue). The results were fascinating and counterintuitive.
What we found after many experiments was that not only did they not increase revenue, but by pushing users to do actions they weren’t naturally inclined to do, we decreased pages per visit and actually reduced revenue. We did succeed, however, in increasing the metric of multiple content use. What we actually proved through these experiments was that this correlation was not causal. If we had just used the proxy metric of multiple content and trusted its causal relationship to revenue, we might have declared these tests a success.
Pushing on metrics can also destroy the original correlation. During the experiments, we looked back at the original correlation, but it had disappeared. We had pushed so many more unqualified users into using multiple content types without the increase in revenue that the original correlation was no longer significant.
Another common reason for using proxy metrics is that that’s all you have. You want to make sure you are testing against the metrics you need, rather than the metrics you have. Think about what the right metrics are to prove the hypothesis, and if you find yourself not being able to test against them, then you have a problem. Using proxy metrics without knowing the effect on the goal metric will mean you are not able to determine causal relationships, and it will limit the effectiveness of your experiments. Make sure your experimentation platform is not the limiting factor in running correct experiments, and run tests with the right metrics.
Conclusion
The lesson for metric selection from Goodhart’s Law is to be thoughtful with your metrics. Try not to use proxy metrics unless you are sure they are causal. Be careful with the implications of your goal metrics and consider what other metrics might also need to be measured to determine what the negative effects could be. Finally, not all experiment results are straightforward to analyze, and careful consideration is needed to determine the right conclusion for your product which is quite often nuanced. With these thoughts in mind, hopefully you can avoid some of the pitfalls of metric-driven decision-making.
[1] G. S. Morson and M. Schapiro, Oh what a tangled web schools weave: The college rankings game (2017), Chicago Tribune
[2] C. Timberg, E. Dwoskin and R. Albergotti, Inside Facebook, Jan. 6 violence fueled anger, regret over missed warning signs (2021), Washington Post
[3] J. Clayton, Rohingya sue Facebook for $150bn over Myanmar hate speech (2021), BBC News

GrowthBook 1.0.0 is here! 🎉 Feature Flagging, Chrome DevTools Extension, and more
We are thrilled to announce the release of version 1.0 of GrowthBook. We want to thank everyone who has provided feedback or made contributions over the past year and across the previous releases. We are excited for the future of GrowthBook in 2022 and beyond!
Release highlights
The major highlight of this release is the addition of feature flagging to our platform, which fits in naturally with experimentation. We are also releasing our Chrome DevTools extension, which is a huge productivity boost for engineers working with our front-end SDKs. Read about all the improvements below.
Feature Flagging 🔥
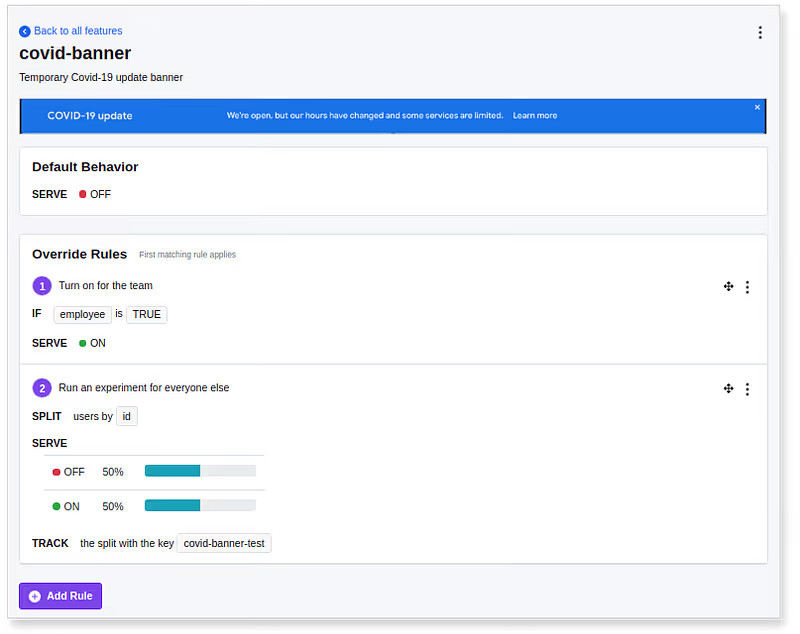
Feature flags are now a core part of the GrowthBook platform. Feature flags let engineers wrap their code with conditional checks that are remotely controlled. For example, turning a sales banner on or off, or rendering one of three different versions of a registration form. Instead of just setting the feature flag to the same value for everyone, GrowthBook lets you do advanced segmentation, gradual rollouts, and, of course, run A/B tests.
Feature flags are available today for our JavaScript and React SDKs, with the rest coming soon. Give it a try and let us know what you think!
Chrome DevTools extension 20

As part of our developer focus, we’ve published a Chrome DevTools extension. For those using our front-end SDKs (Javascript/React), this extension adds a new panel to Chrome’s DevTools that makes it easy to see what features and experiments are being used on the page and lets you toggle between states to test all the different variations of your site, all without leaving the browser. Install the GrowthBook Chrome extension here.
My reports page

Back in version 0.9.0, we launched Ad-hoc Reports, which let you dig into experiment results in a sandboxed environment. Now, we’re making those reports easier to find and manage. You’ll be able to see all reports for an experiment directly beneath the results. Plus, there’s a dedicated “My Reports” page, accessible from the user menu in the top nav, that shows all of your reports across all experiments
Import experiment improvements

You’ve been able to import experiments from your datasource to GrowthBook for a long time, but this action was hidden deep within the settings section. Now, you can import directly from the Experiments page. Just click the “Add Experiment” button, and you’ll see a list of tests to choose from.
Multiple variation detection
When analyzing experimental results, GrowthBook will now automatically detect and remove users who were exposed to more than one variation. This can happen for various reasons, such as someone logging in and out of multiple accounts. Usually, this affects only a tiny fraction of users, but if it’s happening more often than expected in an experiment, we will show a warning message above the results with more information.
Other improvements:
- Added custom SSL certificate support for Postgres/Redshift
- Support for custom delimiters for Google Analytics
Plus numerous other enhancements and bug fixes. You can read about the full list of changes here.

GrowthBook 0.9.0 — North Star metrics, ad-hoc reports, and huge performance improvements ⚡️
Just in time for the holidays, this release of the GrowthBook open source experimentation platform includes a number of the most requested features, as well as some huge performance improvements. We cut the number of executed SQL queries in half, and the ones that remain are now up to 10x more efficient! Here are some highlights:
North Star metrics
It’s common for a company to set one or two North Star metrics to rally the team behind and drive experimentation efforts. Now you can specify these important metrics in GrowthBook and see how they are improving over time and which experiments had a measurable impact on them.
Ad-hoc experiment reports
You can now create ad-hoc reports of experiment results, and adjust parameters such as dates, metrics, and even add custom SQL filters. This allows data teams to really dive into things and explore without affecting the main experiment results for anyone else. And if you need to move beyond what a report can do, you can easily export to a Jupyter notebook at any time to keep going deeper.
Experiment update frequency

We now support adjusting the update frequency for experiment results. You can choose to refresh automatically based on the age of results, a fixed Cron schedule, or even turn off automatic updates entirely. This gives you complete control over how and when queries hit your data source.
Custom metric aggregations
We’re continuing to make metrics more flexible and customizable so they can support all of your use cases. The latest feature lets you control how metrics are aggregated for each user in an experiment when they have multiple conversions. Previously, the only option was to sum the values of the conversions, but now you can do anything supported by your SQL engine (avg, median, min, max, etc).
Other improvements:
- Improved metric query performance, plus added support for SQL template variables for more advanced optimizations
- Added a cache layer for faster experiment queries
- Automatic CDN invalidation for experiment changes on GrowthBook Cloud.
Plus numerous other enhancements and bug fixes. You can read about the full list of changes here.
As always, if you have any questions or feedback, we would love to hear from you- you can reach us on Sslack.
We wish you all the best for the holiday season and a happy New Year!

New GrowthBook version (0.8.0)
We are excited to announce the release of GrowthBook version 0.8.0 which includes some large improvements and features:
All new design!
The design of GrowthBook got an overhaul from top to bottom, with new navigation, colors, and layout to improve the user experience. Try it out on our cloud version.
Up to 10x faster statistical analyses
We greatly reduced the number of round-trip requests between our TypeScript API and our Python statistics engine and optimized the data processing steps. This resulted in a huge performance gain, especially noticeable in experiments with many metrics or a high-cardinality dimension selected. We’ve seen some analyses go from 50+ seconds of processing time down to under 5 seconds.
Dimensional Analysis Improvements

We launched several new improvements to the dimensional analysis features of our experiment results:
Automatic dimensionality reduction
If you have a dimension with high cardinality (e.g., a “country” dimension with 200 possible values), GrowthBook now automatically groups values to reduce the number of statistical analyses that are performed. It will leave the top 20 values (by number of users) as-is so you can still draw useful inferences, but it will group everything else into “(other)”. This reduces the chance of seeing a false positive and makes the report easier to read.
Jupyter notebooks of dimensional breakdowns
We reworked and improved our popular Jupyter Notebook Export feature. Now you can export any experiment results page as a notebook, including dimension breakdowns. Plus, we’ve added many new columns to our Pandas dataframes to give you maximum flexibility when playing around with the data. Make sure to install the latest version of gbstats (0.2.0) from PyPi to support this new notebook format.
Mutually exclusive experiment support
As you scale up experimentation at your company, you will inevitably run into situations where you want to run two conflicting experiments at the same time. With the introduction of namespaces in our JS and React SDKs (others coming soon!), you can now safely achieve this. Namespaces work by splitting users into 1000 buckets and letting you specify the bucket range each experiment within that namespace should apply to. As long as the bucket ranges of the two experiments don’t overlap, they will be mutually exclusive. You can segment your product into as many namespaces as you want and greatly improve your test velocity!
Plus numerous other enhancements and bug fixes. You can read about the full list of changes here.

GrowthBook 0.7.0 is here!
We recently dropped version 0.7.0 of the GrowthBook experimentation platform. Here are some of the cool new features:
Experiment results over time
One of our most requested features is now live! There’s a new built-in Date dimension you can use to view how your experiment performed over time. The line shows the uplift with a shaded 95% confidence interval. You can toggle between viewing each day independently (the default) and cumulatively. Performance over time can help detect novelty or primacy effects.
Full statistics when exploring by dimensions
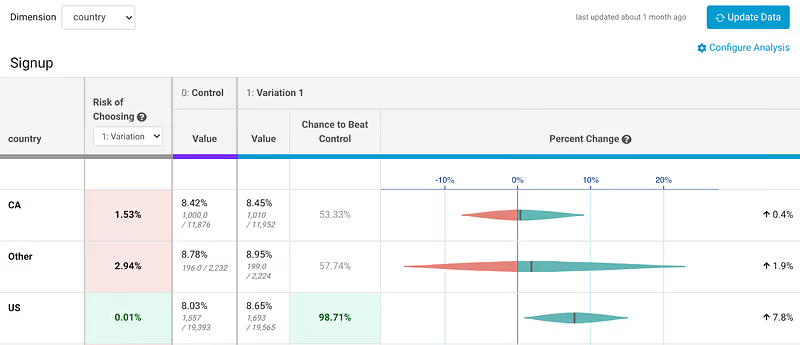
Now, when you do a dimensional analysis on the results of an experiment, you can see the full statistical results, with the chance to beat control, risk, and a percent change graph. This is enabled by default when there are fewer than 5 unique dimension values and can be toggled on manually for dimensions with more values.
Experiment Segments and SQL Filters

You can now apply a segment to an experiment to limit who is included in the analysis. For more control, you can also now add a custom WHERE clause to the experiment query. These new settings, along with existing ones that control the analysis, are now all easily accessible in a single place on the results page.
Added per metric minimum percent change

We added support for a customizable minimum percent change per metric. If an experiment fails to move a metric by this amount, we consider the change insignificant. This is related to the max percent change, where if an experiment changes a metric too much, it’s considered suspicious. These settings help encourage best practices when it comes to interpreting results.
Other improvements:
- Easily clone/duplicate a metric
- Added filtering and sorting to the metrics pages
- Added filtering and sorting to past experiments
- Added the ability to delete segments and dimensions
Plus numerous other enhancements and bug fixes. You can read about the full list of changes here.
Have a great week!
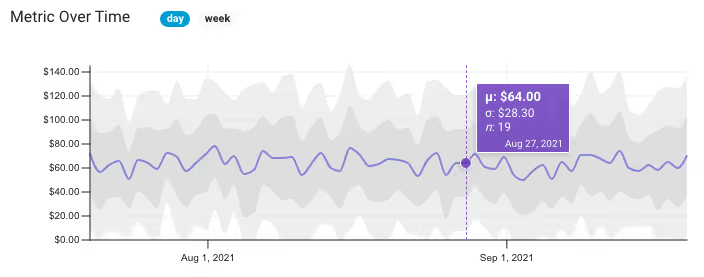
GrowthBook 0.6.0 released 🔥
Version 0.6.0 of the GrowthBook platform is out, with some cool new features!
Metric graph Improvements
We improved our metric visualizations by adding mouse-over tooltips, one and two standard deviations (shown as shaded areas), and weekly vs daily resolution. You can also filter the graph to a specific segment of users. These changes are all meant to help you better understand your data and spot potential problems.
Projects
We built support for Projects to help organize your experiments and ideas. You can create a separate project per team, section of your site, or whatever makes sense for your business. Projects are created in the settings section. We have a lot more planned for this feature in the coming months, so keep an eye out!
Import/export configuration file

There are two ways to store settings, data sources, and metrics in GrowthBook — using the built-in database or using a configuration file. We’ve made it easier to switch between these two methods with the ability to import/export from the settings page. With this change, you can now start using GrowthBook Cloud and easily switch to a self-hosted instance later (or vice versa).
Plus numerous other enhancements and bug fixes. You can read about the full list of changes here.

GrowthBook 0.5.0 released 🚀
We just launched version 0.5.0 with some new features we wanted to share.
🔥 Export experiment results as a Jupyter notebook!
Now you can export experiment results as a Jupyter notebook for you or your data teams to dig deeper into the experiment results. Simply define the connection information in the data source settings, then download from any experiment results. This feature is aligned with our philosophy of data transparency. GrowthBook has always shown you the raw queries we run to pull the data, and now you can see the rest of the analysis process within a notebook.
Per-metric data quality thresholds

We added support for more customizations on the experiment metrics. You can now set thresholds on the minimum number of conversions a metric needs before we reveal results, as well as the maximum percent change before we flag a result as suspicious.
SDK Dev mode

We added support for our development mode in both the JavaScript and React SDKs. It can now also be enabled in staging builds as well as on dev machines. This lets developers easily switch between variations, which makes building and testing experiments easy.
Other improvements:
- You can now import running experiments from a data source
- The view queries button now shows the exact rows returned from the database before any post-processing
- GrowthBook stats engine now available as a standalone Python package on PyPi: gbstats
- Moved the JavaScript and React SDKs to the main GrowthBook repo
- Improved documentation around new data quality checks
Bug fixes
- Fixed broken number inputs in forms
- Fixed error when sending invite emails to teammates
- Fixed division bug for Postgres/Redshift when metric values are integers
- Fixed problem when rendering modals inside a portal to fix z-index issues

GrowthBook 0.4.0 & August update
August was quite a month for GrowthBook! We’re closing in on 1500 GitHub Stars, making us one of the most popular open source A/B testing platforms.

We’re also continuing to add many highly-requested features to the platform, based on your feedback in our Slack channel and on GitHub, and we just released version 0.4.0! Here are the major features of the 0.4.0 release:
Per-metric risk thresholds
There’s a trade-off between low. Now you can decide this tradeoff on a per-metric basis. So you can reduce risk and take your time with Revenue while moving quickly and accepting more risk with less important metrics.
Experiment-level dimensions
GrowthBook has always had the ability to define user-level dimensions to drill down into experiment results. But that didn’t work great for things like “browser” or “traffic source” since a user may use multiple devices or have many different sessions on your site over time.
Now GrowthBook also supports exploring risk and ending an experiment more quickly, with experiment-level dimensions for drilling down by these point-in-time attributes. All you need to do is select additional columns in your experiment query. Learn more about dimensions
Export configurations

Back in version 0.3.0, we added support for configuring self-hosted GrowthBook using a config.yml file instead of through the UI. This made it easier to version control and share configuration between environments. With the 0.4.0 release, you can now export settings that were created in the UI to a config.yml file at any time.
Detect variation ID mismatches
GrowthBook now detects and warns you when the variation IDs defined for an experiment differ from those returned from the database when fetching results. This is really useful for identifying typos and bugs in your data.
Custom rules when importing past experiments
When importing past experiments from a data source, GrowthBook applies a bunch of rules to make sure we keep the list of experiments clean. One of those rules requires a minimum runtime of 5 days in an attempt to exclude experiments that were stopped early. You can now customize this minimum length as needed.
Have ideas for other import rules or tweaks to how this feature works? Let us know!

GrowthBook 0.3.0 is here 🚀
We just launched a new version of our open source A/B testing platform. Here are the new features and changes.
Don’t forget to follow us on Twitter and give us a star on GitHub.
Configuration by YAML files
GrowthBook now supports configuration via YAML files, which will make deployments and updates between dev and production easier and allow you to manage configuration version control.
Custom metric conversion windows
GrowthBook now lets you customize the conversion windows per metric. This is useful if you have long delays between interaction events and conversion events. It is also nice to have your conversion windows in your A/B testing results to match conversion windows used in other reports.
S3 file support

You can now store uploaded files directly in Amazon S3. There are new environment variables for self-hosted installations to connect to your S3 bucket to allow you to use S3 instead of local storage.
Customized experiment update frequency
By default, GrowthBook updates experiments every 6 hours. You can now customize this frequency in the environment variables on self-hosted installations. Of course, experiments can still always be refreshed by using the ‘update’ button.
Connect to Postgres and Redshift with SSL
Connections to Postgres and Redshift now have an option to require SSL on the connections.
Other improvements and bug fixes
- Various Clickhouse bugs — date function names, non-equi joins, json response format, stddev function 3644548 0034530
- Broken yarn install on OSX c71b86a
UnhandledPromiseRejectionWarningon failed SQL queries 83219adCannot read property '0' of nullon experiment results 0ac0fb5- Docs typo
We’d love to hear from you and get your thoughts and ideas. Drop us a line via email, Slack, or Twitter.

GrowthBook 0.2.3 shipped 🚀
We just launched a new version of our open source A/B testing platform, GrowthBook. We are excited to share the new features and changes.
Don’t forget to follow us on Twitter and give us a star on GitHub.
PrestoDB & TrinoDB support

You can now select PrestoDB and TrinoDB amongst the ever-growing lists of supported data sources. If you have any requests, just let us know.
Improved display of ‘risk’
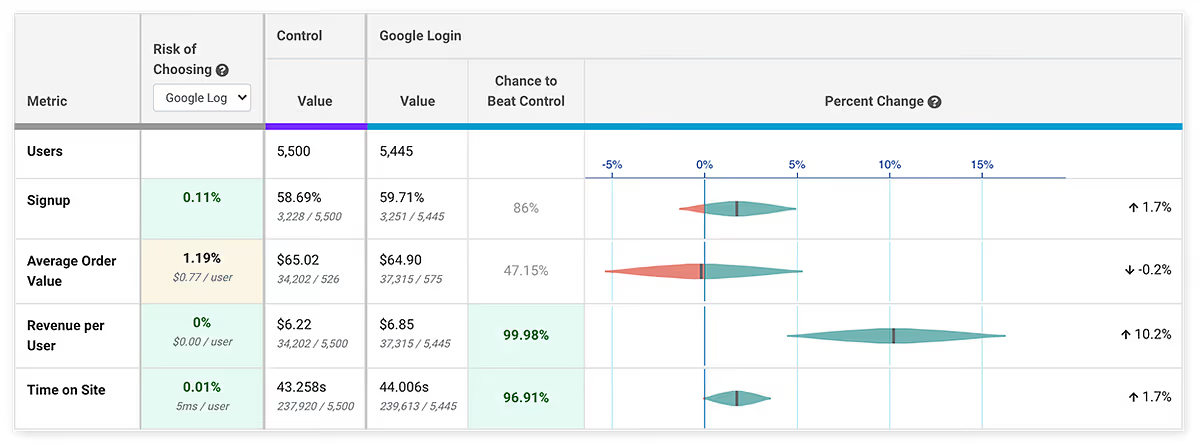
We improved the user experience for showing the Bayesian risk in results. You can learn more about the risk metric in our blog article. Risk shows you what impact choosing a variation will have on a metric, given a worst-case scenario. In the above example, if you chose the Google Login variation, the risk to the signup metric is .1%, even though this metric is not significant yet. You might be okay to take that risk and call the test without having to wait for significance on the metric. This allows you to move faster and test more.
Metric improvements — groups and guardrails
We made some major improvements to the handling of metrics. You can now tag metrics, which helps you organize and search for them. This is particularly helpful when you start adding a lot of metrics. Tagged metrics can be used as groups, and be easily added to experiments. For example, you could add tags to metrics that you want all sell page experiments to measure, under ‘sell page’, and easily add these metrics to all sell page experiments.
We also added support for guardrail metrics, which are metrics you want to keep an eye on and make sure they don’t degrade, but not specifically trying to improve. For example, many companies use page load time, crashes, error rate, or support requests as a guardrail metric to make sure they don’t increase.
Other improvements and bug fixes
- Better logging and error messages
- Allow customizing snowflake role
- Bug fix: variationIdFormat select box not working
- Bug fix: switch from UNION to UNION ALL in queries for better support
- Bug fix: use redshift default for SQL formatting to properly handle table names with dashes
We’d love to hear from you and get your thoughts and ideas. Drop us a line via email, Slack, Twitter, or just reply to this email.

Appetite for risk — A/B testing in fast-paced environments
Rigorous statistics are often at odds with the needs of modern, product-driven companies to move fast and ship fast. Statistics is all about probabilities, and the more data, the more accurate the predictions. Product-led organizations are all about building the smallest part of a project that can add value as fast as possible, and then iterating quickly, looking for signals of product-market fit. The Venn diagram of these two areas overlaps with A/B testing, but this creates a tension between the statistics and the need to move fast.
If we all had enormous amounts of traffic to test against and infinite time to do these tests, we would make almost perfect decisions. Realistically, the pressure to ship fast often leads us to make calls on less-than-perfect data. These pressures can happen when metrics appear to be doing especially well or poorly, or if there are time constraints. You can, of course, stop a test whenever you like, as long as you’re aware of what this does to your statistics.
User behavior data has a lot of random variation, and this creates a noisy signal (it’s also a reason why trend data — data over time — is largely meaningless in A/B testing contexts). If samples are small, you’re more likely to be looking at noise than if samples are large. As the sample size increases, this noise is averaged out. Furthermore, if you’re using a Frequentist approach, your statistics only become actionable when the predetermined sample sizes are reached — otherwise, you’re falling into the peeking problem, the subject of many articles. If you’re using statistics that are less susceptible to peeking, like Bayesian or Sequential, you can peek and make decisions.
In all these contexts, some data is absolutely better than no data, but without finishing a test, you increase the odds of picking the wrong variation, and you lose the resolution on the most probable outcome. In short, you increase the risk of making a decision. The question that every experimentation program should be asking then is, what is your appetite for risk?
Risk
Most A/B testing statistics give you the chance to beat baseline/control as the probability that your variation is at least better than other control variation. But this measure gives no indication as to the amount better or worse it will be. If you’re forced to make decisions without perfect data, wouldn’t it be great to have some indication of what risks you’re taking? You would like to know if you call the test now, and you’re wrong about which variation you implement, what the likely negative impact would be. The good news is that Bayesian statistics give us just such a measure.
This risk, also known as potential loss, that Bayesian statistics provide can be interpreted as “When B is worse than A, if I choose B, how many conversions am I expected to lose?” It can replace the P-value as a decision rule, or stopping rule for A/B testing — that is, you can call your tests if the risks go below (or above) your risk tolerance thresholds, instead of using other values. If you want to read more about how risk is calculated, you can read Itamar Faran’s excellent article: How To Do Bayesian A/B Testing at Scale.
Growth Book recently implemented this same risk measure (with the help of Itamar) into our open-source A/B testing platform. This measure empowers teams to call tests earlier and be aware of the risks they are taking in doing so.

In the above example, both metrics are up, but only have about a 78% chance of beating the control, well short of the typical 95% threshold. However, neither one appears to be very risky. If you stop the test now and choose the variation and you’re wrong, your metrics would only be down by less than a percent. Depending on your business, that may be good enough, and you can move on to the next experiment without wasting valuable time.
The combination of Chance to Beat Control, Risk, and a Percent Change confidence interval gives experimenters everything they need to make decisions quickly without sacrificing statistical accuracy.

Ready to ship faster?
No credit card required. Start with feature flags, experimentation, and product analytics — free.

