

Uncover opportunity, understand your users
Turn data into insights that anyone on your team can explore and act on with warehouse-native analytics software.
Trusted by 3,000+ companies worldwide


Move from data to product decisions, faster
Structure explorations
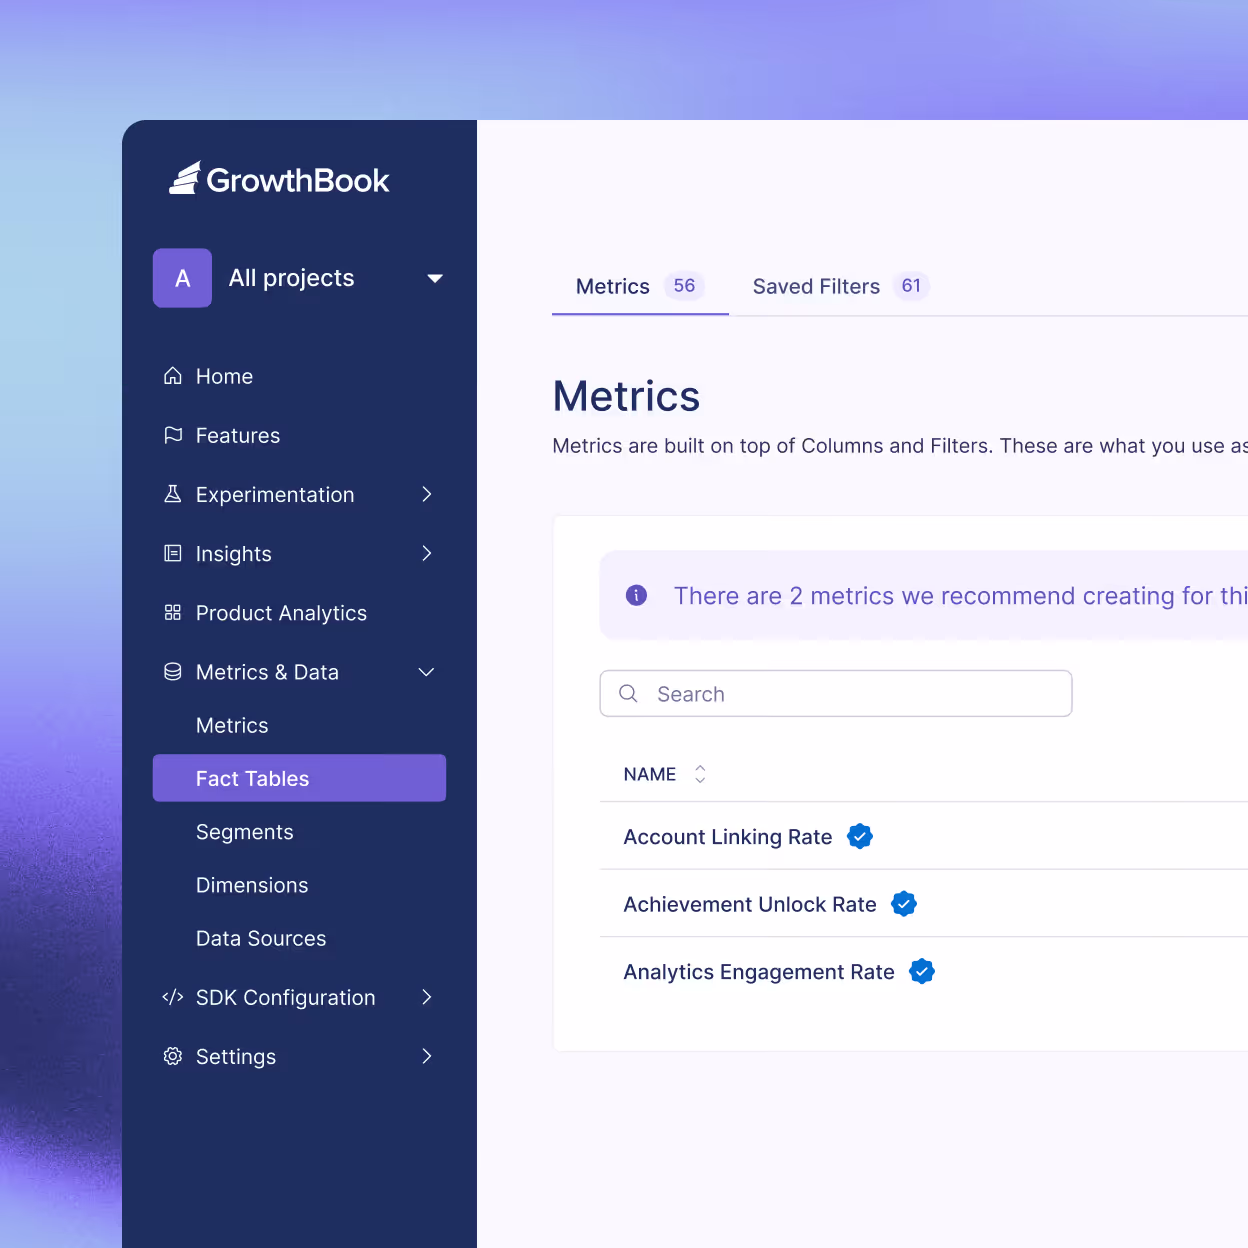
Shared metrics library
AI Data Analyst beta
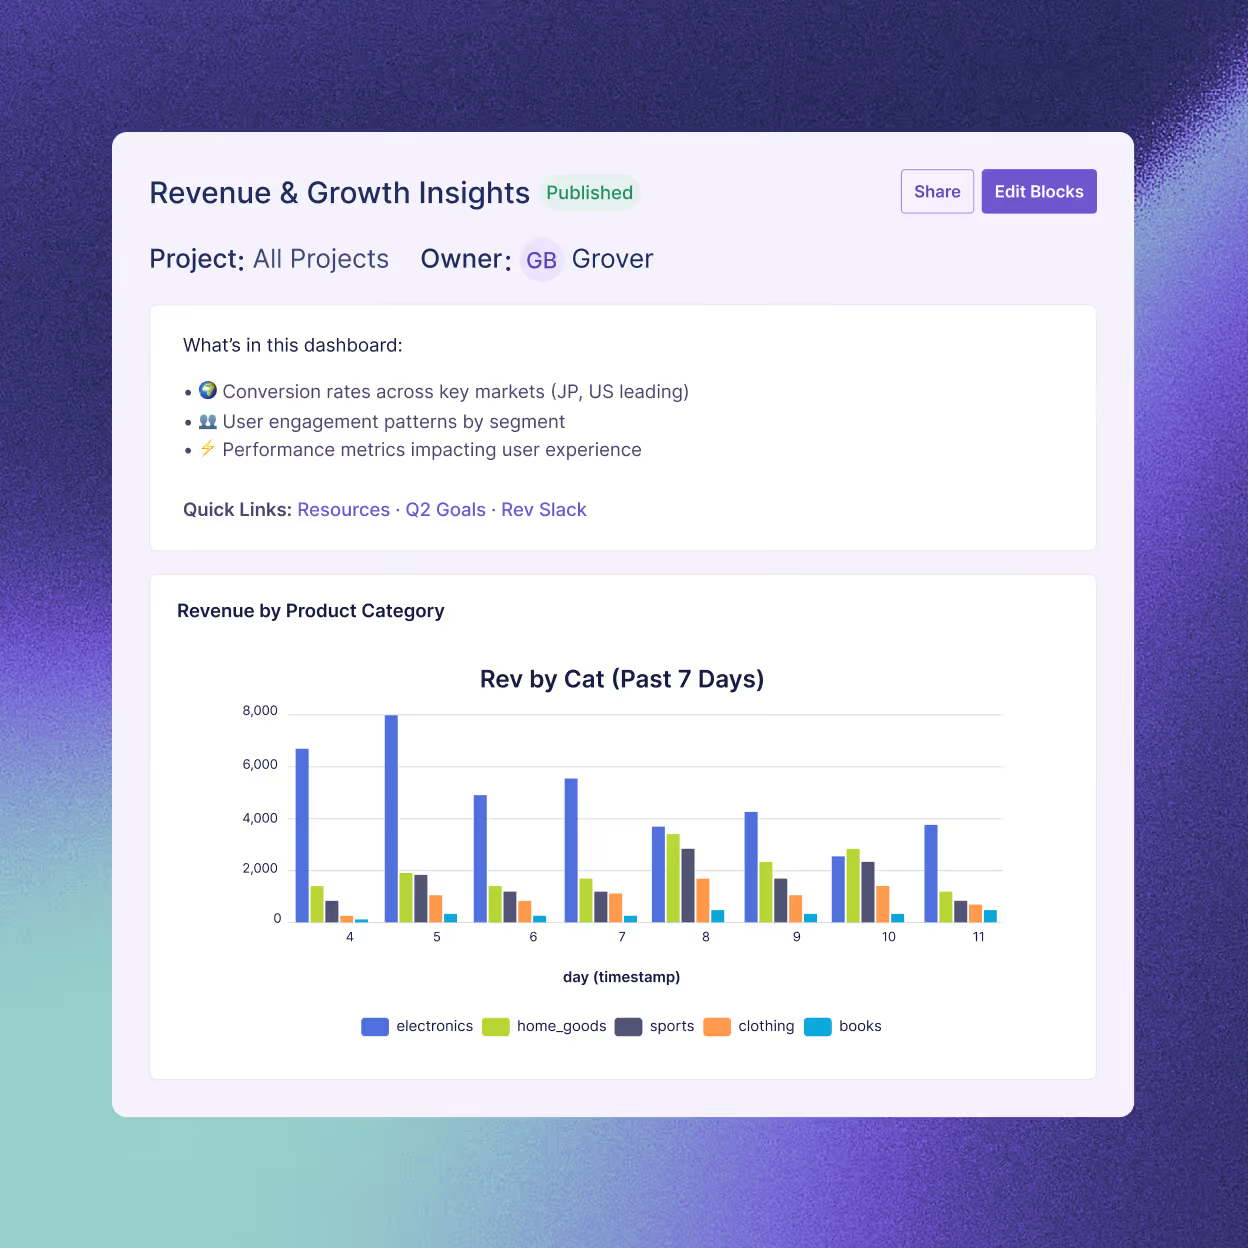
Shared dashboards
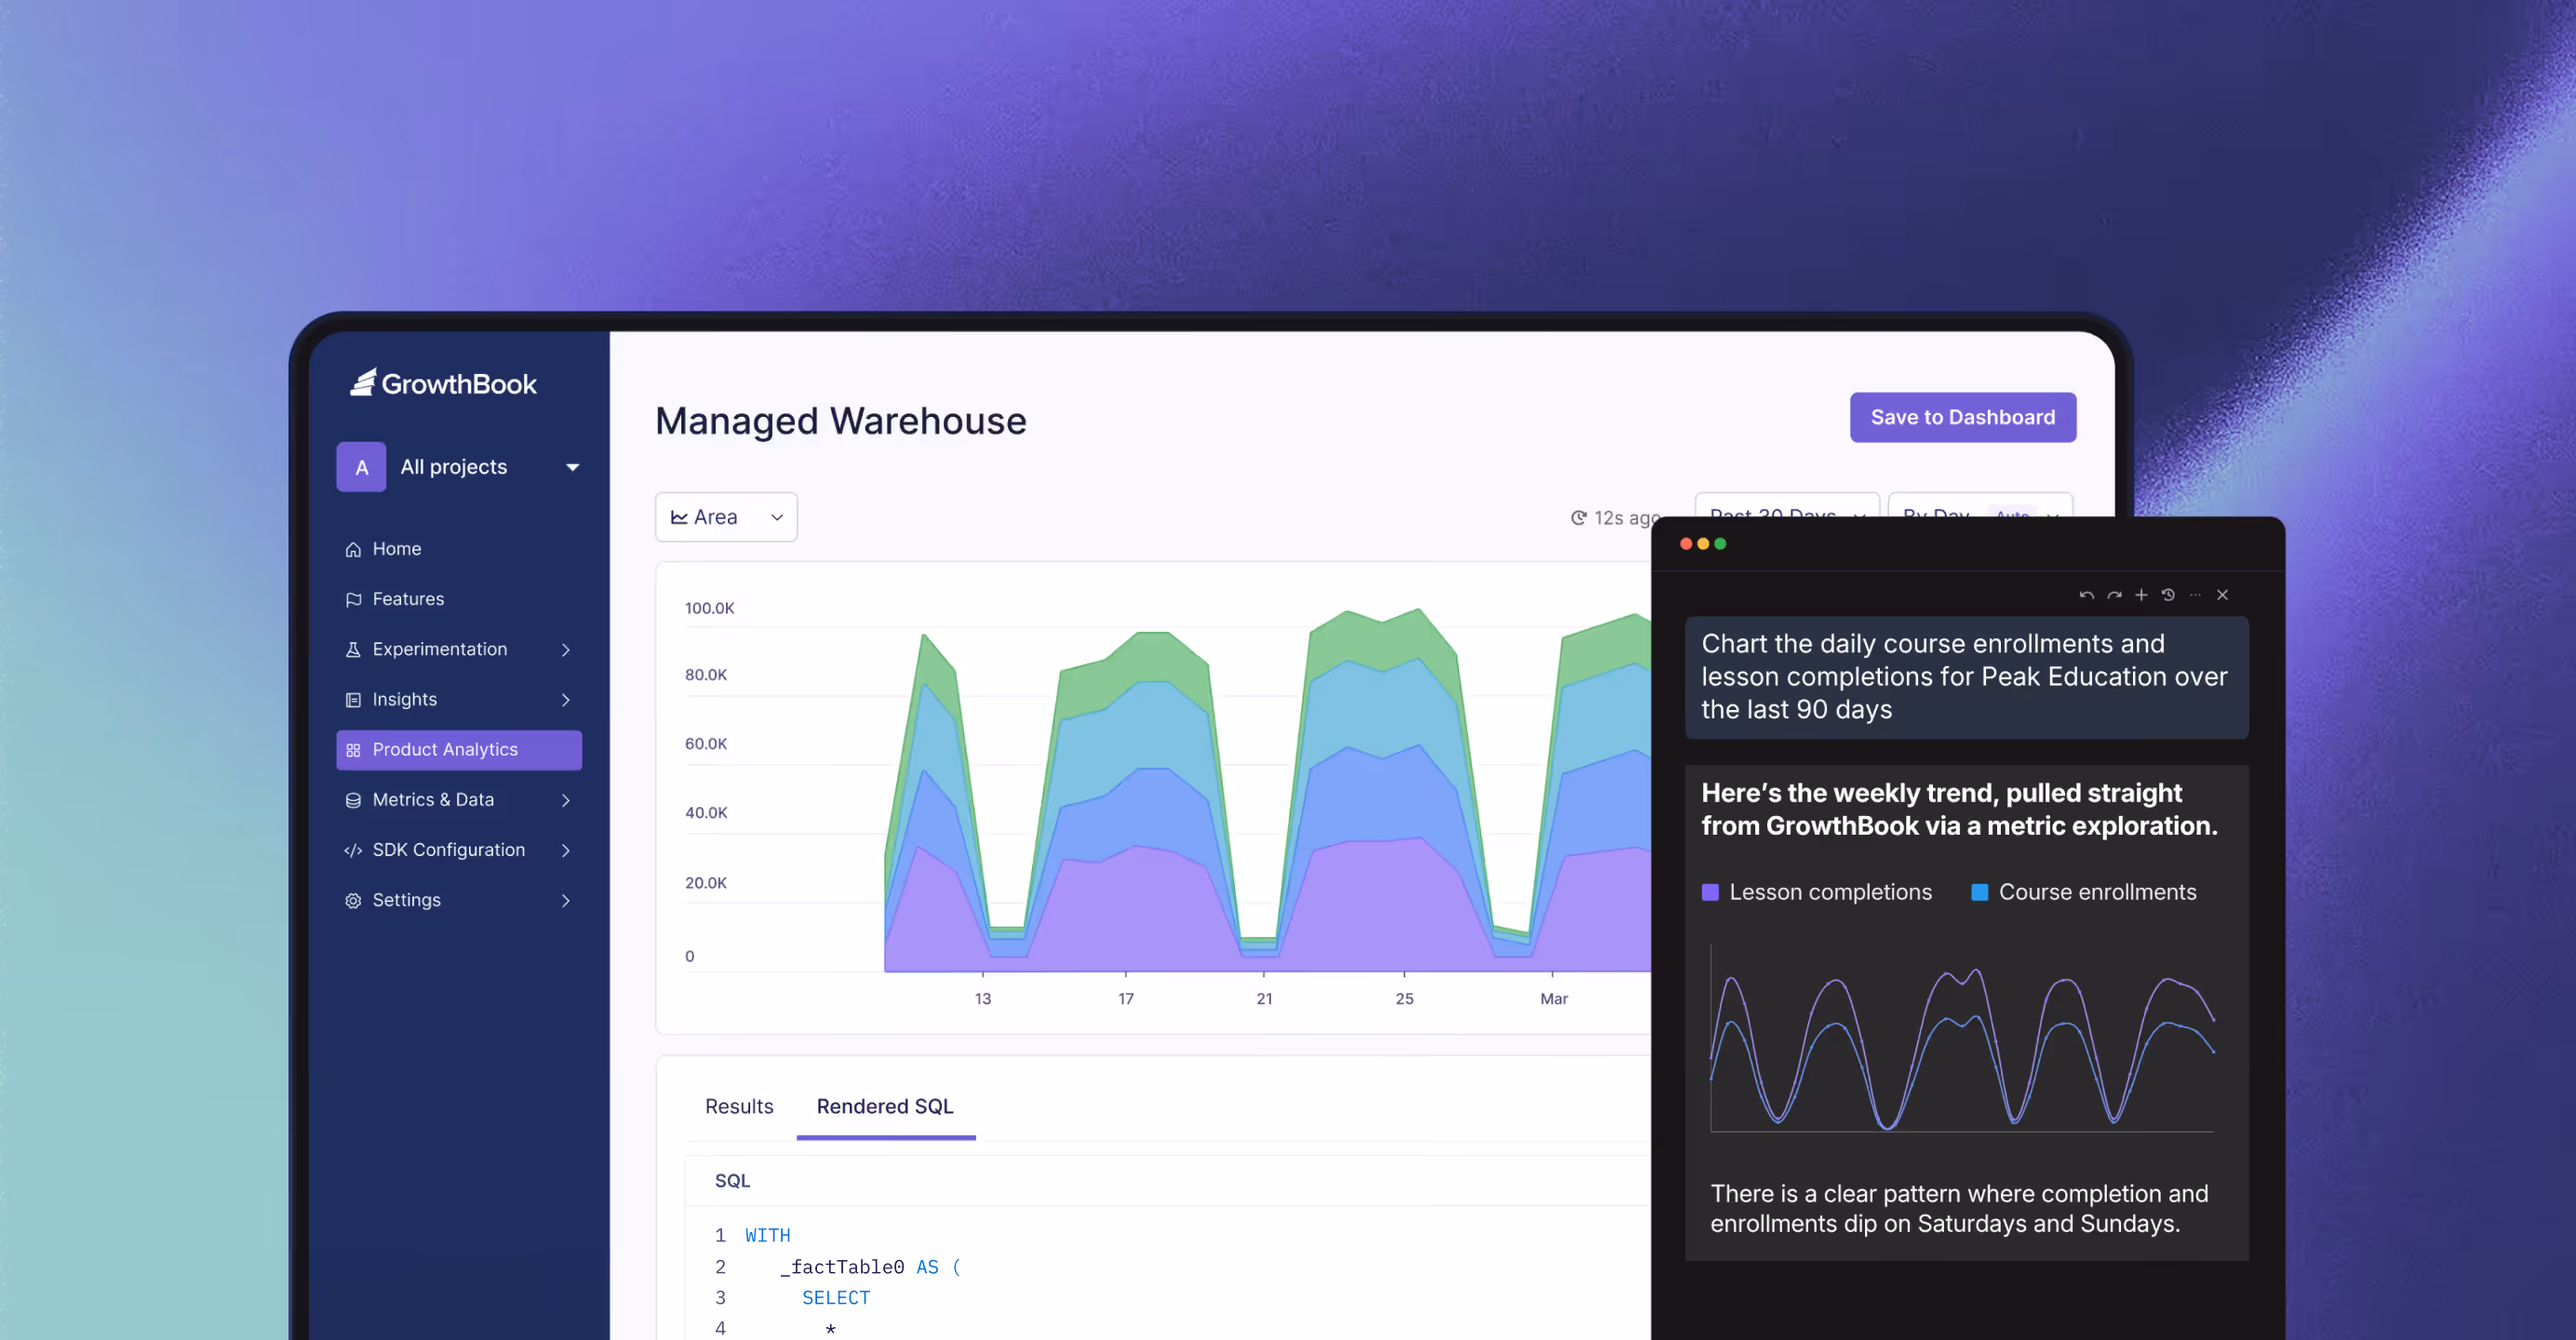
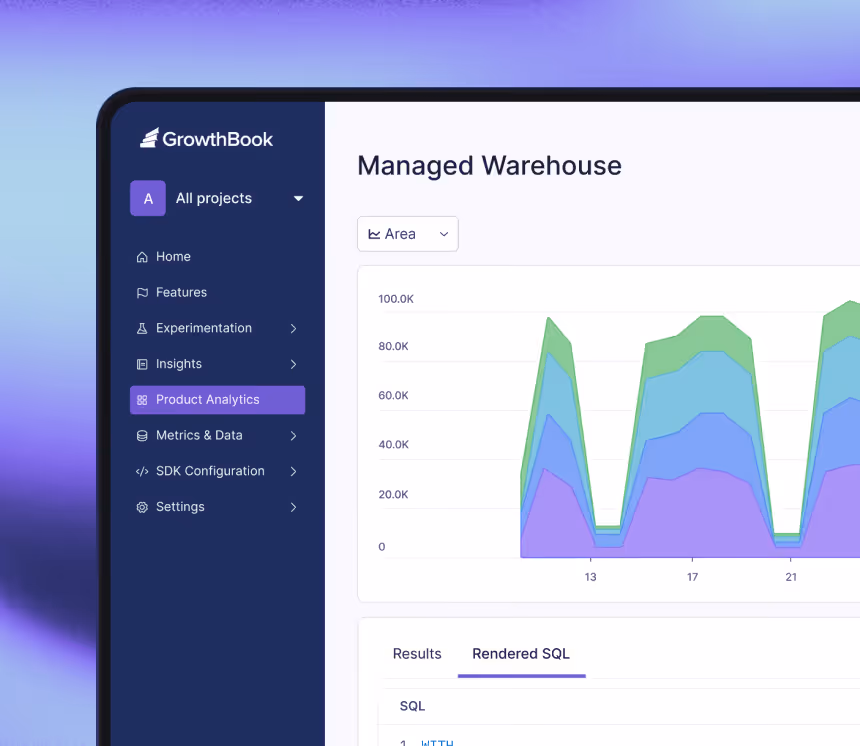
GrowthBook Managed Warehouse
Skip the setup. Start learning. No need to connect your data warehouse.

Build consensus and trust with product analytics
Explore all your data for insights
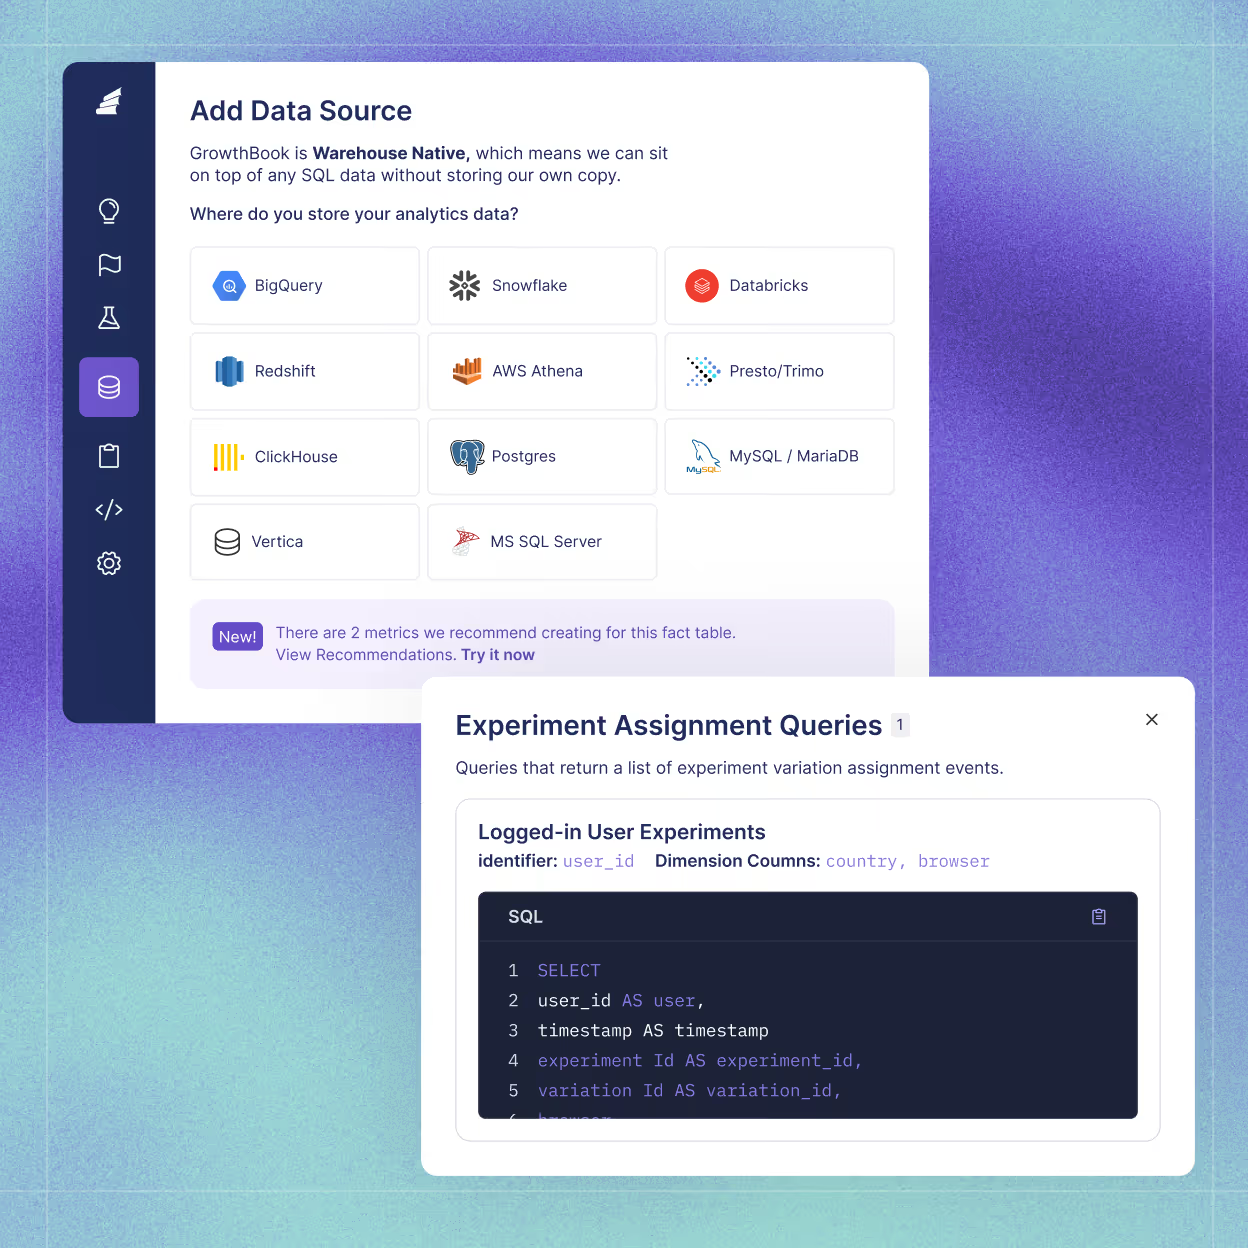
GrowthBook is warehouse-native for analyzing your data where it lives. No data silos and reconciliation headaches. Just a single source of truth. Explore business and product data with experiment data to better understand your users. Write your own SQL to access any slice of data in your warehouse.
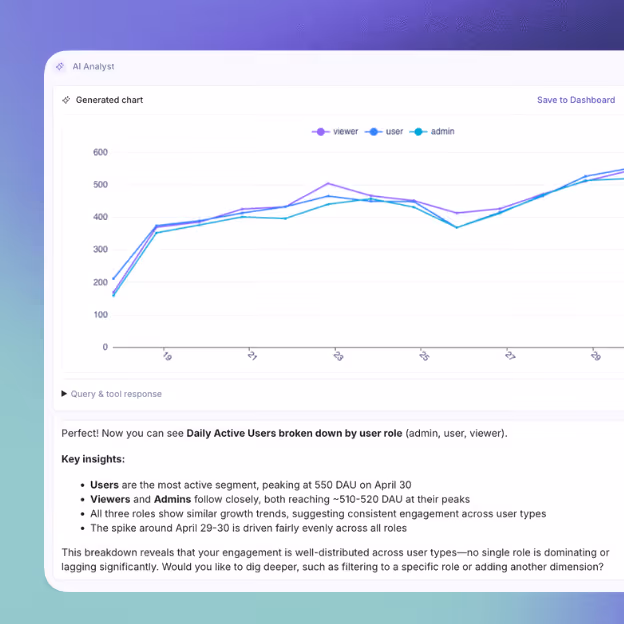
Talk with your data AI Data Analyst beta
Ask questions in conversation to generate charts from the metrics you’ve already defined in GrowthBook. Iterate by replying and save your visualizations to shareable dashboards.
Align your team for faster decisions
Easily share dashboards with your team to drive alignment and broaden understanding about user behavior. Create charts that bring your data to life, then share them with your team to align decisions and track the impact of product changes. When everyone sees the same story from the data, it’s easier to make confident decisions.
Democratize your data-driven product development
Anyone with an idea can explore the data and act on it. Use the same metrics library to analyze who was impacted, how behaviors changed, and where unintended effects occurred. Develop and test hypotheses that guide product decisions according to user behavior.
GrowthBook open-source platform
GrowthBook’s modular design works on top of what you have, or replaces what’s not working.
Integrates with your tech stack. Analyze your data where it lives. SQL visibility.
Same product, same features. On cloud or fully self-hosted.
No migration required. No changing tools. We work with your tech stack.

Manage flags, run experiments, and query product analytics from Claude Code, Cursor, VS Code, and any MCP client.

Predictable pricing, flexible plans for every team
Explore free and tiered pricing and plans for both cloud and self-hosted deployments.
One platform for modern product development
Warehouse-native Experimentation
Robust Feature Flags
“GrowthBook gave us a modern experimentation and release platform that actually fits how Dropbox works. We can run analytics directly on our data lake, roll features out safely in stages, and support teams across different stacks without duplicating data or tooling.”
"A/B testing GenAI features has been an absolute game changer. Experimentation went from feeling like a speed bump to becoming a safety net."
“People only see the wins, but there’s actually greater value in avoiding losses. We’ve stopped changes that could have cost millions.”
“GrowthBook has changed the way we think about experiments... It allowed us to uplevel our code, speed up decision-making, and focus on what we do best.”

"Experimentation is core to how Fyxer runs. GrowthBook gives us a way to measure what’s happening, learn from wins and losses, and avoid shipping every risky idea to 100%."
“Experimentation showed what customers actually do rather than what we assume they’ll do.”
“Being able to turn a feature on and off with a flip of a switch is fantastic... That’s so much easier than having to do a deploy or a roll-back.”

“We don’t need any code changes, we don’t need an app release. We just configure the new tests and launch right away.”

"We are always experimenting now. It’s a natural part of product development. This is due to GrowthBook and the ease of usage both in the UX and in the seamless integration with Snowflake/DWH."

"GrowthBook's results speak for themselves. Every time we do a test, we see benefits for our audiences and our partners. These posters are our one shot, and we wouldn't want to fly blind."

“GrowthBook lets us build experiments exactly how we want. The ability to target based on culture and geography, as granular as needed, is a major win for us.”
"A/B testing GenAI features has been an absolute game changer. Experimentation went from feeling like a speed bump to becoming a safety net."
"Experimentation is core to how Fyxer runs. GrowthBook gives us a way to measure what’s happening, learn from wins and losses, and avoid shipping every risky idea to 100%."
"GrowthBook's results speak for themselves. Every time we do a test, we see benefits for our audiences and our partners. These posters are our one shot, and we wouldn't want to fly blind."
FAQs
A product analytics platform is software that helps product teams understand how users interact with their product: from tracking behavior and measuring feature usage to surfacing trends that inform what to build next. Unlike basic web analytics, product analytics connects user actions to business outcomes, giving teams the data they need to make confident product decisions.
Traditional web analytics tools like Google Analytics track page views, sessions, and traffic sources. They answer "how many people visited?" Product analytics goes deeper: it answers "what did users do, why did they do it, and what happened to the metrics we care about?" GrowthBook's product analytics is also warehouse-native, meaning all your event data stays in your own data warehouse and is queryable with SQL, rather than living in a third-party system you can't fully inspect.
It depends on your product, but most teams track engagement metrics (active users, session depth, feature adoption), retention metrics (return rate, churn signals), and conversion metrics (funnel completion, goal events). With GrowthBook, you define metrics in SQL once and reuse them across both analytics and experimentation — so the same metric that powers your dashboard also powers your A/B tests, with no reconciliation headaches.
Product analytics replaces gut feel with evidence. When everyone on the team sees the same dashboards built from the same metrics definitions, it's easier to align on what's working, what isn't, and what to prioritize next. GrowthBook is designed to make that data accessible to everyone. Our visual explorer, shared dashboards, and AI Data Analyst let anyone query the warehouse without writing code.
Warehouse-native means GrowthBook analyzes your data where it already lives, rather than copying it into a separate system. There are no data silos, no reconciliation headaches, and no paying twice for the same data. You also get full SQL visibility into every metric calculation. Because your analytics and experimentation data share the same warehouse, you can explore experiment results and product behavior together in a single source of truth.
Yes. The Visual Explorer lets anyone build charts from metrics and fact tables without writing SQL. Shared dashboards and pivot tables can be distributed across the team. And the AI Data Analyst (Beta) handles plain-language questions against the same metric definitions. Engineers and data scientists who want full control can still write their own SQL and define custom metrics directly in the warehouse.
Tools like Snowflake Cortex, Databricks Genie, and Hex Magic work against your whole warehouse — any table, any join. GrowthBook Product Analytics works from the metrics, fact tables, and experiment data you've already defined for experimentation. Charts, dashboards, and conversational answers all come from the same trusted source, not arbitrary SQL against unfamiliar tables. Narrower scope, more reliable results.
Yes, your AI agent can query GrowthBook product analytics. Every exploration is addressable through the GrowthBook MCP server and REST API. Agents working in Claude Code, Cursor, VS Code, or any HTTP client can deploy a feature, run an experiment, and read the analytics result in one continuous workflow — with the same metric definitions, the same permissions, and the same audit trail as your team.
Ready to ship faster?
No credit card required. Start with feature flags, experimentation, and product analytics — free.

