

Measuring A/B test impacts on website latency: using quantile metrics in GrowthBook

Traditional A/B testing compares the mean of a treatment variation to the mean of a control variation. However, for many features or improvements, the average effect may be less important than the impact on outliers. For example, many times the goal of a feature is to reduce request latency for the slowest requests rather than just the average request latency. In such cases, quantile testing can be the solution, and GrowthBook now supports it for Pro and Enterprise customers.
This content is also in video format if desired.
What is quantile testing?
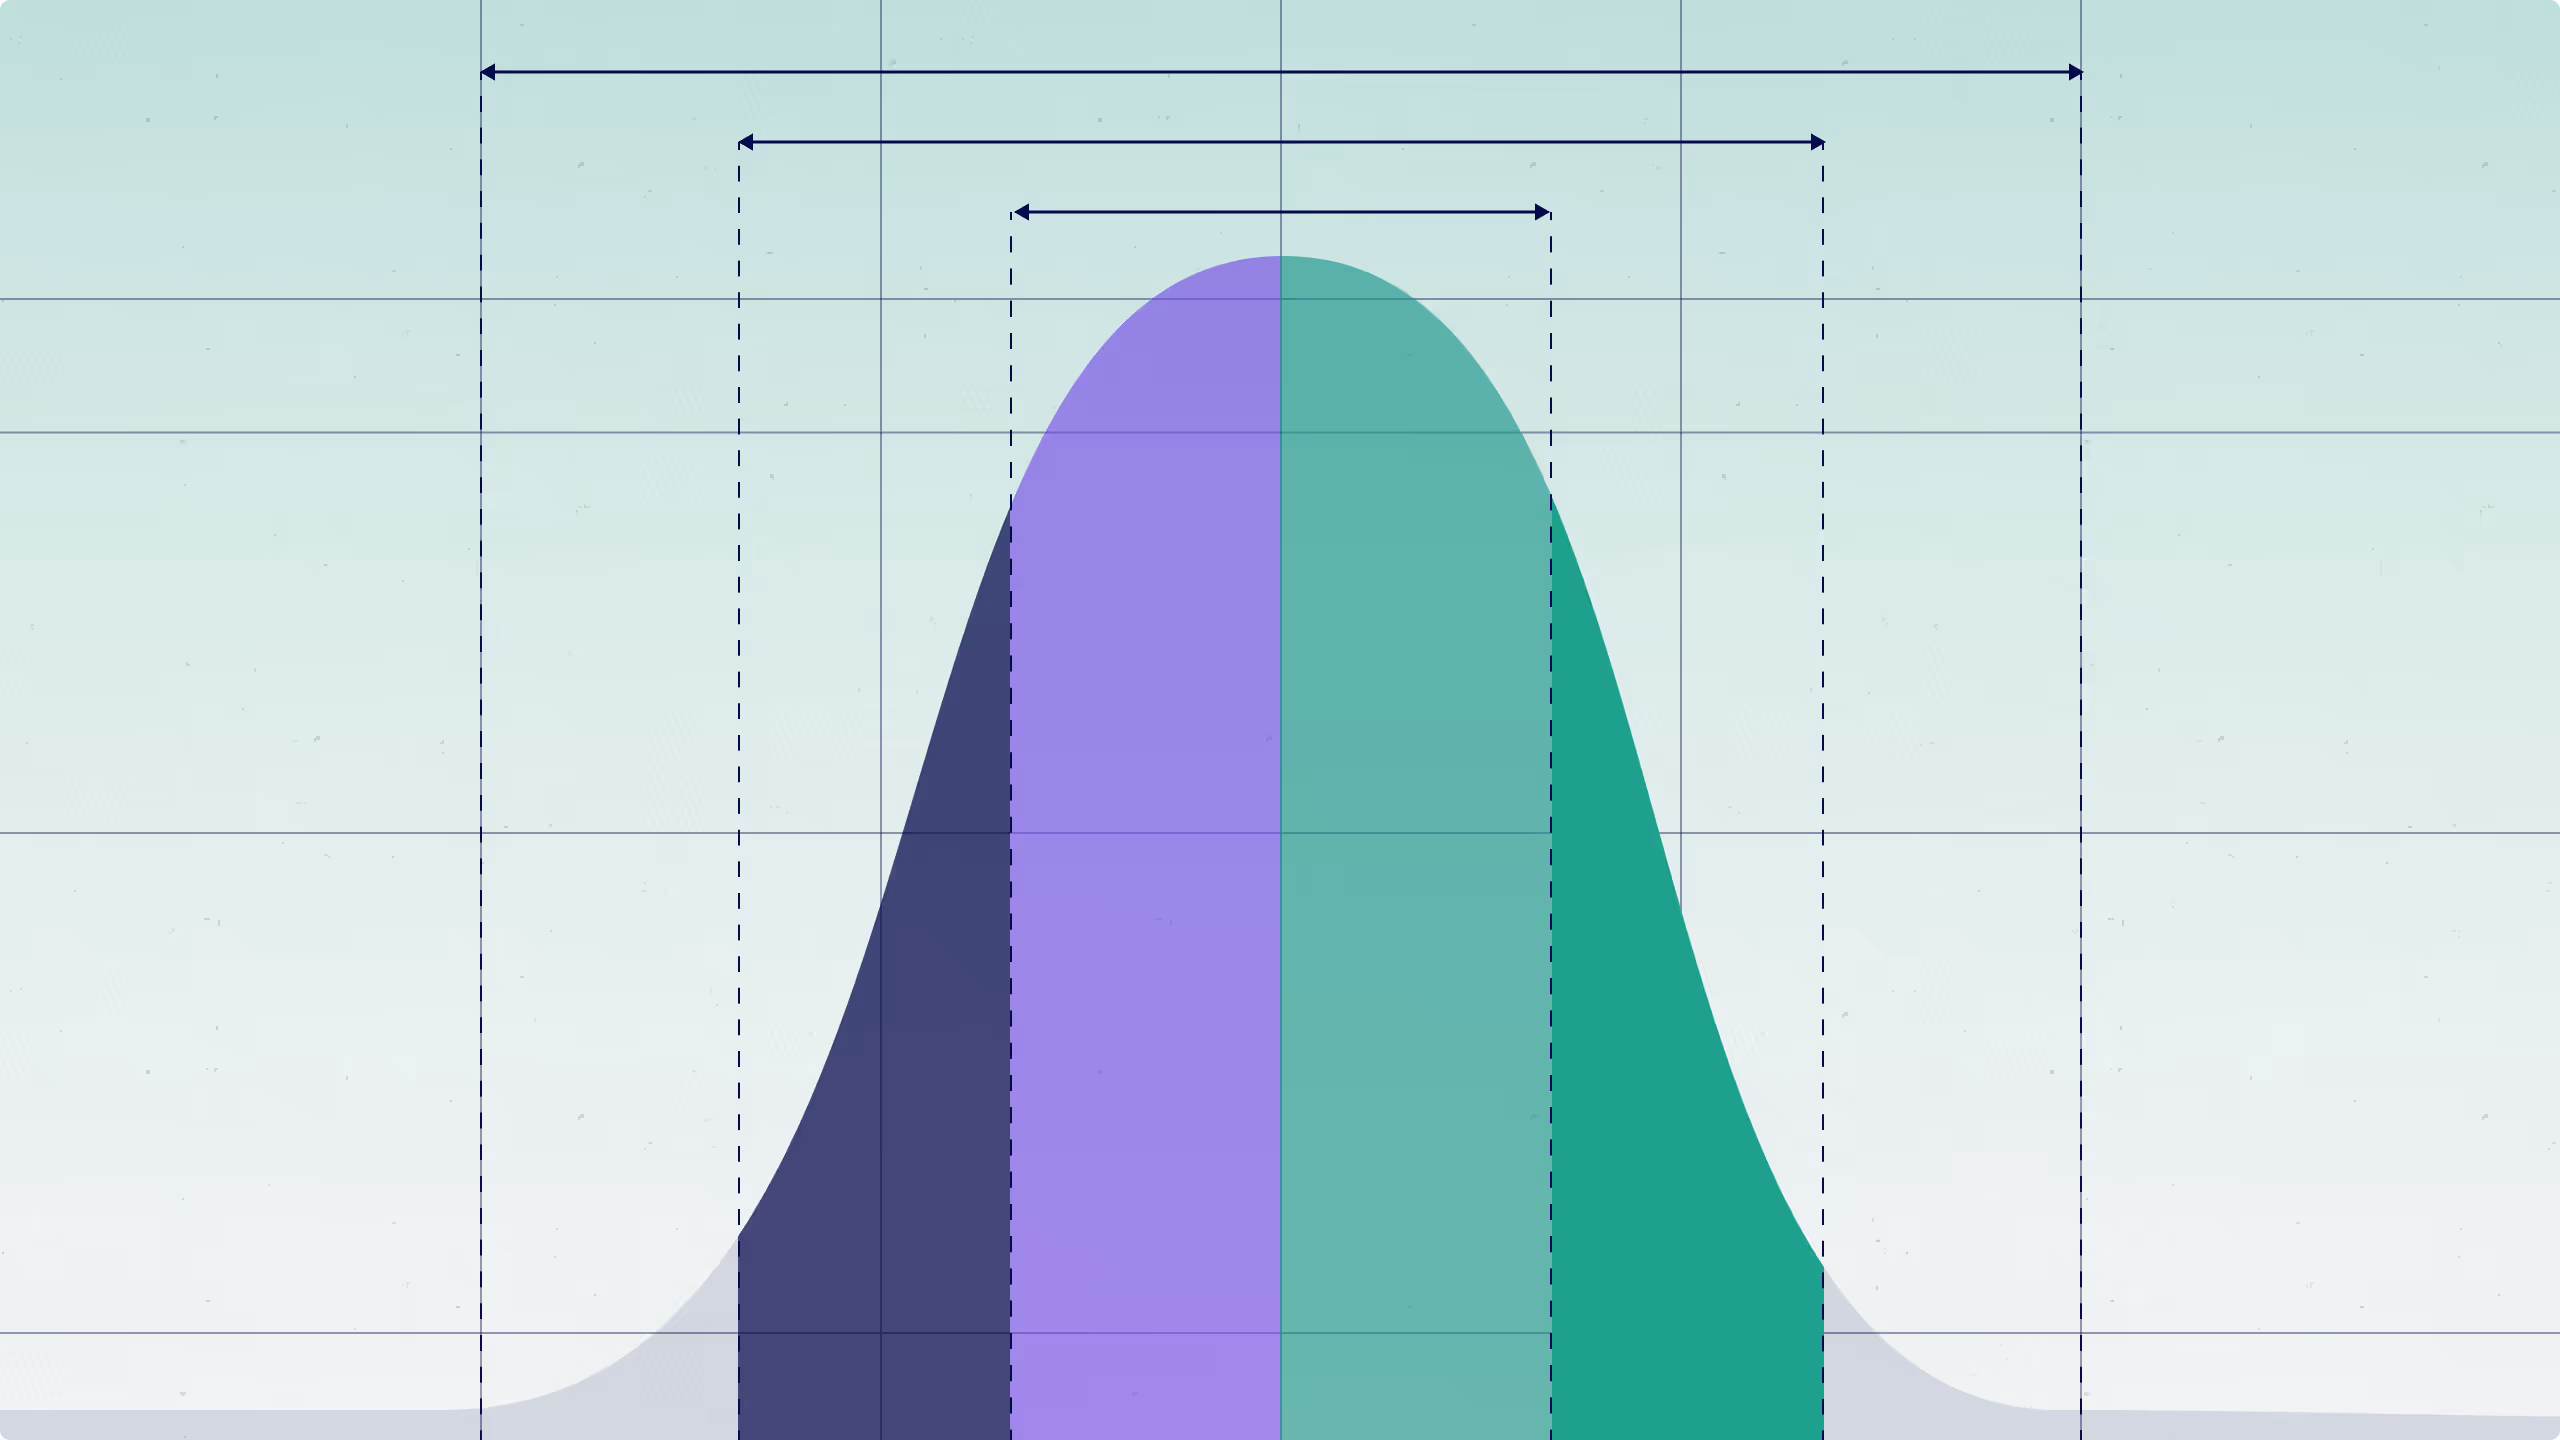
In quantile testing, quantiles are compared across variations. For example, you may want to compare P99 web page latency across different variations, where P99 is defined as the 99th percentile (i.e., the value below which 99% of website latencies fall). This is in contrast to mean testing, where the population means of variation A is compared to the population mean of variation B.
Setting up your quantile metric
Quantile metrics are built on Fact Tables.
- Create a Fact Table that points to your data warehouse that has one row per request with a column for the latency of that request.
On the left-hand side of the home page, select Fact Tables (located under Metrics and Data), and then select Add Fact Table. Your Fact Table will have a few key columns such as session_id, user_id, timestamp, and latency.
Below is the SQL code for the Fact Table.
SELECT
  user_id,
  timestamp,
  latency
FROM
  requests
- Create a quantile metric that builds a quantile for that latency column
After creating your Fact Table, click Add Metric on the page for your Fact Table. Select Quantile for Type of Metric.
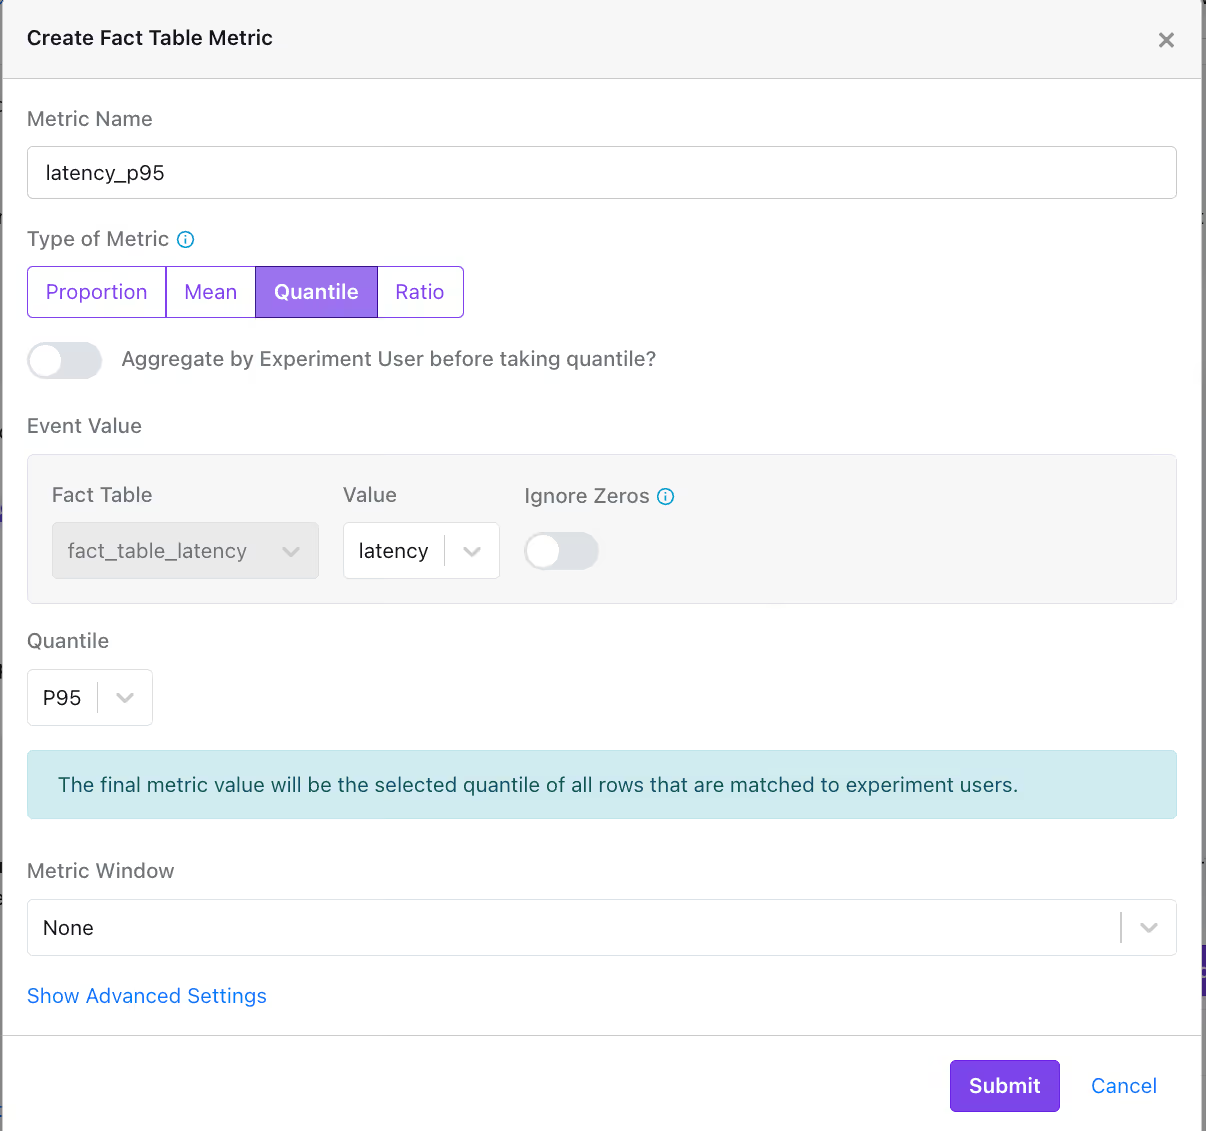
You can create a mean metric for the average latency, as well as different quantile metrics, such as P99.
Running your quantile test
Now that you have created your metrics, add them to your experiment just like any other metric. Quantile metrics can be analyzed alongside mean metrics. Below are your quantile metric results.
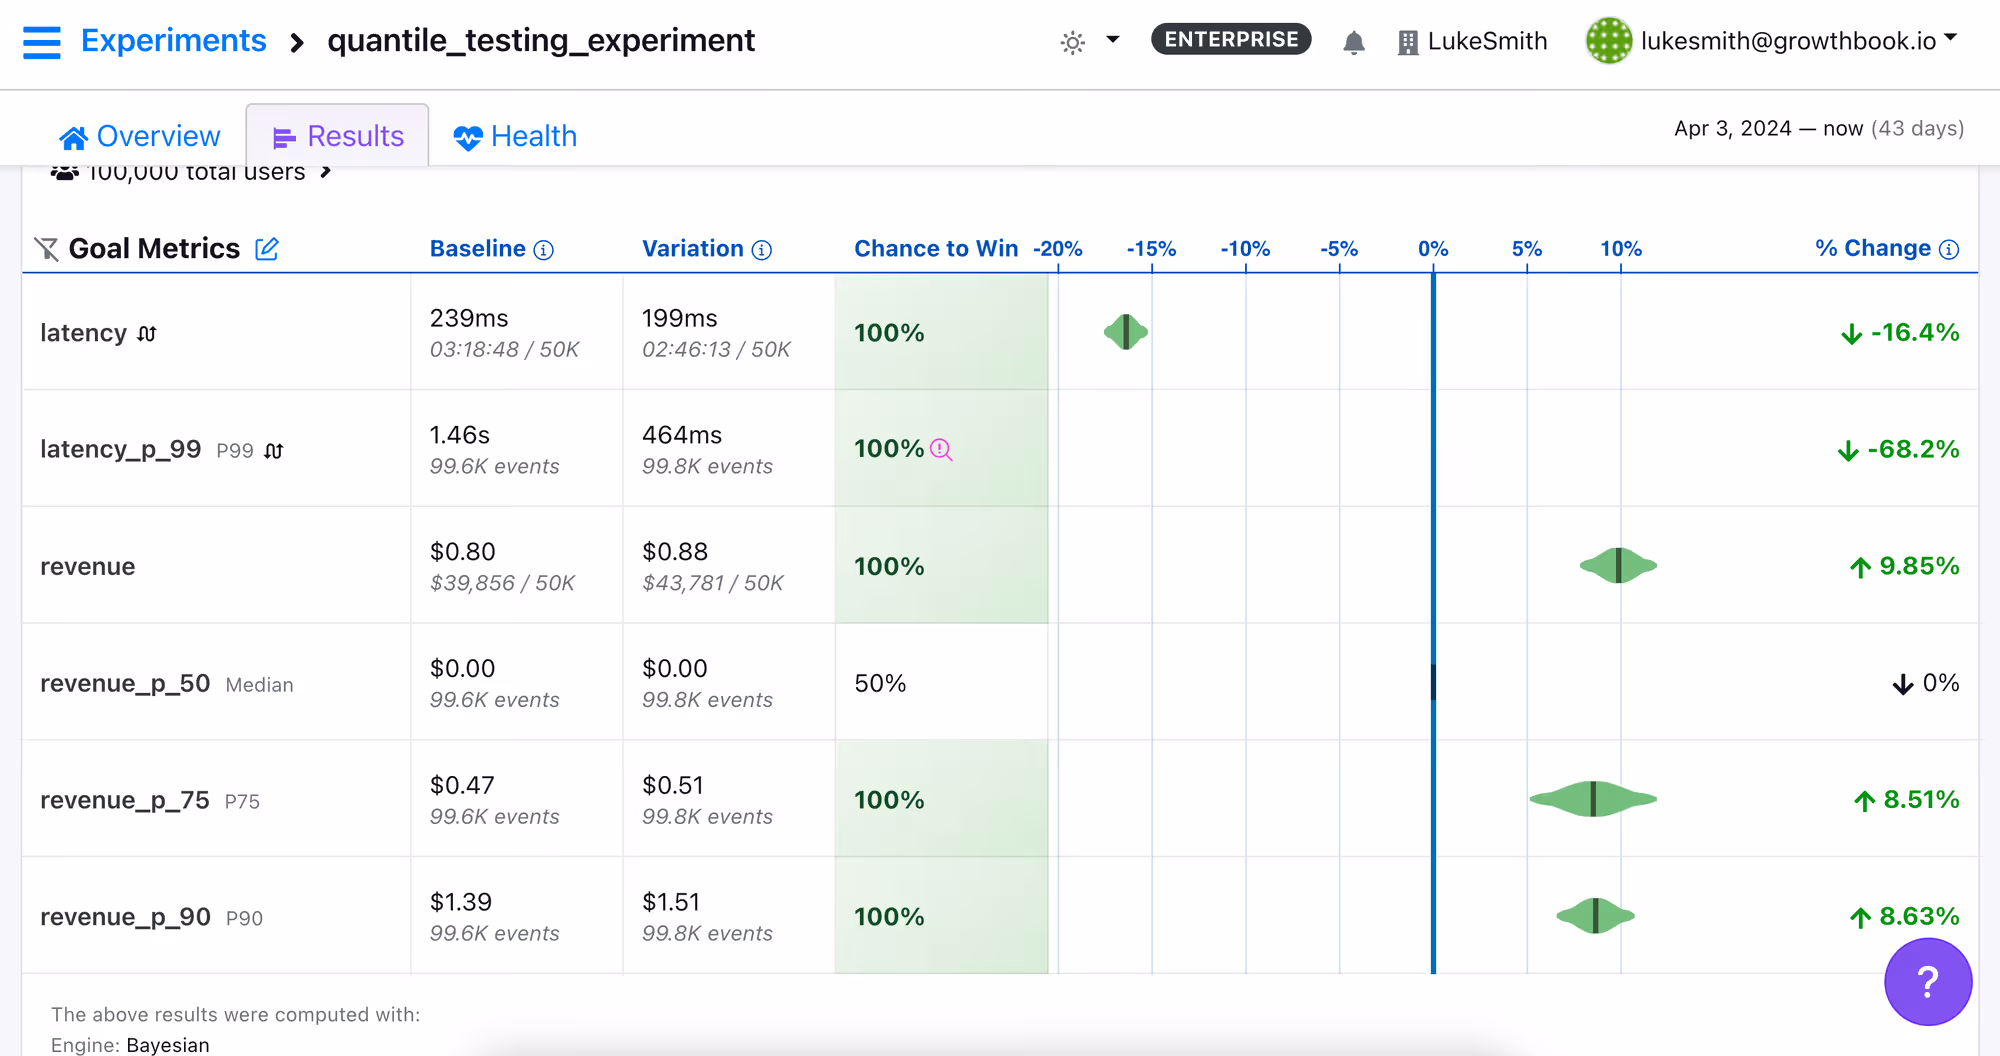
Suppose you want to answer the question, “Did I improve the worst website latency experiences for our users?” The first metric to look at is latency, which is a mean metric. There is a 40 ms reduction from 239ms to 199ms. While this reduction is helpful, quantile metrics can better answer this question. The metric latency_p_99 estimates P99 latency for a variation. Treatment reduced P99 latency from 1460 ms to 464 ms. So treatment had a big impact on the worst latencies!
Suppose you also want to answer the question, “did improving latency also improve revenue, and if so, on which users?” The mean metric revenue shows a 10% increase in mean spend from $0.80 to $0.88. You created three quantile metrics (revenue_p_50, revenue_p_75, and revenue_p_90 ) to examine which subgroup of users is benefitting. That is, are gains coming from typical users (median revenue, represented by revenue_p_50), moderately high spenders (represented by revenue_p_75), or the highest spenders (represented by revenue_p_90)? The table above shows no improvement for typical spenders, who have spend of $0. Further, the table also shows roughly 9% improvement for both moderately high and high spenders. Finally, you can see that in both groups at least 50% of customers have 0 spend, and you can see P75 and P90 spend. So quantile testing provides a more complete picture of the distributions of both groups, as well as the feature impact along the distribution.
Related articles


Ready to ship faster?
No credit card required. Start with feature flags, experimentation, and product analytics — free.

