

How to A/B Test AI Features

A practitioner's guide to A/B testing AI features: when to test, how to measure, what to randomize on, and how to connect offline evals to production experimentation.
Did your AI feature actually work?
Building an AI-powered software feature is not like shipping a traditional one. The output is non-deterministic. The same prompt can produce a dozen different answers, and a small wording change to your system prompt can change the outputs wildly and unpredictably. The metrics you'd usually rely on don't always tell you what you want to know. Did the user leave because the chatbot answered their question well? Or did they leave frustrated? Did engagement spike because users love the new feature, or because they're retrying queries that should have worked the first time?
The good news is this isn't an entirely new problem. The experimentation discipline you already have applies. Randomize, measure outcomes, compare to the control group. What changes is in the details: the metrics are harder to define, your experiment data can get noisier in ways you didn't expect, and a well-intended model update can start hallucinating or surfacing toxic content to real users.
This post walks through what's different and how to handle it: when to run experiments, how to measure if an AI feature is good, how to choose the right unit of randomization, why your power analysis can mislead you, and how to connect offline evals to production experimentation in one pipeline.
When should you run an experiment?
Experimentation fits at two specific phases in your AI feature's lifecycle: when you first launch it (does the AI-powered version actually beat what you had before?) and continuously after (does this prompt edit, model swap, or RAG change improve things?). The offline tuning phase before launch is where most of the early work happens, but it can't reliably tell you what's better in production.
The three phases, in order:
- Offline tuning. Model, prompt, retrieval, all the machinery, iterated until you have a candidate worth putting in front of users. Often starts with vibe checks and ends with LLM evals. Skipping this phase is especially risky for AI features. A confidently wrong answer is the kind of first impression users don't forget, and you may not get a second chance to win them back.
- The enablement test. Once the feature is tuned, the first experiment asks whether the AI-powered version actually beats the non-AI baseline.
- Continuous optimization. Every subsequent model swap, prompt edit, or RAG change gets tested separately.
This post focuses on phases 2 and 3, where experimentation carries most of the weight.
Feature flags handle both phases cleanly. Assign users to different AI (or non-AI) configurations the same way you'd test any other variation. How you set up those flags determines what you can actually learn from each experiment. We walk through the setup decisions in more detail below.
How do you measure if an AI feature is good?
With a traditional feature, the primary metric is usually obvious (not always, for sure). Someone clicked, or they didn't. They converted, or they bounced. With AI features, the primary metric can be harder to pin down. What does it mean for the chatbot to have helped? Did the user get what they needed, or did they leave feeling frustrated and poorly served?
The metrics that matter usually fall into three buckets:
- Outcome metrics like retention, task completion rate, or activation. For some, the most business-relevant metrics (e.g., retention) can be really slow to move or measure. A Daily Participation Metric can bridge that gap to a faster signal: the average percentage of post-exposure days each user is actively using the product. What counts as a good outcome metric still varies by use case. Some teams can lean on what they already track. Others have to design something new to capture what they actually care about. Typeform's CPTO Aleks Bass has reported that an AI form-creation feature doubled their activation rate. None of the roughly 50 other experiments they ran that year matched that lift.
- Behavioral signals like acceptance rate, regeneration rate, or abandonment. Fast but imperfect: they tell you something changed, not necessarily whether it was for the better.
- Safety and quality floors like hallucination rate, toxicity, PII leakage. These are constraints to enforce instead of metrics to optimize. Guardrail metrics with sequential testing catch violations in real time, and quantile treatment effects catch the tail behavior averages would miss.
A word on thumbs up/down feedback. It's often the first signal teams reach for, and it's also one of the least reliable. Thumbs feedback is heavily self-selected toward users with strong opinions, and Khan Academy's Kelli Hill has noted it correlates more with overall engagement than with quality. Not a good decision metric.
Cost, latency, and quality deserve special attention because they pull against each other. Better models cost more and run slower; cheaper or faster usually means lower quality. But in many cases, a less powerful model performs just fine while costing less and responding faster, and finding that sweet spot can be the goal of the experiment itself. Speed matters more than many teams expect: a faster response that's slightly less accurate can outperform on business metrics like conversion rates, because users engage more when responses feel instant. Track all three as separate outcome metrics. Cost especially is easy to overlook since growth teams rarely see infrastructure bills, but it can be the difference between a feature that ships and one that doesn't pencil out.
And beware: some metrics can mislead you. A support bot that hands off fewer cases to humans gets a higher resolution rate, but users walk away angry. You think you're optimizing the customer experience when you're actually hurting it.
How to combine these so you understand the tradeoffs, how to design custom metrics when the off-the-shelf ones don't fit, and how to navigate tradeoffs that don't have a single right answer: each deserves more depth than this overview can give. Our follow-up post will give the measurement question the love it deserves.
Choosing your unit of randomization
The tradeoff is simple: smaller units like sessions give you more data points and more power. Larger units like users or accounts work better when inconsistent experiences across visits would be noticed or confusing to the user.
User-level is the safer default when users return to the product repeatedly. Randomize at the session level instead, and the same user can end up seeing control on one visit and treatment on the next. That creates two problems: you can't cleanly measure user-level outcomes, and users may notice the inconsistency. A daily-use coding assistant, an AI chatbot with repeat usage, a recommender that shows up on every visit, an inbox feature touched dozens of times a day: these all belong on user-level randomization.
Even features that feel one-shot are usually safer at the user level. An AI summary at the top of an article, an AI-suggested subject line, an AI translation of a chat message: the same user encounters these again on a different article, email, or message. If they notice the behavior shifting between encounters, you've introduced inconsistency that distorts both their experience and your measurement.
Some teams do go for finer-grained randomization when they have a specific reason to. Khan Academy built infrastructure to randomize at the chat thread level for their AI tutor, accepting the cross-thread risk in exchange for more statistical power. That's a deliberate choice based on their context. Treat it as the exception, not the starting point: match the unit of randomization to the unit of experience, and err toward user-level when uncertain.
This may be especially worrisome for B2B products and any AI surface where different users can influence each other. If half the users in an account get a new AI feature, the rest will find out fast. Once they're asking questions about it, your control group is contaminated. Cluster experiments handle this by randomizing at the account or team level, so everyone in the same group sees the same variation. The tradeoff: far fewer units in your experiment, and you might come up short on power.
When power analysis misleads you
Most power analyses start with historical data. You look at how your metric has behaved in the past, estimate the variance, and calculate how long you need to run. That works fine when the thing you're changing doesn't also change the shape of your data. But a model swap can do exactly that. The variance you observed under one model might be completely different under another.
How much this matters depends on the metric. Metrics close to the raw LLM output, like response length or latency, can shift dramatically with a model change. Outcome metrics like retention or bookings are more stable because they depend on what users actually do, not directly on what the model produces. The rule of thumb: the further your primary metric sits from the model output, the more your historical variance estimates are likely to hold.
The three stages of testing AI features
A lot of teams treat evals and experiments as separate activities. They're not. They're stages in one pipeline, and each stage answers a different question.
1. Offline evals
Offline evals come first. You test a new model or prompt against a fixed dataset and check whether the outputs look reasonable. This catches obvious regressions before anything goes live, but offline evals are limited in two ways. Sample sizes are typically small (a few thousand examples), which is enough to flag a catastrophically broken model but not enough to detect the small-but-real shifts you'd actually want to ship. And eval metrics can be misleading: a higher score doesn't always mean a better outcome. Pedro Tabacof, principal ML scientist at Intercom, has seen this firsthand:
"A colleague was migrating to a new model and noticed one of our key intermediate eval metrics had dropped meaningfully. He spent some time tweaking the prompt to bring that metric back up, and then we launched the A/B test. The business numbers weren't great. Later I A/B tested the original version, the one with the lower eval score, and got better business results. That was a clear-cut case of an offline metric we'd trusted for a long time being misleading. We rely much less on intermediate evals now, and let production data make the call."
Treat eval scorecards as a filter for obvious failures, not a green light to ship.
2. The live experiment
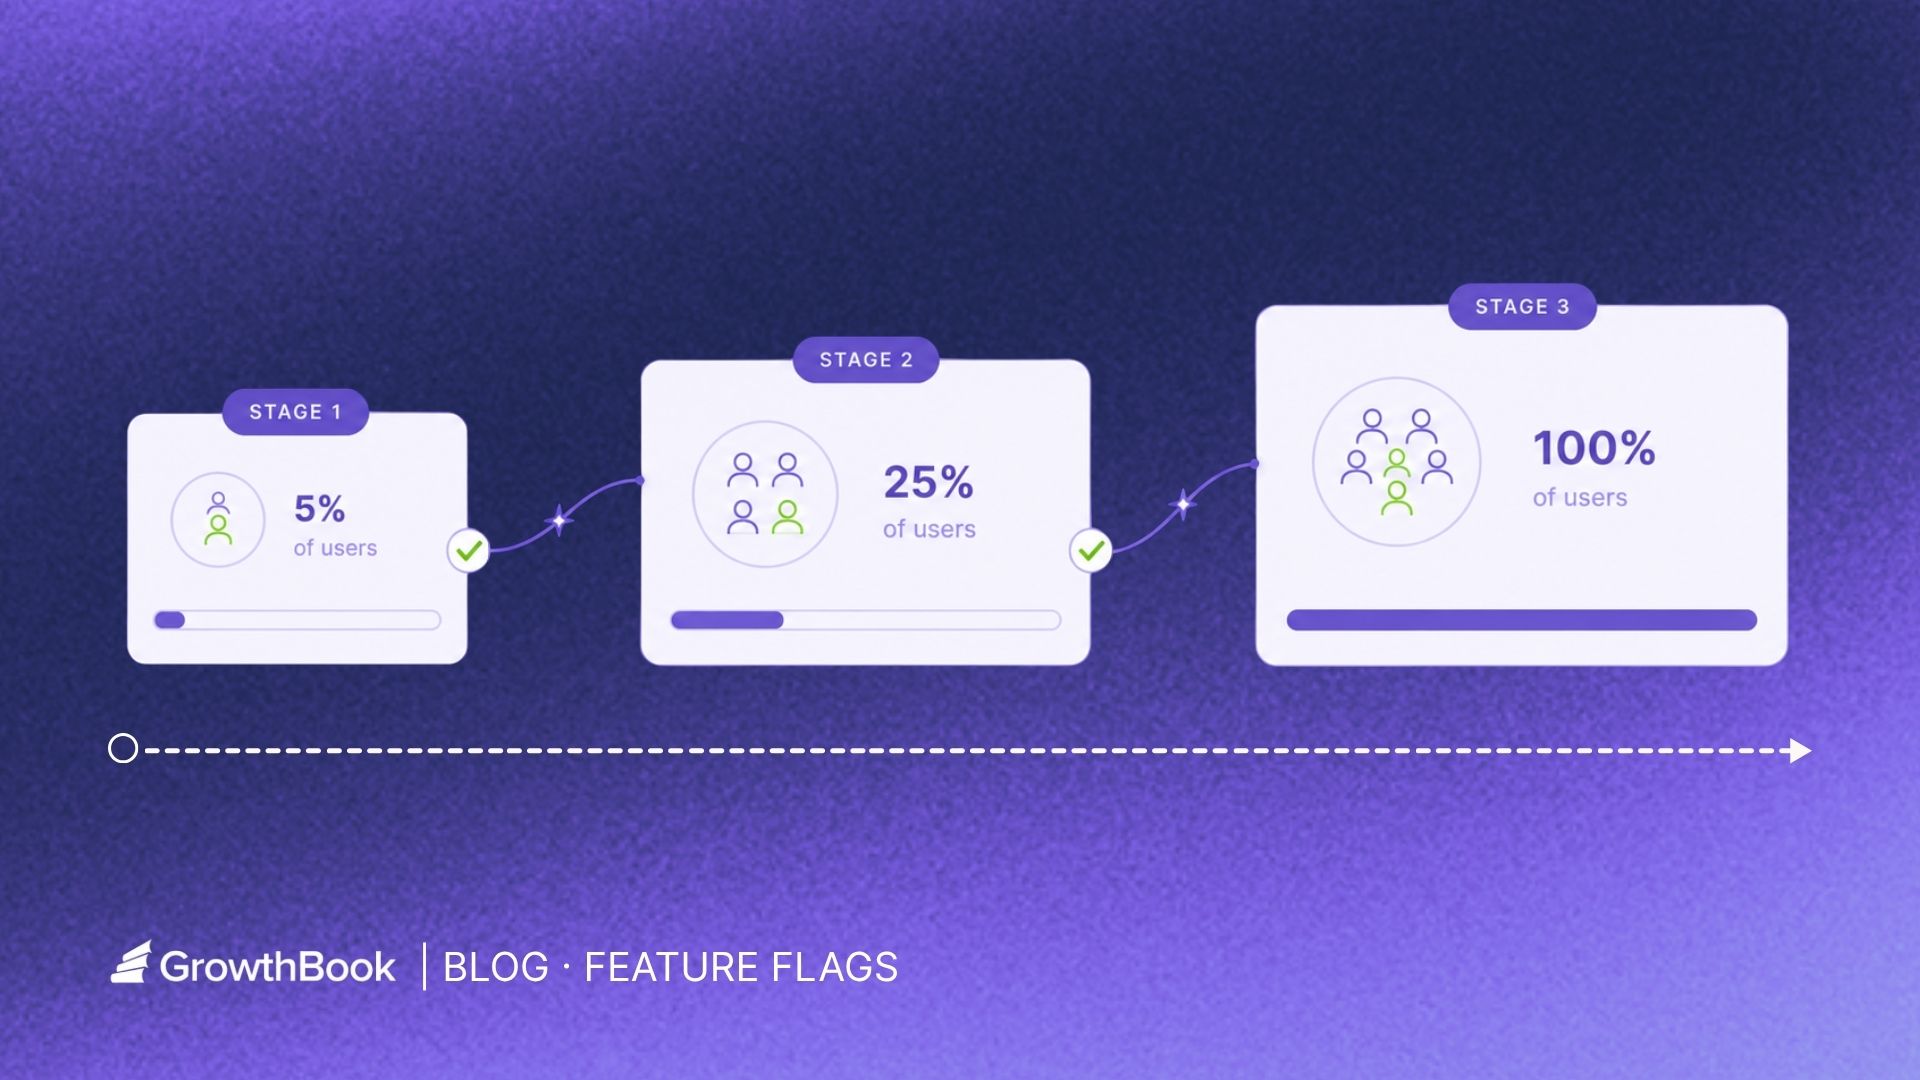
Next comes the live experiment. Start with low enrollment, say 5% (or even 1%) of users seeing the experiment at all, with a balanced split between control and treatment inside that small group. Watch your guardrail metrics for harm. If everything seems fine, raise the enrollment rate. What changes is the share of users entering the experiment, not their assignments: users already in control or treatment keep their assignment as the enrolled range grows, and new users entering the experiment get freshly assigned. The split stays balanced, and the experiment stays valid throughout the ramp. Keep going until you've gathered enough data to measure impact: did the new model actually improve the outcome, or did it just not make things worse? This is when the measurement framework from earlier becomes relevant.
When your customers are organizations rather than individuals, one detail matters: ramp at the interaction or end-user level, not at the account level. If you ramp by enrolling whole accounts, your highest-volume accounts go first because that's where the data is, and they will absorb most of the early risk. Rolling out 1% of interactions across all accounts spreads risk thinly, and the largest accounts never see an outsized share of an experiment that goes wrong.
3. Production monitoring
Finally, production monitoring. The experiment ends, you roll out the winner, but the job isn't done. Models drift. Upstream APIs change. Usage patterns shift. Even the context fed to your AI can change as other parts of the product evolve. Something that worked in March can quietly degrade by June without anyone touching a thing. Set up dashboards and alerts that track your key quality metrics independently of any experiment, so you catch degradation early.
Setting up for clean iteration
Once your feature is live, optimizing it means testing new prompts, swapping models, adjusting context windows. How you set up your experiments and flags now affects how smoothly you can iterate.
At launch, a single flag with an experiment behind it handles everything. Some users see the AI version; the rest stay on baseline. Once the results support a full rollout, bake the values into your code.
For ongoing optimization, each test gets its own new experiment. Testing a new prompt? Create an experiment that compares it against your current baseline. Swapping models? Create an experiment for that comparison. Each experiment brings a fresh random draw of who sees what, and its own set of values for the flag to serve. The flag variable in your code stays constant. All you're adding is a new experiment.
A flag can carry more than a simple on/off value. If you know your variations upfront, you can package a complete configuration into each variation: model, prompt, temperature, context window, all in one payload. One experiment, multiple configured variations. You'll learn which combination wins, but not which individual variable drove the result. Isolating which variable actually drove it means follow-up experiments that vary one dimension at a time.
The most common mistake is changing what the flag returns mid-experiment. It feels minor: just a prompt tweak, not worth configuring a new experiment for. But now the experiment combines users who saw both prompts and some who just saw the newest, and the result becomes difficult to read.
From speed bump to safety net
Testing AI features follows the same experimentation discipline you already have. What differs are the specifics: how you define and interpret metrics, why your power estimates may hold when the model changes, and where offline evals end and production experimentation begins. That is where you need extra care when shipping AI features.
AI has made shipping faster than ever, but it hasn't made it easier to tell good changes from bad. The faster you can ship, the more it costs to confuse the two.
The good news is the experimentation discipline you already have is most of what's needed. Apply it to every AI change with the wrinkles in this post in mind. Khan Academy's Kelli Hill has described their evolving relationship with experimentation as going from a "speed bump" to a "safety net." For AI features, that shift is the difference between shipping confidently and shipping by intuition.
Related articles
Ready to ship faster?
No credit card required. Start with feature flags, experimentation, and product analytics — free.

