Governance, for those unaccustomed to this buzzy word, is simply referring to guardrails. With feature flags, it can be really easy to work yourself into a pickle. Our latest 5.0 release focused on many cool things, but one of the big ones was protecting you and your co-workers from yourselves. So you can work faster while still shipping safely.
As AI speeds up how fast code can be written and large organizations release more changes across more teams, the challenge is no longer simply getting work out the door. It is vital to make sure every change is valid, behaves as expected alongside everything else, and reaches production with the right context.
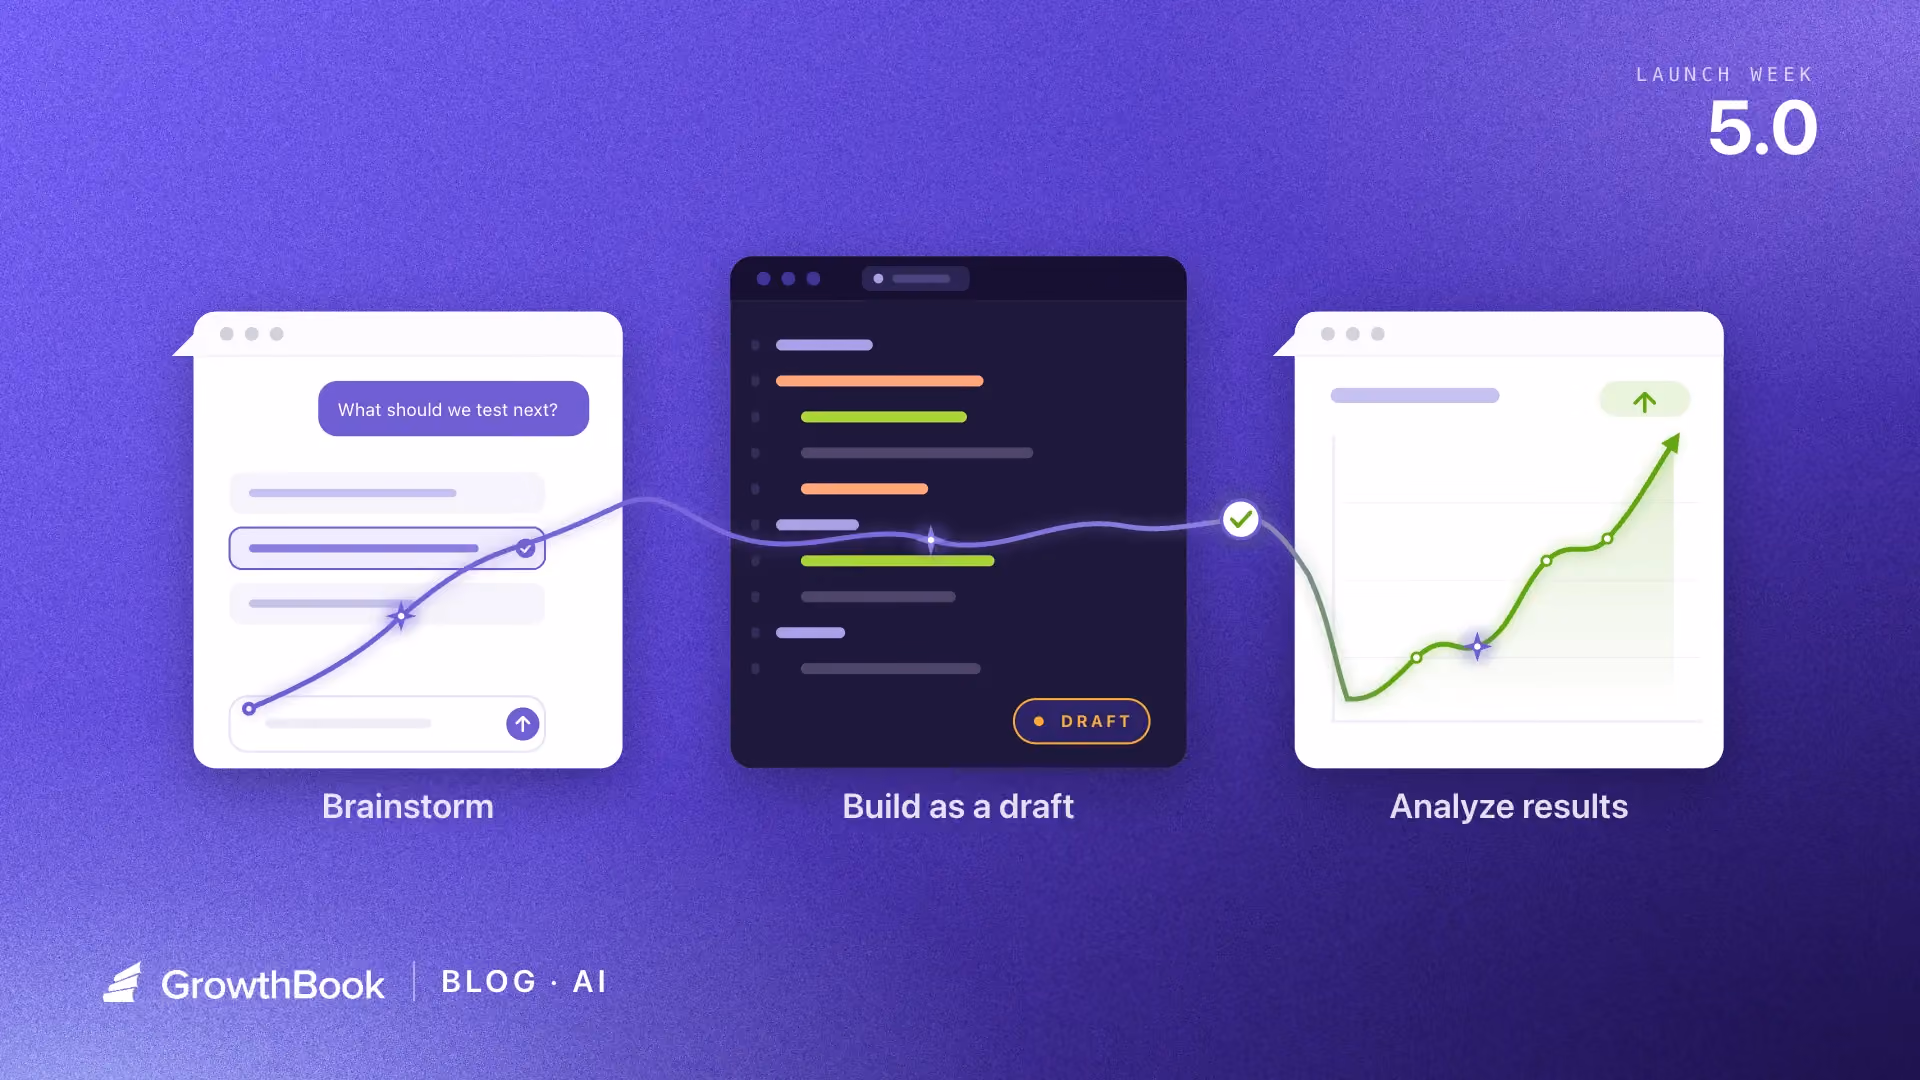
With this in mind, there are three areas in which we focused our feature flag governance in 5.0:
Catch problems while someone is making the change
Catch problems created by the full rule set
Make the final decision with context
Catch problems while someone is making the change
For this category of features, GrowthBook is checking whether the change itself is valid, sensible, and no larger than it needs to be. The best time to catch a bad flag change is before it becomes a review comment, a Slack thread, or a production scavenger hunt.
Schema validation for string and number flags
GrowthBook could already validate the shape of JSON flag values. Now you can also set rules for string and number flags.
For example, you can now limit a checkout layout flag to classic, compact, or express. GrowthBook will reject anything else, including typos.
["classic", "compact", "express"]
For number flags, now you can set a minimum and maximum, such as allowing results-per-page to be anywhere from 10 to 100.
It is basically type safety for remote config, because TypeScript cannot save you from someone entering "expres" in a dashboard. Invalid values can now be caught before they are saved or published.
Feature-scoped Custom Hooks
Custom Hooks let your team write its own rules for what counts as a valid flag change.
For example, you could require a description, prevent targeting by email address, or make sure every rollout uses userId.
Custom Hooks already existed, but they previously applied to every feature in an organization or project. Now you can attach one to a single feature that needs its own rules.
Organization-wide: Every feature flag must have an owner and at least one tag.
Project-wide: Every rollout in the checkout project must use userId for hashing.
Single feature: Only the checkout-config flag must include a Jira ticket before it can be changed.
Soft warnings
Not every questionable choice deserves the full red-screen treatment.
Custom Hooks can now raise a warning instead of blocking the save:
addWarning("Consider adding a ticket number");
The person editing can review it and choose Save anyway.
So now you have two volumes:
addWarning() says, “Are you sure about this?”
throw says, “Absolutely not.”
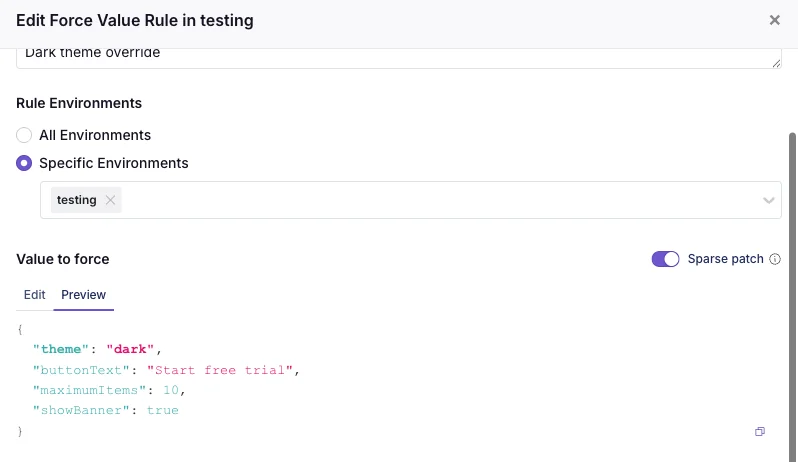
Sparse patches for JSON rules
Suppose a JSON flag has ten fields, but a rule only needs to change one.
Instead of copying the entire object, you can save just the keys and values you want to update:
{
"theme": "dark"}
A sparse patch preview showing only the changed field before it merges onto the default value.
GrowthBook merges that onto the default value, which means smaller changes, cleaner diffs, and fewer stale copied fields.
One important caveat: the merge is shallow. It only merges top-level keys, not deeply nested objects.
Catch problems while someone is making the change
Together, these features make the editor feel less like a blank text box with consequences and more like a development environment that knows what “valid” means.
The value can be checked against an expected shape, custom rules can catch requirements unique to your team, warnings can flag questionable choices without blocking every save, and sparse patches keep changes focused on the fields someone actually meant to touch. By the time the change reaches review, many of the easiest mistakes have already been caught, while they are still cheap to fix.
Catch problems created by the full rule set
A rule can be perfectly valid on its own and still cause trouble once it joins the group chat.
GrowthBook evaluates rules from top to bottom. An earlier rule can serve a user before a later rule ever gets the chance.
For example:
Force a value for everyone in the US.
Force a different value for Pro users in the US.
The second rule will never run. Pro users in the US already matched the first rule and left the building.
GrowthBook already warned when a rule was completely unreachable. In 5.0, that detection expands to catch more ways rules can compete for the same traffic.
The warnings now have three levels:
Unreachable: No matching traffic will reach the rule.
Will not reach: Some matching traffic will definitely be served by an earlier rule.
May not reach: An earlier rule might serve some of the same traffic, but we cannot say exactly how much.
GrowthBook flags a rule as unreachable when an earlier rule already matches the same traffic.
That last distinction matters for partial rollouts. A 90% rollout above another rule does not completely block the rule below it, but it does take a large bite out of the traffic before it gets there.
The warning also points to the earlier rule causing the conflict, so you can reorder the rules, narrow the targeting, or confirm that the overlap is intentional.
This catches a different class of problem than schema validation or Custom Hooks. Each rule may be valid, but the full rule set may not behave the way you pictured it.
Make the final decision with context
Automated checks can catch a lot, but eventually a human still has to decide: Is this change ready to go live?
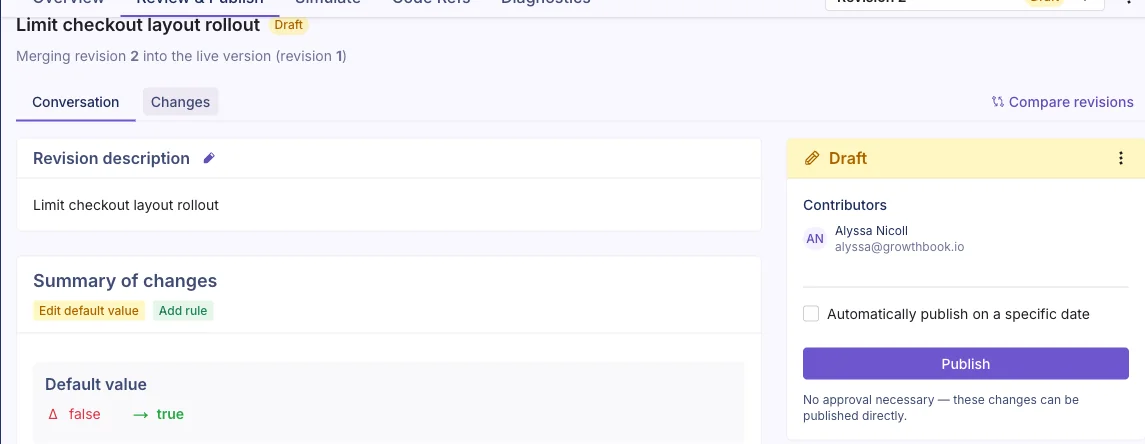
GrowthBook 5.0 adds a dedicated Review & Publish tab that brings the scattered pieces of that decision into one place. It replaces separate publishing, review, and conflict-resolution flows with one shared workspace.
The Conversation view summarizes what changed and lets you publish the draft directly.
The Conversation view gives you the readable version of the story: what changed, why it changed, who contributed, any comments or reviews, and what needs to happen next.
When you need the technical receipts, the Changes view shows the detailed diff and lets people comment on the specific changes.
If Approval Flows are enabled, reviewers can leave a comment, request changes, or approve the draft before it is published. Without required approvals, someone with permission can still review the same context and publish directly. Approval Flows are a commercial feature.
The goal is not to make every flag change pass through a courtroom. It is to put the diff, discussion, reviewers, conflicts, and final action in the same room, so the person clicking Publish knows exactly what they are sending out the door.
Guardrails not stop signs
Good governance is not about slowing creators down. It is about making the work they publish quality and catching problems early before they hit users.
By adding governance while changes are created, when rules interact, and before publishing, teams will catch mistakes earlier and ship with more confidence. I'm so excited for what 5.0 at GrowthBook has brought to feature flags. If you'd like to learn more or hear from the engineers behind all of our newly released features, you can join us for Office Hours Live on Thursday, July 30 at 9 a.m. PT. See you online and happy experimenting!
Thank you! Your submission has been received!
Oops! Something went wrong while submitting the form.
Feature Flags
Featured
Product Updates
5.0
Feature Flag Governance — GrowthBook 5.0
Jul 23, 2026
5.0
Analytics
Releases
GrowthBook 5.0: Product Analytics is now generally available
Jul 22, 2026
5.0
AI
Releases
Experiments
Featured
AI Visual Editor: opening up experimentation for growth and marketing teams
Jul 21, 2026
5.0
AI
Product Updates
Featured
Your agents can operate GrowthBook now
Jul 20, 2026
Releases
5.0
Featured
GrowthBook 5.0: Build, ship, and improve at scale
Jul 20, 2026
Experiments
Featured
Lessons learned from Ronny Kohavi and Luke Sonnet: running trustworthy experiments
Jul 17, 2026
Product Updates
Experiments
AI
1.0
Featured
AI Visual Editor: from idea to live experiment in minutes
Jul 16, 2026
AI
Experiments
Featured
AI Coding Agents and A/B Testing: How to Automate the Experiment Lifecycle
Jul 15, 2026
Experiments
Featured
How to Avoid False Positives in High-Velocity Experimentation


.jpg)


.avif)

.avif)

