

The Uplift Blog
If you build healthcare-related software, you’ve probably been told to make sure that personal health information is kept out of third-party tools. It’s a huge undertaking but necessary considering the consequences of a data leak.
Feature flags generally make releases safer because you can ship to a small subset of users and turn it off if something goes wrong. But to reach that group, you need targeting rules that use patient attributes like diagnosis codes. Those values then flow into SDK payloads and event streams you never meant to share.
In an industry where the Office for Civil Rights (OCR) logged 663 large breaches in 2024, you need to account for each path and keep a record of who changed each rule. Even if you sign a BAA with the feature flagging vendor, the safeguards are still yours to build, or at least ensure they exist.
In this article, we’ll explain how HIPAA laws apply to feature flags and how to keep your deployments compliant.
What is HIPAA compliance?
HIPAA compliance refers to meeting the requirements of the Health Insurance Portability and Accountability Act (1996), which governs the protection of patient health information. For engineering teams, it means following the HIPAA Security Rule, which sets safeguards for protecting electronic protected health information (ePHI).
It basically covers individually identifiable health information held or transmitted by a covered entity or business associate. For example, a diagnosis code paired with the patient ID becomes a tracked string of data.
That said, HIPAA doesn’t necessarily apply to every company that works in the healthcare industry. It depends on your role in the flow of ePHI:
| Role | Who it covers | Where it shows up in your stack |
| Covered entity | Organizations that deliver or pay for care, like hospitals and health plans | Your organization, whether you’re a payer or a provider. For example, if you offer a health plan or provide care and have access to ePHI. |
| Business associate | Anyone who creates, receives, maintains, or transmits PHI on a covered entity’s behalf | Your company, if you build software for providers, and any vendor that receives your ePHI |
| Subcontractor | A business associate’s own vendors that handle PHI | Your vendors’ vendors, like the cloud host behind a SaaS tool |
| None of the above | A vendor that never receives ePHI or may not be acting as a business associate for that service/data flow | A flag platform that evaluates flags inside your own infrastructure and never receives PHI through its rules, saved groups, metadata, or integrations |
The Security Rule groups its requirements into different safeguard categories, and three of them apply to feature flags:
- Administrative safeguards (164.308) cover your policies and people, like access reviews and incident response.
- Technical safeguards (164.312) cover the systems themselves, like access control and audit logs.
- Physical safeguards (164.310) deal with facilities and hardware, so they mostly sit with whoever runs your servers. If you’re running a self-hosted deployment, the responsibility is yours. But if you’re using a cloud-based tool, then it lies with the feature flagging vendor and your organization.
You have to implement every spec if it’s a required clause and you have to implement it as written in the safeguard. For example, if the safeguard says that you need a unique user login, then each user needs to have their own login credentials if they can access ePHI. If it’s an addressable spec, you can choose to follow it or document why you chose an alternative because you have the ability to decide if it’s a reasonable requirement for your environment. That’s why security questionnaires these days ask about addressable items like encryption because reviewers want to see the decision you made and the reasoning behind it.
How do feature flags matter for HIPAA compliance?
Feature flags decide which version of your software a user (patient or provider) ultimately sees in the app. And the input to that decision comes down to the attributes it uses, which can include PHI. So even if the feature flagging platform doesn’t store a patient record, it can still end up handling PHI through the attributes you target on, the rules you write, or the integrations around it. Whether that makes your vendor a business associate depends on what actually reaches it.
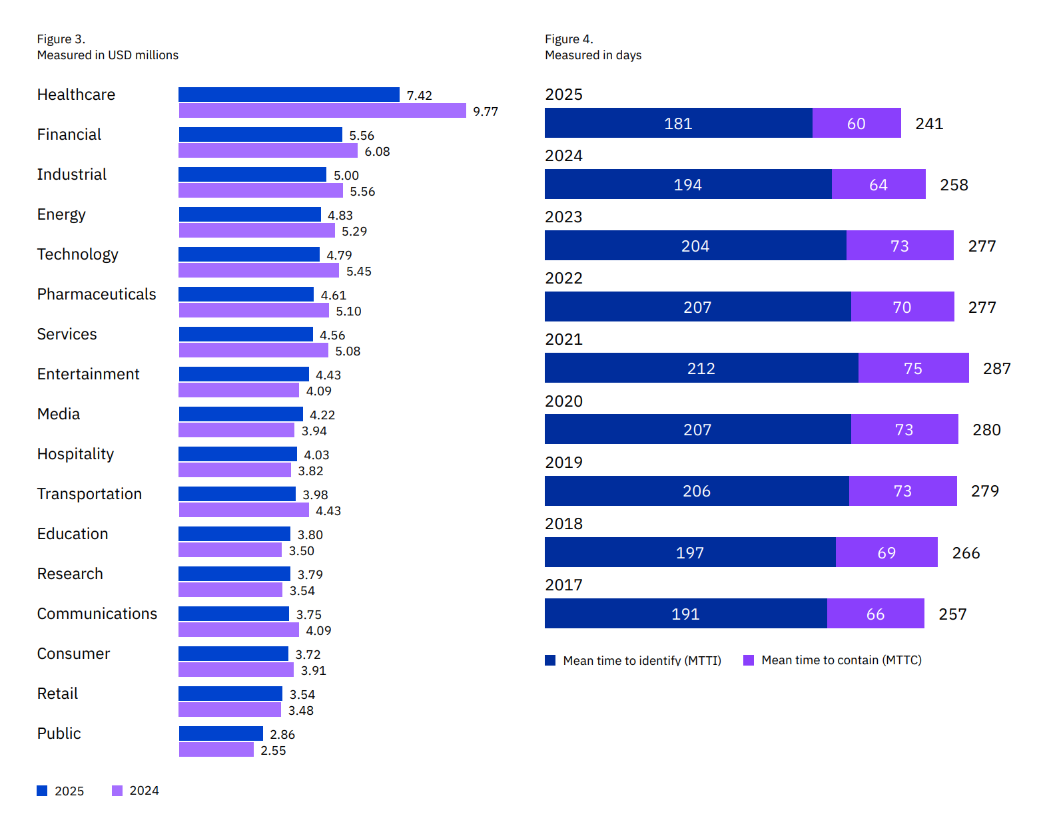
This matters because data breaches affect your relationship with customers and your market reputation. But beyond that, they’re also very expensive mistakes. IBM’s 2025 report found that healthcare breaches can cost an average of $7.42 million. They also take the longest to resolve, with the average breach taking almost 40 weeks to identify and contain. That’s 5 weeks longer than the global average breach across industries.
In July 2025, Deer Oaks, a behavioral health provider, settled a $225,000 fine with OCR after a coding error in its pilot patient portal exposed discharge summaries to the public. In fact, search engines could access and cache those summaries for 18 months. As a result, the company agreed to a 2-year corrective action plan, including audit controls to record and review platform activity.
Unless your feature flagging platform has the right controls in place to catch these types of errors, you won’t be able to limit data exposure.
So, where does PHI really enter a feature flag platform?
First, check where your feature flags are evaluated. For example, in a platform like GrowthBook, the SDK evaluates the flag inside your infrastructure, so the attribute values you pass in aren’t sent to GrowthBook. But PHI can still reach it through the rules you wrote or the metadata around it. For example, if you save a list of patients’ IDs as a “Saved Group” for further targeting or experiments, and your team posts the change to Slack, the webhook carries the full diff.
That’s one reason 30% of healthcare breaches happen through internal actors. You’re operating the way you normally do but unknowingly expose data that was never meant to be public in the first place.
Here’s how PHI typically enters the feature flagging tool:
| Surface | How PHI gets in | Example | Fix |
| Targeting attributes | You pass clinical fields into the SDK context | diagnosis or mrn in the attributes object | Evaluate locally and pass opaque cohort IDs instead of clinical values so that the decision is made within the app and the values don’t get sent to your flagging vendor. |
| Rule values in the SDK payload | The value you target sits inside the rule, and browsers can read client-side payloads | diagnosis = "E11.9" ships to every client | Use Remote Evaluation or an opaque cohort attribute (a neutral group label that doesn’t include identifiable information). |
| Saved groups and ID lists | You group patient IDs by condition | An “oncology pilot” group of 400 patient IDs | Compute cohort membership in your backend |
| Flag names, descriptions, and tags | The metadata describes the patient population | enable-for-hiv-positive-patients | Review naming conventions the same way you review code |
| SDK plugins | A plugin captures page context automatically | The JavaScript auto-attributes plugin collects the URL, query string, page title, and GTM dataLayer variables | Turn off the auto-attributes plugin for patient-facing pages and set the attributes manually instead. This results in an allowlist where the SDK only receives fields you deliberately pass in, protecting ePHI. |
| Exposure and analytics events | A tracking callback forwards events to a third party | The third-party tracking plugin sends “Experiment Viewed” events to Google Analytics or Segment | Send exposure events to your own warehouse only |
| Webhooks and integrations | Change notifications include rule values | A Slack alert posts the full diff | Scrub payloads and point webhooks at internal endpoints |
| Logs and debug output | Debug mode or app logs print the context object | The attribute object lands in a log line shipped to your log vendor | Turn off debug logging in production and redact at the logger |
| Screenshots and support tickets | Someone shares a rule or dev tools view outside your team | A screenshot of a targeting rule attached to a support ticket | Redact before sharing |
So, your feature flagging platform’s architecture really matters.
Feature flags reduce risk of deployment and help you target users more efficiently, but they come with their own risks:
- PHI leaving your app’s infrastructure: Targeting rules, SDK payloads, event streams, and flag metadata can carry patient data to places it doesn’t need to go.
- Unreviewed changes to PHI-handling code: A flag flip can change production behavior instantly, and it can happen without the review your deploys go through.
You can handle both through a signed BAA and clear approval workflows with timestamped audit logs.
Which HIPAA safeguards apply to feature flags?
OCR has already declared which HIPAA controls generally need improvement. In a breach report it presented to Congress in 2024, the following areas were named:
- Risk analysis
- Risk management
- Information system activity review
- Audit controls
- Person or entity authentication
Each of these maps to your feature flagging layer. It’s common to assume that if your feature flagging tool doesn’t receive PHI, it falls outside the Security Rule, but that’s not the case. The audit controls apply to systems that “contain or use ePHI,” and your flags typically control the code paths that do.
Here’s a list of HIPAA controls that apply to feature flags. Some capabilities below depend on your GrowthBook plan: SSO, SCIM, audit logging, and approval flows require Enterprise, while Remote Evaluation, secure attribute hashing, payload encryption, and prerequisite flags require Pro or Enterprise.
| HIPAA criterion | Requirement | What does it mean for feature flags? | How GrowthBook handles it |
| 164.312(a) Access control and unique user identification (Required) | Only authorized people and software can access systems that hold ePHI, and each user has a unique identity. | You control who can reach the flag console and who can change a flag that governs a PHI code path. | Role-based permissions at the global and project level, and a project role can reduce someone’s global access. Engineer and Experimenter roles can also be limited to specific environments, such as staging but not production. SSO gives each user one identity. |
| 164.312(b) Audit controls (Required) | You record and examine activity in systems that contain or use ePHI. | You keep a reviewable record of each change to a PHI-handling flag. | An audit log that can’t be edited through the GrowthBook app or API, with the actor, timestamp, environment, and before/after diff. Event webhooks stream changes to your SIEM, and you can export the log. |
| 164.312(c) Integrity | You protect ePHI from improper alteration or destruction. | A flag change can alter how your code reads or writes patient data, so that logic shouldn’t change without review. | Published revisions are locked. Approval flows can require review on PHI projects and can block contributors from approving their own changes. You can also set an approval to reset if someone edits the draft afterward. |
| 164.312(d) Person or entity authentication (Required) | You verify that anyone accessing ePHI is who they claim to be. | Console access runs through your identity provider. | SSO over OIDC with providers such as Okta and Entra ID. You enforce MFA at your IdP. |
| 164.312(e) Transmission security and encryption (Addressable) | You guard ePHI against unauthorized access while it moves across a network. | You know what travels between GrowthBook, your servers, and your clients, and who can read it. | HTTPS on GrowthBook Cloud. Optional SDK payload encryption deters casual inspection, but client-side apps still hold the key, so use Remote Evaluation to keep rules off the client. When you self-host, the Proxy or push-webhook setups mean your main GrowthBook instance needs no public inbound traffic, and GrowthBook can run fully air-gapped. |
| 164.308(a)(1)(ii)(A) Risk analysis (Required) | You assess risks to ePHI across your systems. | Your flag platform and the data flowing through it belong in the analysis. | Local evaluation keeps attribute values out of GrowthBook, which narrows what your analysis needs to cover. |
| 164.308(a)(1)(ii)(D) Information system activity review (Required) | You regularly review audit logs, access reports, and security incident records. | Someone reviews flag changes on a schedule, not only after an incident. | Audit log filters and a per-flag event timeline. Webhook streams let your security team review changes in their own tools. |
| 164.308(a)(3)(ii)(C) Termination procedures and 164.308(a)(4)(ii)(C) access establishment and modification (Addressable) | You remove access when someone leaves and manage access changes. | Former employees and people who change roles lose flag access promptly. Review and rotate any API keys they created. | SCIM provisioning through Okta and Entra ID. You can only remove SCIM-provisioned users from your IdP, so offboarding happens in one place. |
| 164.308(a)(6)(ii) Response and reporting (Required) | You identify, respond to, and document security incidents. | You can switch off a faulty PHI code path fast and show when you did it. | Kill switches turn off a flag per environment without a redeploy, and prerequisite flags let one switch disable a group of dependent flags. GrowthBook logs each toggle. |
| 164.308(b)(1) Business associate contracts | You get written assurances from any vendor that handles ePHI on your behalf. | You decide whether your third-party vendor needs a BAA. | Self-hosted (including fully air-gapped), flag data stays in your infrastructure. On GrowthBook Cloud, GrowthBook signs BAAs for Enterprise customers. |
| 164.502(b) Minimum necessary (Privacy Rule) | You limit PHI use and disclosure to the minimum needed for the task. | You target the least sensitive data needed to get the job done. | Local evaluation keeps attribute values in your app. Secure attributes and Remote Evaluation keep sensitive rule values off the client. |
If you skip any of these, fines could range from a few thousand dollars to millions, depending on the severity of the issue.
Additional considerations for HIPAA compliance
1. Do you need a BAA?
Whether you need a BAA with your feature flag vendor comes down to one question: does the vendor create, receive, maintain, or transmit ePHI?
Self-hosting and local evaluation reduce how much data reaches your vendor, but they don’t settle the question on their own. PHI can still reach a hosted platform through saved groups, rule values, flag names, or webhooks. If any ePHI could reach your vendor, you need a BAA. That said, you’re better off mapping the data flow with your legal or security team and determining the vendor’s role in the data flow.
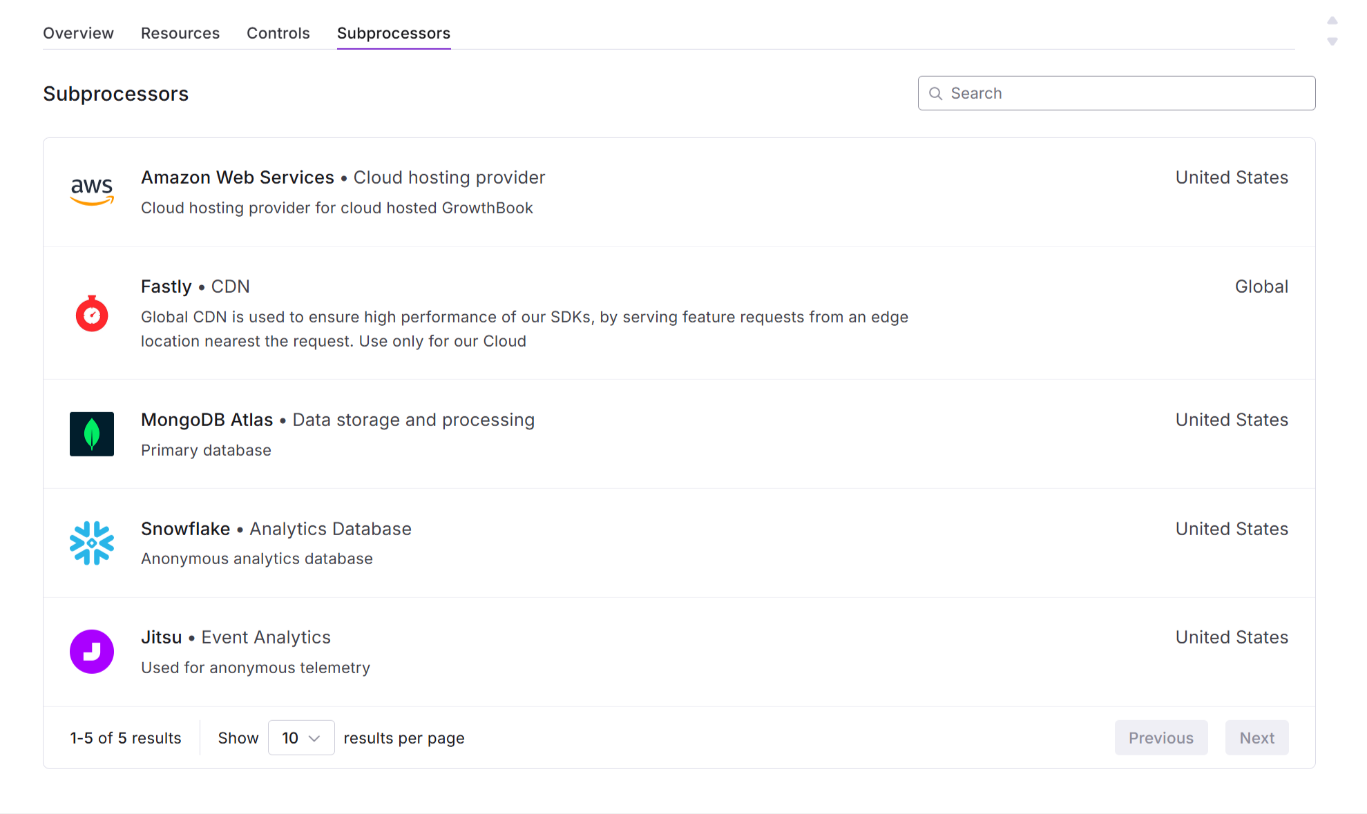
If your vendor receives ePHI, its subprocessors also need BAAs under 164.314. Ask for the subprocessor list before you sign.
2. Does self-hosting reduce the vendor’s liability?
It can reduce the vendor’s liability, but again, it depends on the infrastructure of the platform you choose.
For example, when you self-host GrowthBook, the platform runs entirely in your environment, and it can operate fully air-gapped. You can run the main instance on a private subnet and expose only the GrowthBook Proxy or push flag payloads out through webhooks. Because of this setup, you own database encryption, backups, TLS, and patching.
8 capabilities your feature flagging platform should have for HIPAA
Here’s what to look for in a feature flagging platform if you handle PHI:
1. Local or server-side evaluation
You don’t want a flag platform that needs your patient attributes to make a decision. If the vendor evaluates flags on its own servers, the attribute has to leave your infrastructure every time a patient loads a page. That’s why local evaluation matters so much.
In this case, the platform sends the flag’s targeting rules to your app, and your app makes the decision. Platforms like GrowthBook work so the SDK evaluates flags in process and holds attribute values in memory. As a result, attribute values stay in your application. If you use Remote Evaluation, run it through a self-hosted GrowthBook Proxy so attributes stay in your infrastructure too.
2. Secure attributes for sensitive targeting
Let’s say you need to target a sensitive value inside a browser or mobile app, where anyone can inspect the payload. Any plain targeting rules would expose that data to every client. Essentially, you need a way to avoid shipping sensitive values in plain text.
In GrowthBook, you can mark an attribute as secure, which ships its conditions as salted SHA-256 hashes. Hashing alone isn’t enough for values with only a few possible options, like diagnosis codes, because they can be guessed. For those, pair it with Remote Evaluation so the client never sees your rules or target on opaque cohort IDs instead.
3. Audit logging and change approval
Audit logs need to do two things together:
- Record the actor, timestamp, environment, and before/after values.
- Create a record that can’t be changed through normal use of the platform.
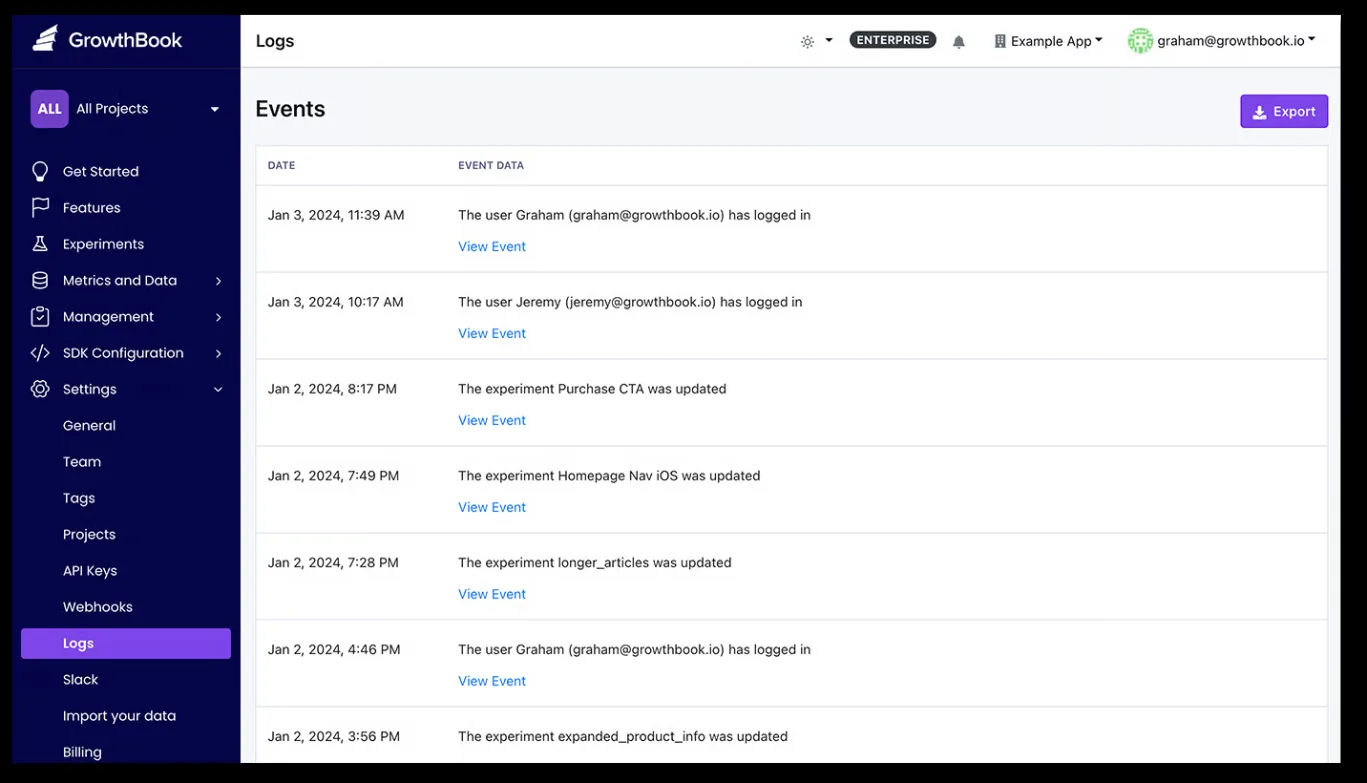
These capabilities are critical because they create a paper trail for every change you make in production. If and when an auditor or reviewer asks where the change was made and by whom, you can pull out this information and walk them through it.
In the same vein, your platform of choice should also have an approval workflow where one person makes the change but another reviews and approves it. If the same person does both, they should document why.
In GrowthBook, the audit log records whether a change came from a person, an API key, or the system, and you can export it. And approval flows never let a draft’s creator approve it, and you can block every other contributor from approving it too. Changes through the REST API can be held to the same review rules, so agents and scripts can’t skip the queue. Make sure the setting that lets the REST API bypass approvals is turned off. Users with the Bypass draft approvals permission can still publish without review in an emergency, so keep that permission limited.
4. RBAC with SSO and automated deprovisioning
Let’s say an engineer leaves your company on Friday. If their flag console account and API keys still work on Monday, you have left the door open to the code paths that handle patient data. To avoid this, your access controls should connect to your identity provider.
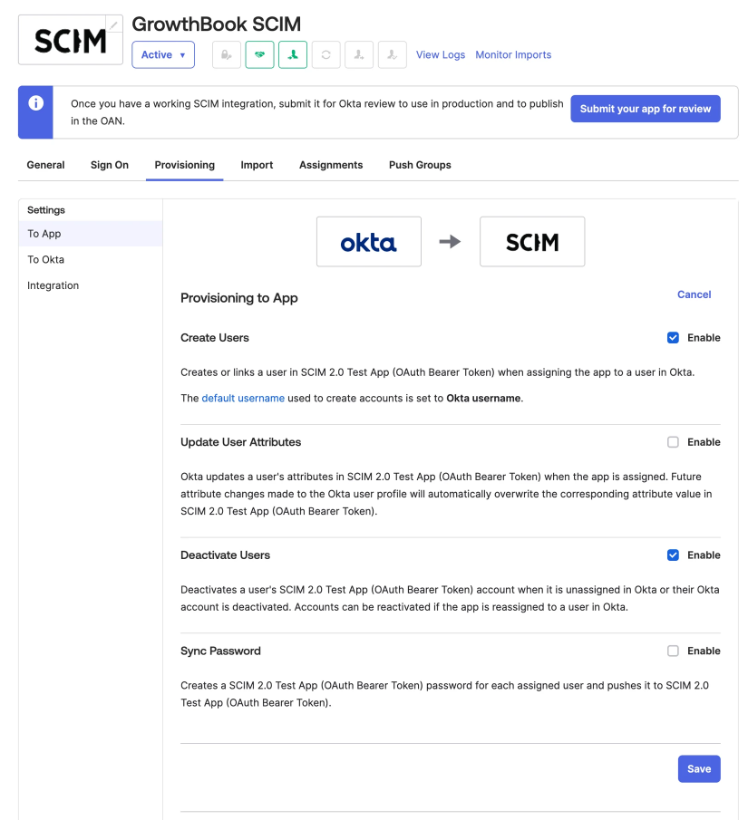
Platforms like GrowthBook offer role-based permissions that work globally or based on the project or environment level. This prevents unauthorized users from accessing controls that are linked to sensitive PHI. Since the platform’s SSO runs over OIDC and SCIM provisioning works through Okta and Entra ID, removing a user in those apps automatically removes access from GrowthBook.
5. Documented encryption at rest and in transit
Every security questionnaire these days asks about data encryption at rest and in transit. You’ll need to show how it’s done, so to confirm that, ask your vendor the following questions:
- How does data move between servers and your app?
- What does the data payload actually store?
- How is the data encrypted at rest?
This will tell you the exact encryption mechanism and help you decide whether it meets your compliance requirements.
For instance, GrowthBook Cloud serves the API and SDK endpoints over HTTPS. If you self-host the platform, you control the TLS termination and database encryption while GrowthBook encrypts the source credentials with a key your team manages.
6. Self-hosted or VPC deployment option
Self-hosting limits your exposure to vulnerabilities in someone else’s infrastructure. For instance, in 2025, Comstar, a medical billing vendor, was fined $75,000 for failing to detect ransomware, which eventually leaked the data of 585,621 people. Since the company was a business associate of over 70 HIPAA-covered entities, those companies were impacted too.
If a feature flag runs within your own infrastructure, you can prevent this as long as you have the right controls in place as well. That’s why you should look for a platform that gives you the ability to self-host.
GrowthBook offers a self-hosted option that runs the same codebase as the cloud. You can lock down the network by using the following methods:
- Private subnet with a public Proxy: Run the main instance on a private subnet and expose only the GrowthBook Proxy, which serves SDK payloads to your apps.
- Push-only delivery: Use SDK webhooks to push flag payloads to your own endpoints. As a result, your GrowthBook instance doesn’t need to accept public inbound traffic from your apps.
- Fully air-gapped: Run GrowthBook with no connection to the internet, so nothing leaves your network.
Note: No software is HIPAA-compliant on its own. Compliance depends on how you configure and operate it. Self-hosting GrowthBook, including fully air-gapped, keeps flag data inside your infrastructure. If you use GrowthBook Cloud and may send it ePHI, GrowthBook signs BAAs for Enterprise customers.
7. BAA for cloud deployments
Every BAA you sign should include the platform’s entire product line and its subprocessors, which usually host your data. Before you sign, ask the vendor to answer these questions:
- Which products, features, and environments does the BAA cover?
- Which subprocessors handle your data, and whether each one has its own BAA with the vendor?
- How quickly will the vendor notify you of a breach?
- What happens to your data when the contract ends?
- How long is the data retained for, and where?
Essentially, a BAA works like an SLA for data handling and compliance. You know what happens when something goes wrong, which also tells a reviewer you have the right controls in place.
8. Warehouse-native analytics
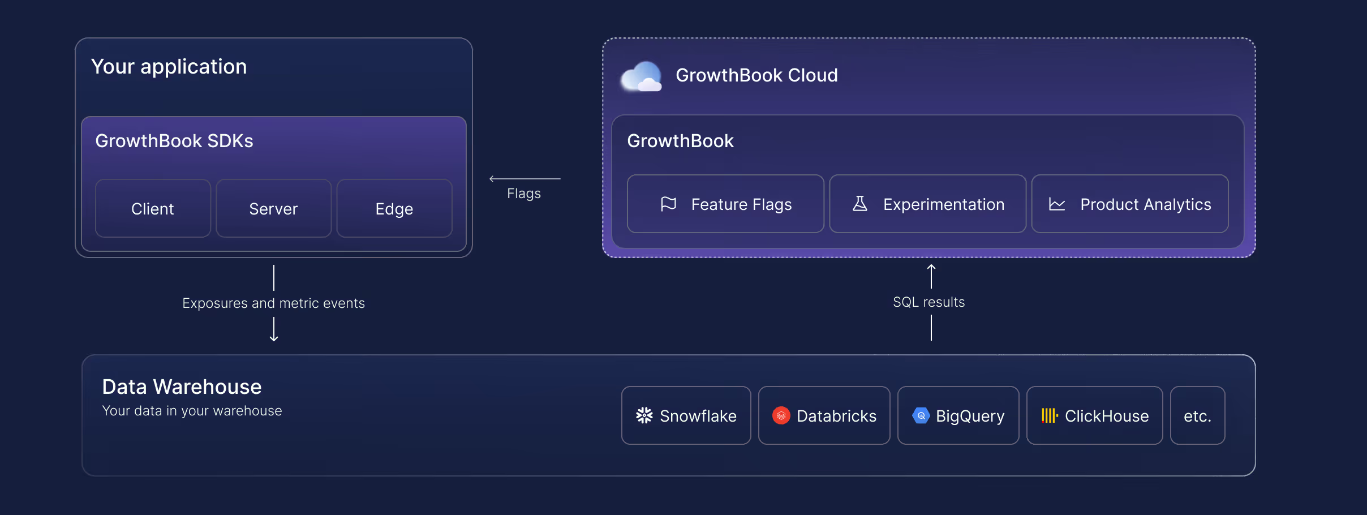
If you’re running experiments using feature flags as the delivery mechanism, you need to ensure that the experiment data is also protected. Let’s say you’re running an experiment to see if a new reminder feature improves medication adherence. You’ll need to combine flag exposure events with patient outcomes to assess that. If the platform ships these events to its own analytics store, your vendor holds a copy of that data.
To avoid any third-party risk, the analysis should run where your patient data already lives.
For instance, in GrowthBook, you can query exposure and metric data directly from your warehouse with read-only credentials. GrowthBook stores the aggregated results of each analysis, and you can view and audit the SQL behind it. For PHI workloads, connect GrowthBook to your own data warehouse.
What will your auditors ask for during a HIPAA audit?
HIPAA doesn’t have an official certification or audit process. It usually refers to an OCR investigation or a security assessment conducted by a third-party security team.
The assessor may ask to review a sample of changes and ask you to show the record behind each one. If there’s a gap, it could indicate that a safeguard wasn’t implemented or implemented properly.
Smaller changes receive the same scrutiny as bigger ones because they can have huge consequences too. In fact, a study on ByteDance’s cloud platform found that 78.1% of change-induced incidents come from low-risk changes that get minimal review.
Before an audit, you’ll want to have these ready:
- A risk analysis of which controls apply to the feature flagging tool.
- A record of changes for each flag that touches PHI.
- A list of users that have access to these flags and who reviews changes.
- Any evidence of deprovisioning users when they leave the organization.
- An activity review record showing who reviewed the flags and when.
- An exception log listing each kill switch activation and any bypassed approvals.
- A BAA or documented evidence that you don’t need one.
- A retention policy that keeps required HIPAA documentation for at least six years.
Let’s say your assessor picks one change to a flag that handles PHI. Here’s how you can walk through that change step by step:
| Step | What you produce | Where it lives in GrowthBook | What it proves |
| 1. The diff | The old and new rules, including targeting and rollout percentage | The feature page, under Compare Revisions | The change is documented, and because published revisions are locked, it shows the state at that moment. |
| 2. Who proposed it | The author, contributors, and commit message | The revision record | The change came from an identifiable user, which supports unique user identification. |
| 3. Who approved it | The reviewer, their verdict, comments, and timestamp | The revision’s review history | A second person signed off on a change to PHI-handling code. |
| 4. Independent confirmation | The same chain of events from a second source | Settings, then Log, filtered to that feature | Provides corroborating evidence of the change history and strengthens the audit trail. |
| 5. What data the rule used | The attributes the rule references, and whether they’re secure attributes | The rule definition and your attribute settings | Helps demonstrate and review whether targeting used appropriately limited PHI. |
| 6. Whether anyone skipped a control | Any change published without an approval | The revision’s review history and the audit log | Emergency changes are visible as exceptions you can explain, not quiet workarounds. |
| 7. Which environment | The environment and SDK connection the change affected | Per-environment toggle events in the audit log | You can show which apps and patients the change reached instead of estimating. |
| 8. The export | The full packet in a format your assessor can file | An audit log export, the REST API, or your SIEM | The evidence existed before anyone asked for it. |
How GrowthBook supports HIPAA for feature flag-based deployments
With the right feature flagging setup, you can stay compliant with HIPAA’s Security Rule. The goal is to keep patient data within your app and maintain a detailed record of every change a feature flag makes or is involved in.
GrowthBook gives you the controls to make that work with ease. You get capabilities like:
- Local evaluation that keeps patient attributes inside your infrastructure.
- Secure attributes and Remote Evaluation for sensitive targeting in client-side apps.
- An audit log that can’t be edited in the app, which is paired with approval flows that block self-approval on PHI-handling flags.
- Role-based permissions, SSO, and SCIM, so offboarding happens automatically in your identity provider.
- Kill switches that turn off a code path involving PHI without a redeploy.
- Self-hosting, including fully air-gapped deployments, so the whole platform runs inside your own infrastructure.
That’s why companies in regulated industries like Hims & Hers, Khan Academy, and Upstart continue to use GrowthBook for feature flagging and experimentation. GrowthBook is also SOC 2 Type II attested and compliant with regulations like GDPR, COPPA, and CCPA. If you want to:
- Review our security documentation, visit our Trust Center.
- See how the platform works, watch this 5-minute intro video or book a live demo.
I started talking to my experiments with MCP. Here's what happened



Feature flagging at scale: 5 power tools you shouldn't skip





Ready to ship faster?
No credit card required. Start with feature flags, experimentation, and product analytics — free.

