

CUPED for faster experimentation in GrowthBook


There are many ways to improve the speed of your experimentation program. One of the easiest is variance reduction via regression adjustment, often called CUPED (short for Controlled Experiment Using Pre-Experiment Data).
To get started using CUPED with GrowthBook, head over to our documentation.
How does it work?
There are many blog posts and papers on how CUPED works to increase experiment velocity. These are excellent resources that include motivation, intuition, code examples, and evidence of impact.
Rather than rehash the nitty-gritty, let's focus on a high-level example:
Imagine you're running an experiment that looks to increase sales in your online store. You release a new feature in the checkout experience and measure the total value of all purchases by each user. Some users will make large purchases, others small purchases, and others will make no purchases. In your experiment analysis, you'll average purchase across all users in variations A and B and compare the averages.
Because these users are so different, you will have considerable uncertainty about the average. However, imagine you knew how much each user spent on your site in the month before the experiment. CUPED lets you use that information to adjust purchasing behavior during the experiment, taking away the part that can be easily explained by past behavior!
You can read more about our exact implementation and how it works in our documentation. In a nutshell, we fit a very simple linear model to the pre-experiment (or pre-experiment exposure) data and use it to adjust the post-exposure data, reducing its variance.
How can you make the most of CUPED?
Measure experiment effects on leading metrics
To best take advantage of CUPED, make sure to estimate effects on predictable, repeated metrics that are leading indicators of key metrics. The more predictable metrics will likely benefit from greater variance reduction.
Why? The correlation between pre- and post-exposure data for metrics that users generate less frequently will tend to be lower. Using our example above, if we don't have reliable historical purchase data for users, then that data won't provide a big advantage in reducing variance. However, if we know how many items a user views on our site on each visit, that might be a leading indicator of purchasing and may be more strongly correlated over time.
The figure below illustrates the difference in variance reduction from CUPED across different levels of correlation between pre- and post-exposure data. Variance reduction is the difference between the orange and green distributions; the smaller spread of the green distribution indicates that we have reduced variance after using CUPED to adjust metric values. You can see that the variance reduction is greater in the right panel, where the correlation is 0.7.
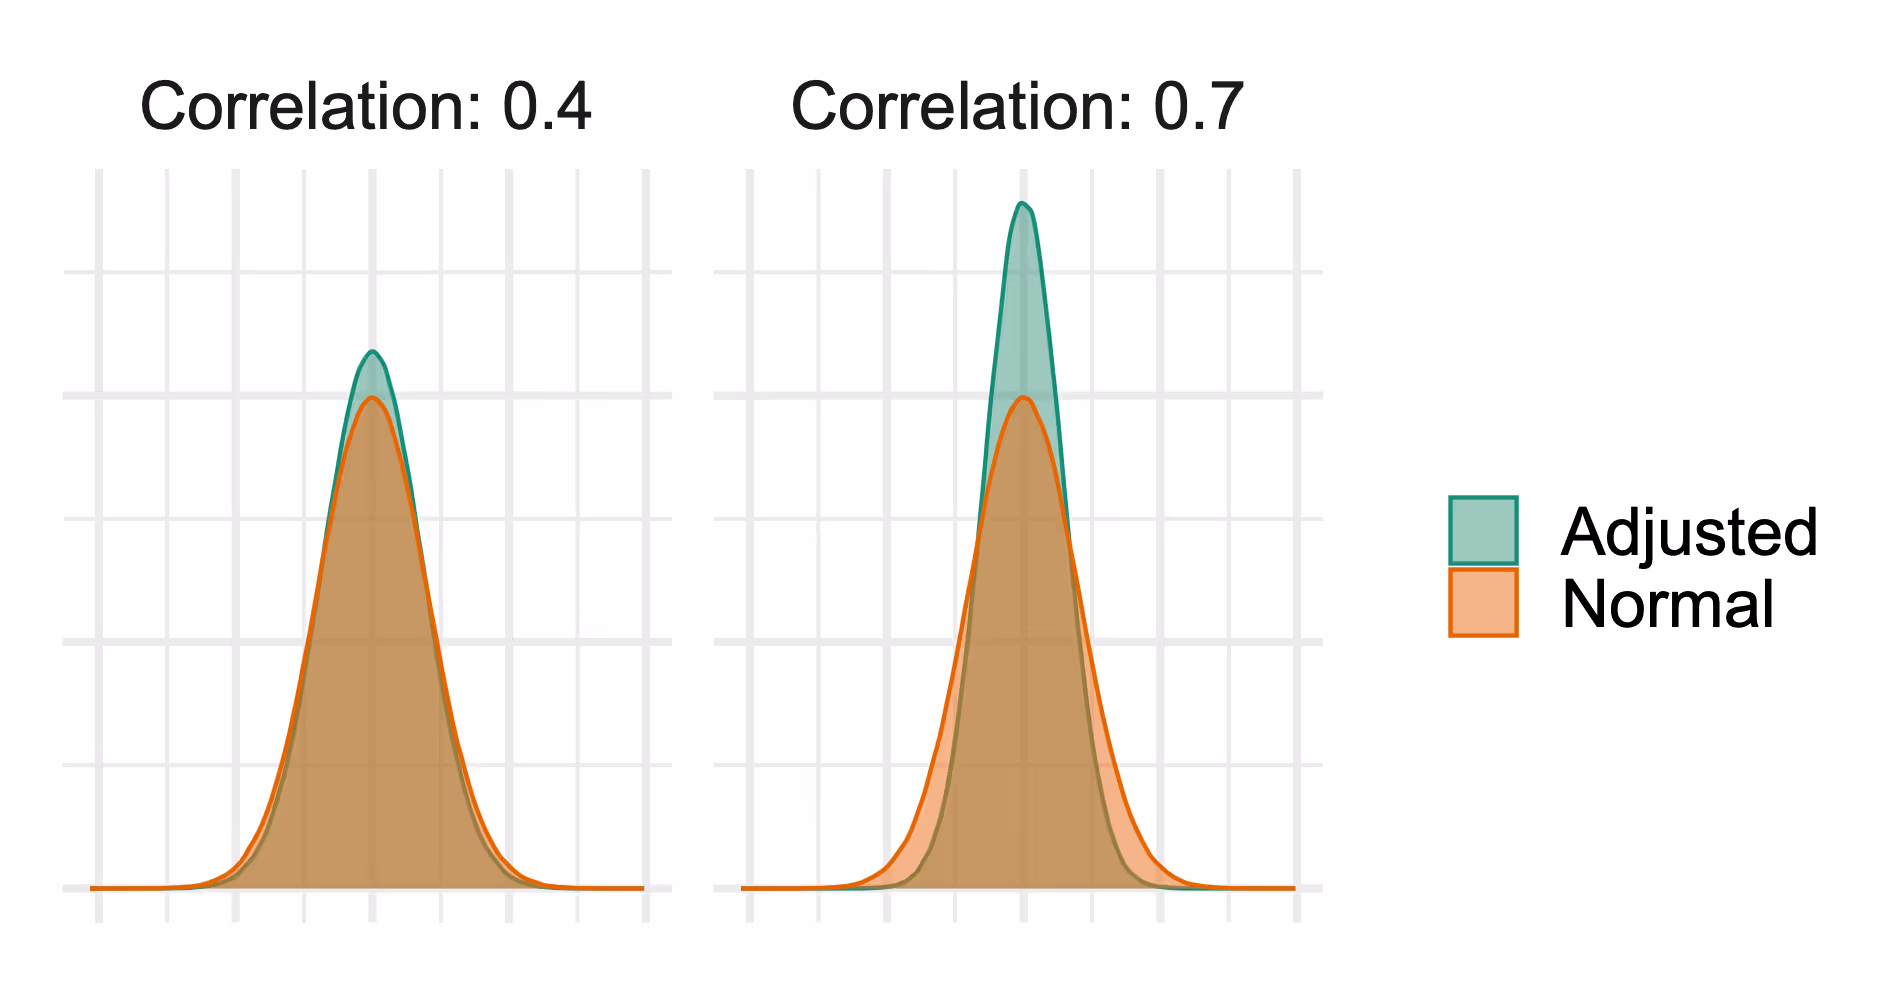
Correlation will tend to be higher for more frequent metrics, like engagement metrics, than for less frequent ones, like purchase behavior, and thus CUPED will do more to improve analyses of those more frequently produced metrics.
This advice is not unique to CUPED; the idea of using leading metrics to get faster answers from experiments is widespread. It's worth noting that the value of leading metrics increases with the availability of CUPED.
Understand your metric behavior and set the right lookback window
GrowthBook uses a (customizable) 14-day lookback window; this is the period before a user is exposed to an experiment that we use to compute their pre-experiment metric totals. The following figure shows you how this works for users who are exposed to the experiment at two different time periods.
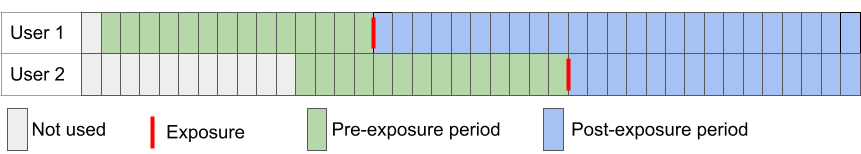
We will roll up the green days and use them as the pre-exposure measure to adjust the data from the blue days (post-exposure data).
GrowthBook is highly customizable; you can adjust this lookback window (the green area) using the CUPED settings, and you can adjust the post-exposure conversion window (the blue area) using Conversion Windows and Conversion Delays.
We recommend reviewing your metrics to determine whether there is sufficient user behavior at regular intervals to use this 14-day window, or if you need to set a longer lookback window. If the events are rare, you may find that setting a larger lookback window is more beneficial for variance reduction.
Collect data early
Set up and collect metric data before you start experimenting. CUPED only works if you have data on your users from the period before your experiment starts. If you start collecting data as early as possible, you're more likely to have data available for CUPED to work with.
How does this work for users exposed to the experiment across? Sadly, this means that CUPED will not work well for experiments involving new users or for metrics that are only collected after experiment exposures
In those instances, you are free to use the customizable settings in GrowthBook to turn CUPED off for an experiment or an individual metric. While leaving CUPED on will rarely make your variance worse, it does require scanning more days of your metric source data, and turning it off for metrics it cannot help could improve query performance.
What's next?
More sophisticated adjustment
Initially, GrowthBook uses only the pre-exposure data for the analysis metric in the regression adjustment, but future refinements to incorporate dimensional data, auxiliary metrics, and more complex models are possible.
With great power comes great responsibility
CUPED enables faster experimentation, but it does not resolve the "peeking" problem (for a discussion of this in both the Frequentist and Bayesian frameworks, see: http://varianceexplained.org/r/bayesian-ab-testing/). In Q2 of 2023, GrowthBook will add sequential testing to the Frequentist engine to help mitigate the problem, both with and without CUPED.
Related articles
Ready to ship faster?
No credit card required. Start with feature flags, experimentation, and product analytics — free.

