

How to interpret a confidence interval step-by-step

Most people who work with confidence intervals are using a definition that's subtly wrong — and that wrong definition quietly corrupts every decision they make downstream.
The most common version goes something like: "there's a 95% probability the true value falls between X and Y." It feels right. It's also not what a confidence interval actually says. The 95% is a property of the method that built the interval, not a probability statement about the specific interval in front of you. Getting that distinction right is the foundation everything else in this article builds on.
This guide is for engineers, PMs, and data analysts who work with experiment results and statistical outputs — especially anyone who reads CI numbers off a dashboard and needs to know what to actually do with them. It moves step by step through the mechanics and the meaning, without assuming a statistics background. Here's what you'll learn:
- What a confidence interval actually tells you — and the formal definition most people get wrong
- A three-step template for how to interpret a confidence interval correctly, across any parameter type
- The four most common CI misinterpretations, why each one is wrong, and how to avoid them
- What interval width reveals about your data — including how sample size and variability drive it
- How to use CIs to make ship decisions from A/B test results, including what it means when an interval straddles zero
The article is structured to build in order. The first section clears out the misconception so the rest of the framework sits on solid ground. The middle sections give you the practical tools — the interpretation template, the misinterpretation checklist, the width diagnostics. The final section applies all of it to A/B testing, where these concepts translate directly into product decisions.
What a confidence interval actually tells you (and what it doesn't)
Before you can interpret a confidence interval correctly, you need to clear out the definition most people are working with — because it's wrong, and it corrupts every downstream judgment you make. This isn't a minor technical quibble.
The misunderstanding is so common that statistician Kristoffer Magnusson has called CIs "as unintuitive and as misunderstood as p-values," and the peer-reviewed literature includes papers dedicated entirely to correcting it. If you've been doing this work for years and something about CIs has always felt slightly off, this is probably why.
What the definition actually says (and why most people have it wrong)
A confidence interval is a range computed from sample data using a procedure that, over many repetitions, would capture the true population parameter at the stated confidence level. When you see a 95% CI, that 95% is a property of the method used to construct the interval — not a property of the specific interval sitting in front of you.
The true population parameter — the mean, proportion, or effect size you're trying to estimate — is a fixed value. It doesn't move. It either falls inside your interval or it doesn't. There is no probability to assign to that question once the interval has been computed, because neither the parameter nor the interval is random at that point. The randomness existed in the sampling process, and it's already been resolved.
The frequentist procedure: what "95% confident" actually refers to
The right way to think about a 95% CI is through the lens of repeated sampling. Imagine running the same experiment 100 times, each time drawing a new sample from the same population and computing a new confidence interval. Approximately 95 of those 100 intervals would contain the true parameter. About 5 would not — and you'd have no way of knowing which ones.
As Magnusson puts it: "95% confidence is a confidence that in the long-run 95% of the CIs will include the population mean. It is a confidence in the algorithm and not a statement about a single CI."
This is sometimes called the "dance of CIs" — a framing developed by statistician Geoff Cumming to capture the idea that each interval is one draw from a long-run process. The specific interval you computed in your study is just one step in that dance. It may or may not contain the true value.
The 95% guarantee describes how the process performs across many repetitions — not whether this particular interval succeeded.
The single-interval trap
Here's the interpretation you've almost certainly heard — and probably used yourself: "There is a 95% probability that the true value lies between X and Y."
It's wrong, and understanding why matters. In frequentist statistics, probability statements require a random variable. The true population parameter isn't random — it's fixed, even if unknown. And once you've computed your interval from your data, that interval is also fixed. There's no randomness left to attach a probability to. As Magnusson states plainly: "In frequentist terms the CI either contains the population mean or it does not."
The reason this error is so persistent is that it feels right. You're uncertain about the true value, so it seems natural to express that uncertainty as a probability. But that kind of uncertainty — the uncertainty that comes from not knowing a fixed fact — is handled by a different framework entirely.
Bayesian credible intervals are specifically designed to produce the probability statement most people think they're getting from a frequentist CI. They're a legitimate and useful tool, but they require different assumptions and a different computational approach. A frequentist CI is not a Bayesian credible interval wearing different clothes.
One more implication worth flagging before moving on: interval width doesn't tell you whether your specific interval captured the true value. Even a very narrow CI can miss the true parameter entirely.
Width reflects the precision of your estimation procedure — how tightly your method can constrain the estimate given your sample — but it says nothing about whether this particular interval is one of the 95% that succeeded or one of the 5% that didn't. That distinction will matter when you get to interpreting width as a diagnostic signal.
Three steps that prevent the most common confidence interval errors
Most interpretation errors happen not because someone misunderstands statistics, but because they skip a step. They see two numbers and a percent sign and jump straight to a conclusion.
The three-step template below slows that process down in a useful way: identify what's being estimated, state the confidence level explicitly, then read the bounds as a plausible range. Each step does real work, and skipping any one of them opens the door to the misinterpretations covered later in this article.
Name the parameter before you read a single number
Before you read a single number, establish what the confidence interval is actually bounding. Is it a population mean? A proportion? A difference in means between two groups? A relative lift from a treatment? The answer changes how you phrase the interpretation and what the bounds actually mean in context.
This step is less obvious than it sounds. In A/B testing, for example, a platform like GrowthBook produces CIs on both absolute effects — the raw difference in means between control and treatment — and relative effects, which express that difference as a percentage lift.
Both are confidence intervals, but they're bounding different parameters. Treating a CI on relative lift as if it were a CI on an absolute difference will produce a meaningfully wrong interpretation. Identifying the parameter first prevents that error.
The confidence level is load-bearing, not a formality
The confidence level belongs in every interpretation statement, not as a formality but because it's load-bearing information. A 90% CI and a 99% CI on the same data produce different bounds, and a reader who doesn't know which procedure generated the interval can't evaluate what the bounds mean.
The standard phrasing template is: "We are [X]% confident that the [parameter] is between [lower bound] and [upper bound]." That phrasing is worth using almost verbatim, because it encodes the correct frequentist framing — it's a statement about the procedure's reliability, not a probability claim about this specific interval. The distinction matters and is addressed in detail in the next section of this article.
Bounds define plausibility, not certainty
The lower and upper bounds define the range of parameter values that are consistent with your observed data at the stated confidence level. Values inside the range are plausible given what you observed; values outside are less consistent with the data, though not ruled out entirely.
The classic worked example from Penn State's STAT 200 course puts this concretely: "We are 95% confident that the mean IQ score in the population of all students at this school is between 96.656 and 106.422." That sentence does all three steps in one pass — it names the parameter (mean IQ score of all students at the school), states the confidence level (95%), and reads the bounds as a plausible range (96.656 to 106.422). The precision of those bounds reflects the underlying data; they come from a point estimate plus and minus a margin of error derived from the standard error of the sample.
The same three steps work across every parameter type
The same three-step structure transfers directly to any parameter type. For a proportion, the interpretation might read: "We are 95% confident that the true conversion rate is between 3.2% and 4.8%." A treatment effect follows the same pattern: "We are 95% confident that the treatment increased revenue per user by between $0.12 and $0.87." The structure is identical — parameter, confidence level, plausible range — even though the underlying variance formulas differ substantially between a binomial proportion and a mean metric.
That last point matters for practitioners using experimentation platforms. Some experimentation platforms handle mean metrics, proportion metrics, ratio metrics, and quantile metrics with distinct variance estimation approaches, which means the bounds you're reading were computed differently depending on the metric type.
The interpretation template doesn't change, but the "identify the parameter" step should include knowing what kind of metric generated the interval — because that affects how much weight to put on the precision of those bounds.
One scoping note: this template applies to frequentist confidence intervals. A Bayesian experimentation engine produces credible intervals, which carry a subtly different interpretation. The three-step structure is a reasonable starting point for credible intervals too, but the confidence level statement means something different in that framework.
The most common confidence interval misinterpretations to avoid
These aren't beginner mistakes. A 2014 study by Hoekstra, Morey, Rouder, and Wagenmakers, published in Psychonomic Bulletin & Review, found that individuals across all levels of statistical expertise — from students to seasoned researchers — routinely endorsed false statements about confidence intervals.
Morey et al. followed up in 2015 defending and reinforcing those findings against academic criticism, making the point even harder to dismiss: CI misinterpretation is a documented, peer-reviewed problem, not an anecdote about people who skipped their stats class.
Understanding where the errors cluster, and why each one is wrong, gives you a practical filter you can apply when reading a paper, reviewing a dashboard, or explaining results to a stakeholder.
"There's a 95% probability the true value falls in this interval"
This is the most pervasive misconception, and it's intuitive enough that even careful researchers fall into it. The error is treating a realized interval as if it carries a probability. It doesn't. Once you've computed a confidence interval from a specific sample, that interval is fixed — it's a pair of numbers. The true population parameter is also fixed, even if unknown. Either the interval covers it or it doesn't. There's no probability left to assign.
As established in the opening section, the 95% is a property of the sampling procedure — not a probability statement about the interval you're currently looking at. A useful analogy: imagine a machine that produces balls, 95% of which are black across many production runs.
Once a ball has been produced and is sitting in front of you, asking "what's the probability this ball is black?" doesn't quite make sense in the frequentist frame — it either is or it isn't. The same logic applies to a realized confidence interval. The probability statement belongs to the sampling procedure, not to the specific interval it generated.
"The mean will fall within the interval 95% of the time"
This is a close cousin of the first misconception but distinct enough to address separately. It conflates the long-run frequency property of the CI procedure with a claim about a single interval's reliability over time. The correct statement is that 95 out of 100 intervals constructed from repeated independent samples would contain the true population mean.
The mean isn't bouncing around relative to one fixed interval — the intervals themselves vary from sample to sample, and 95% of them, across that process, would capture the parameter. Any single interval you've computed doesn't have a 95% "hit rate" on its own; it either contains the true mean or it doesn't.
"Values outside the CI are impossible or ruled out"
The bounds of a confidence interval are not hard cutoffs. A value sitting just outside the interval is nearly as consistent with the data as a value sitting just inside it. The CI represents a range of parameter values that are plausible given the observed data and the chosen confidence level — it's a gradient of support, not a fence.
Treating the boundary as a definitive exclusion zone leads to overconfident conclusions, particularly when the interval is wide or the sample size is small. The correct framing is that values outside the CI are less supported by the current data, not that they've been ruled out.
"A 95% CI means 95% of my data points fall within that range"
This confusion mixes up two fundamentally different statistical objects: a confidence interval and a data distribution (or prediction interval). A confidence interval is a statement about a population parameter estimate — the mean, a proportion, a regression coefficient. It narrows as sample size increases, because more data produces a more precise estimate.
A range that captures 95% of individual observations behaves entirely differently and doesn't shrink the same way as you collect more data. If you're seeing a CI reported on a dashboard and interpreting it as a description of where most of your users or data points land, you're reading the wrong quantity for that question.
Misreading any of these can have real consequences in practice. In an experimentation context, incorrectly treating a CI as a probability statement about a single result can lead to overconfident ship decisions or misplaced certainty about effect sizes — exactly the kind of inference error that rigorous experiment analysis is designed to prevent.
What the width of a confidence interval reveals about your data
Most practitioners read a confidence interval by checking whether it includes or excludes a null value — does the interval cross zero, or doesn't it? That's a reasonable starting point, but it only uses half the information the interval contains.
The distance between the lower and upper bounds is a diagnostic signal in its own right. It tells you how precise your estimate is, and it reflects two measurable properties of your data: how many observations you collected and how variable the underlying metric is.
How sample size shrinks (or widens) a confidence interval
The mechanics here follow directly from the standard error formula for a mean: SE = s / √n. Because sample size appears under a square root, the relationship between n and interval width is nonlinear in a way that matters enormously for study design.
Consider a concrete example. Suppose you're measuring weekly screen time across a student population, with a sample mean of 23.4 hours and a standard deviation of 5.1 hours. At n = 100, a 95% CI has a margin of error of roughly 1.02 hours, producing an interval of (22.38, 24.42) — a width of about 2 hours.
Drop the sample size to n = 25, keeping everything else identical, and the margin of error nearly doubles to 2.11 hours, giving an interval of (21.29, 25.51). The same data-generating process, the same confidence level, and the same underlying variability — but the interval is now twice as wide simply because you collected fewer observations.
The practical implication of the square-root relationship is worth stating explicitly: to cut your margin of error in half, you need to quadruple your sample size. This is the most actionable lever practitioners control at the design stage, and understanding it prevents the common mistake of expecting linear returns from incremental sample increases.
How data variability affects interval width
Sample size is a lever you can pull. Population variance often isn't. When the underlying metric is inherently noisy — revenue per user, for instance, rather than a binary conversion event — the standard deviation in the SE formula is large, and the resulting interval will be wide regardless of how many observations you collect.
This distinction matters for interpretation. A wide CI on a high-variance metric is not a study failure. It's an honest reflection of the data. The interval is telling you that the true parameter could plausibly sit across a broad range, and that's a real property of the measurement, not an artifact of poor methodology.
Conflating wide intervals with bad data leads analysts to dismiss valid results or, worse, to keep collecting data past the point where more observations can meaningfully narrow the interval.
The two drivers — sample size and variability — are independent. A study with a large sample and a high-variance metric can still produce a wide interval. A study with a small sample and a low-variance metric may produce a surprisingly tight one. Reading width correctly means asking which of these two forces is at work.
A wide CI straddling zero is a power problem, not a null result
Width becomes especially diagnostic when an interval straddles zero or a null value. The tempting interpretation is that no effect exists. But a wide interval straddling zero carries a different meaning: both a meaningful positive effect and a meaningful negative effect are statistically plausible. The study can't distinguish signal from noise — not because there's no signal, but because the estimate isn't precise enough to find it.
This is the retrospective version of statistical power. If the interval is so wide that it encompasses effect sizes ranging from "worth shipping" to "actively harmful," the experiment was likely underpowered. The CI width is telling you that the study needed more data, not that the intervention had no impact.
This is also where variance reduction techniques become relevant. GrowthBook implements CUPED (Controlled-experiment Using Pre-Experiment Data), which reduces the variance of treatment effect estimates by accounting for pre-experiment covariates. Lower variance means a smaller standard error, which means narrower confidence intervals — and narrower intervals mean more precise estimates from the same number of observations. It's a direct application of the variability-width relationship described above.
When you look at a CI, the width deserves as much attention as the position. A narrow interval centered on a small effect is telling you something different from a wide interval centered on the same point estimate. The first is precise; the second is uncertain. Treating them identically discards information you already have.
What a confidence interval's position and width tell you about an A/B test
A confidence interval on an A/B test result isn't decoration — it's the primary instrument for making a defensible ship decision. The p-value tells you whether to take a result seriously; the CI tells you what the result actually means in magnitude and direction.
Once you understand how to read the interval's position relative to zero and what its width signals about your experiment's precision, you have everything you need to move from statistical output to product decision.
How CIs are computed on treatment effects
In an A/B test, the CI isn't built around either group's mean in isolation. It's built around the difference between treatment and control — the estimated treatment effect. The standard frequentist formula is: CI = point estimate ± (critical value is approximately 1.96 under a normal distribution × standard error). At a 95% confidence level, the critical value is approximately 1.96 under a normal distribution. The point estimate sits at the center; the bounds define the range of plausible effect sizes consistent with your data.
One important nuance worth flagging: platforms like GrowthBook default to Bayesian statistics, which produces a credible interval rather than a frequentist confidence interval — typically flagging results as significant when there is a 95% probability the variation outperforms baseline. The interpretation is subtly different from a frequentist CI, but in practice both types of intervals are used similarly when making ship/no-ship calls.
When the CI sits entirely above zero
This is the win scenario. Both the lower and upper bounds of the interval are positive, meaning every plausible effect size consistent with your data points in the same direction: the treatment helped. The lower bound is particularly useful here — it represents the most conservative estimate of the effect at your chosen confidence level, which is the number to use when forecasting minimum business impact.
That said, a CI entirely above zero still carries a 5% false positive rate at the 95% confidence level. GrowthBook's documentation states this directly: a statistically significant positive result means the variation is actually better than baseline 95% of the time — which means 5% of the time, it isn't.
Factor that into how aggressively you act on borderline wins. A narrow CI above zero gives you more precise effect size estimates; a wide one above zero still supports shipping, but with less certainty about the magnitude.
When the CI straddles zero
A CI that crosses zero is the inconclusive outcome, and it's the one most commonly misread. It does not mean there's no effect. It means your experiment didn't collect enough evidence to distinguish a real effect from noise. Both a meaningful positive effect and a meaningful negative effect remain statistically plausible given the data you have.
A wide CI straddling zero is the power problem described in the previous section — both a meaningful positive and a meaningful negative effect remain plausible. The appropriate response is not to call it a null result.
Consider running longer, increasing sample size, or applying variance reduction techniques like CUPED, which narrows CIs by reducing noise in the outcome metric. If the true effect size is smaller than the experiment's Minimal Detectable Effect, the test may never reach significance even if a real effect exists — and that's a design problem to solve before the next experiment, not a verdict on the current one.
When the CI sits entirely below zero
Both bounds negative means the treatment performed worse than control across the full range of plausible effects. This is the loss scenario, and it's more common than most teams expect — a meaningful share of A/B tests result in the treatment actively hurting the metrics being measured. A CI entirely below zero is the statistical signal that catches these cases before they reach production.
It's worth reframing what this outcome means for the team running the experiment. As GrowthBook's documentation puts it, "failing fast through experimentation is success in terms of loss avoidance, as you are not shipping products that are hurting your metrics of interest."
A narrow CI entirely below zero is actually a high-quality result — it gives you a precise estimate of how much harm the treatment causes, which can inform whether a modified version is worth testing or whether the hypothesis should be abandoned entirely.
The one distinction that makes every other CI judgment easier
Every practical skill covered in this article — reading bounds as plausible ranges, diagnosing width as a power signal, using CI position to make ship decisions — depends on one foundational distinction: the 95% belongs to the procedure, not to the interval.
Once that distinction is genuinely internalized, the rest of the framework follows naturally. The misinterpretations stop feeling like arbitrary rules to memorize and start feeling like obvious errors. The width diagnostics stop feeling like secondary concerns and start feeling like essential information. The A/B test decision framework stops feeling like a checklist and starts feeling like a coherent way of reading evidence.
Three questions that do most of the interpretive work
When you encounter a confidence interval in the wild — on a dashboard, in a paper, in a stakeholder presentation — three questions do most of the interpretive work:
- What parameter is this bounding, and is that the parameter I actually care about?
- What confidence level generated it, and what does that imply about the false positive rate?
- What does the width tell me about the precision of this estimate and the power of the underlying study?
The first question prevents the parameter confusion described in the three-step section. The second question keeps the confidence level load-bearing rather than decorative. The third question extracts the diagnostic signal that most practitioners leave on the table. Running through all three takes about ten seconds and catches the majority of interpretation errors before they propagate into decisions.
Translating CI results for stakeholders without losing precision
The standard frequentist phrasing — "we are 95% confident that the true value lies between X and Y" — is technically correct but often lands poorly with non-technical stakeholders. The word "confident" sounds like a probability claim, which is exactly the misinterpretation this article has been working to prevent.
One approach that preserves precision while improving accessibility: lead with the point estimate and use the interval to communicate uncertainty. "Our best estimate is that the treatment increased conversion by 2.1 percentage points. The data are consistent with effects ranging from 0.8 to 3.4 points." That framing conveys the same information without triggering the probability misread.
If your team runs on a Bayesian experimentation engine, the credible interval it produces actually does support a more direct probability framing — something like "there's a 95% probability the treatment outperforms control given the data we observed." That statement is technically valid in the Bayesian framework and is often easier for stakeholders to act on. The key is knowing which framework generated the interval before choosing how to describe it.
From knowing the definition to defaulting to the right frame
Statistical fluency around confidence intervals isn't primarily about memorizing the correct definition — it's about defaulting to the right frame automatically, under time pressure, when a result is sitting in front of you and a decision needs to be made.
The right frame is: this interval was produced by a procedure that works 95% of the time. This specific interval either contains the true value or it doesn't. The width tells me how precise the estimate is. The position tells me what direction the evidence points. Those four pieces of information are everything the interval actually contains.
What to do next: Pull up the most recent A/B test result your team has run. Identify the parameter being estimated. Check whether the CI is frequentist or Bayesian. Read the width as a power diagnostic — is it narrow enough to distinguish meaningful effects from noise? Read the position relative to zero — does it sit entirely above, straddle, or sit entirely below? Then write out the interpretation using the template from this article.
If the phrasing feels unfamiliar, that's the signal that the old frame is still running in the background. The goal is to make the correct frame the default — and the only way to get there is to practice applying it to real results until it stops requiring conscious effort.
Related insights
Related Articles
In healthcare, “Can we randomize it?” is the wrong first question. Start with “Could either experience change care, rights, privacy, or access?”
A/B testing can improve digital intake, appointment access, patient education, clinician workflows, and administrative operations. It can also create unacceptable risk when teams treat a clinical or consent decision like an ordinary conversion funnel.
The difference is not the label on the method. A/B tests are randomized experiments. What matters is the treatment, purpose, affected population, data flow, and oversight required in the organization and jurisdiction. This guide provides a practical product framework, not a substitute for legal, clinical, privacy, security, or institutional review.
Draw the boundary before designing variants
Create an intake step that classifies the proposed change before anyone builds a treatment. At minimum, ask:
- Can the change alter diagnosis, treatment, triage, dosage, or clinical recommendations?
- Can it delay or discourage access to care, accommodations, or urgent help?
- Does it change informed consent, privacy choice, required disclosure, or patient cost?
- Does it use protected or sensitive health information for assignment or measurement?
- Does it include children, people in crisis, or another population requiring added protection?
- Is the purpose internal quality improvement, or is it designed to contribute to generalizable knowledge?
- Could the software function fall within medical-device or clinical decision-support oversight?
The HHS quality-improvement guidance says many activities limited to improving patient care and collecting operational data are not research under the cited human-subjects regulations. It also states that some quality-improvement activities can have a research purpose, in which case human-subject protections may apply. A product team should not make that determination informally; route it to the organization’s authorized office.
Likewise, software that influences clinical decisions is not automatically an ordinary product surface. The FDA’s January 2026 clinical decision-support guidance explains that some software functions are excluded from the device definition while other patient- or caregiver-facing functions can remain subject to digital-health policy. Clinical and regulatory owners need to classify the function before experimentation.
Start with lower-risk operational questions
The safest early program tests reversible changes where both variants meet the same clinical, accessibility, privacy, and disclosure requirements.
Appointment reminder timing
Compare 2 approved reminder schedules or message structures to reduce missed appointments. Keep required details, opt-out behavior, language support, and urgent-contact instructions constant.
Use completed appointments or timely rescheduling as the primary outcome. Track cancellations, patient contacts, message delivery, opt-outs, wrong-recipient risk, and differences across language, age, disability, or access groups. A higher click rate is not enough if no-show rates or trust worsen.
Patient portal navigation
Test whether a clearer information architecture helps people complete a high-value administrative task, such as finding results, updating insurance, or sending a non-urgent message. Preserve emergency guidance and clinical escalation paths in both variants.
Measure successful task completion and time to completion. Guard against repeated navigation, abandonment, accessibility failures, mistaken message routing, and increased call-center burden. Use usability testing before the A/B test to catch failures randomization should never expose.
Administrative form sequence
Compare a long form with a staged flow, or test the order of non-clinical fields. Do not omit information needed for safe care, billing transparency, consent, or legal compliance.
Measure accurate completion, not just submission. Track validation errors, correction rates, staff rework, abandonment, and time to appointment. If the treatment collects sensitive data, confirm necessity and access controls before launch.
Educational content layout
Test 2 ways to present the same clinician-approved information: summary-first versus stepwise, text plus illustration versus text alone, or a clear action checklist versus a dense paragraph. Keep the medical meaning, risks, contraindications, and escalation advice equivalent.
Use a comprehension or appropriate next-action metric when feasible. Page time and clicks can be misleading. Accessibility, language quality, and comprehension across health-literacy levels belong in the guardrail plan.
Review the design before launch
Use a trustworthy experiment-design session to pressure-test metrics, safety checks, and decision rules before exposing patients or clinicians.
Watch the Experiment Design Session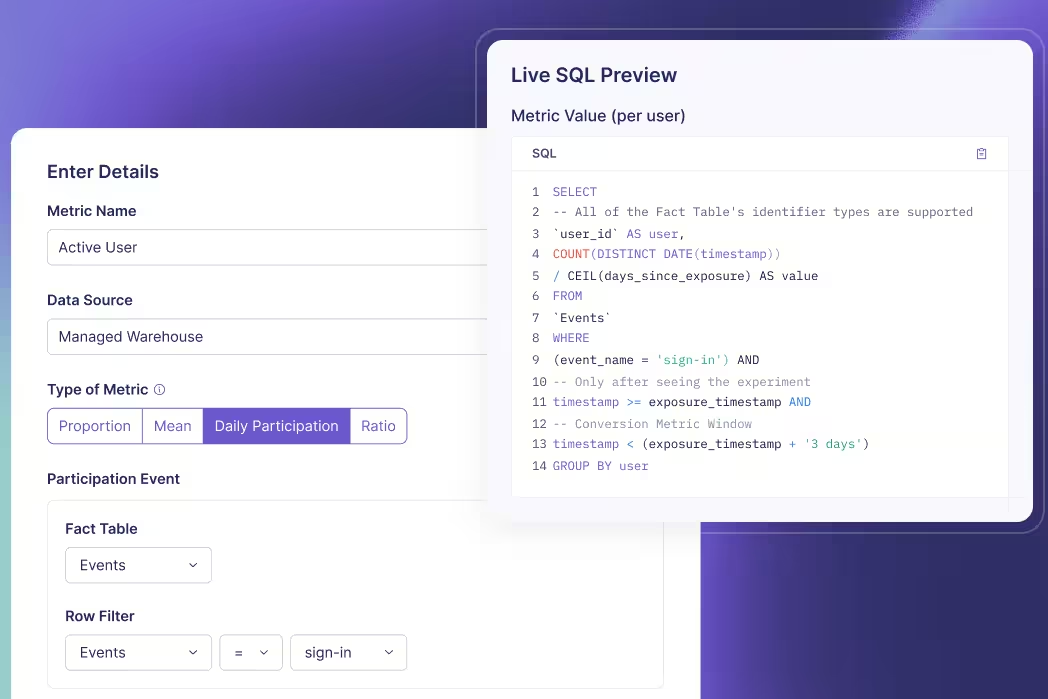
Use stronger controls for care-adjacent products
Some product changes are not clinical interventions but can still influence care. They need clinical ownership, narrower eligibility, conservative ramps, and explicit stopping criteria.
Clinician workflow support
A test might compare how a work queue prioritizes administrative follow-up, how a note template reduces documentation work, or how a non-diagnostic alert is presented. The treatment should not silently alter the clinical standard of care.
Randomize at the unit that prevents contamination. Individual clinician assignment may fail when teams share queues and handoffs; clinic- or unit-level clusters may better match the workflow. Measure task completion and time saved, with guardrails for missed work, overrides, escalations, documentation quality, and staff workload.
Preventive-care outreach
Compare approved outreach content or channels for people already eligible under the same clinical rule. Do not experiment with whether one group receives necessary care or required notice.
Use completed appropriate follow-up as the primary outcome. Track opt-outs, unreachable patients, scheduling capacity, disparities, complaints, and downstream cancellations. If the treatment drives demand beyond operational capacity, a messaging lift can make access worse.
Digital adherence support
Test the presentation or timing of an approved reminder, checklist, or educational cue. Avoid treatment changes that could be interpreted as personalized medical advice without the corresponding validation and oversight.
Measure the intended behavior with caution. Self-reported completion or app engagement is not a clinical outcome. Include adverse-event reporting, escalation pathways, disengagement, and privacy events where relevant.
Feature rollout in health software
Use feature flags to separate deployment from release, start with internal or trained cohorts, and expand only when technical and clinical guardrails remain healthy. GrowthBook’s feature flag platform supports targeted rollouts and kill switches, while the experiment layer measures impact.
The rollback plan must describe more than turning off a flag. Determine whether the old experience remains clinically and operationally safe, how queued work is reconciled, what happens to partial workflows, and who is authorized to stop exposure.
Protect data by design
Do not send a broad event stream to an experimentation vendor and decide later which fields were unnecessary. Inventory the data before implementation:
| Data question | Required decision |
|---|---|
| Assignment | What is the least identifiable stable unit that works? |
| Eligibility | Which sensitive attributes are truly needed? |
| Exposure | What event proves the treatment was delivered? |
| Outcomes | Can metrics be computed inside the governed data environment? |
| Access | Which roles can view assignments, segments, and results? |
| Retention | When are raw records, logs, and exports removed? |
The HHS minimum-necessary guidance describes limiting uses, disclosures, and requests for protected health information to what is needed for the intended purpose, with policies based on roles and recurring versus non-routine access. Apply that principle to experiment attributes, debugging logs, dashboards, and downloaded readouts.
Pseudonymous identifiers reduce exposure but do not automatically make a dataset non-sensitive or outside applicable rules. Review linkability, small cohorts, free-text fields, URLs, device metadata, and combinations that can reveal a condition. Never put clinical details or identifiers in feature names, variation labels, or URLs.
A warehouse-native experimentation approach can query approved metrics where the organization already governs them. Architecture does not create compliance on its own; teams still need contracts, access control, auditability, retention rules, security review, and configuration that matches the approved data flow.
Keep unsafe questions out of product experimentation
An experimentation policy should name prohibited or separately governed categories. Product teams should not discover the boundary only after a proposal reaches launch review.
Do not use an ordinary product A/B test to withhold a clinically indicated service, emergency direction, safety warning, accessibility accommodation, required disclosure, or legally protected choice. Do not reduce the visibility of risks to improve completion. Do not randomize a diagnostic or treatment recommendation without the clinical, regulatory, and research framework appropriate to that intervention.
Avoid treatments that exploit fear, urgency, shame, or uncertainty about health. A message can increase appointment conversion while undermining informed choice. Likewise, do not test whether patients tolerate a harder cancellation, more confusing privacy control, or hidden cost. Both variants must meet the organization’s baseline standard for respectful and comprehensible communication.
Clinical AI and decision-support changes need an evaluation program beyond a click-based A/B test. Validate the model offline, examine performance and failure modes across relevant populations, review human factors, and stage deployment with clinical monitoring. An online comparison may contribute evidence only after both treatments meet the safety threshold for exposure.
When an activity may be human-subjects research, follow the institution’s process before enrolling or exposing anyone. HHS research-oversight training states that covered non-exempt human-subjects research requires the applicable review and that informed consent requirements apply unless the IRB authorizes otherwise. The product team should preserve the determination, protocol version, approved treatment, and reporting obligations with the experiment record.
Finally, do not interpret lack of detected harm as proof of safety. Rare adverse events, small vulnerable groups, and outcomes that occur after the experiment window may be underpowered. Use prior evidence, incident monitoring, qualitative reports, and post-rollout surveillance alongside the randomized estimate.
Define patient-centered metrics and guardrails
Healthcare teams need more than a conversion scorecard. Build a measurement hierarchy:
- Primary outcome: the operational or patient-facing result that answers the decision.
- Process diagnostics: steps that explain why the treatment worked or failed.
- Safety guardrails: outcomes that trigger a stop or clinical review.
- Equity checks: predeclared groups where access or benefit could differ.
- Operational guardrails: staffing, wait time, rework, cost, and downstream capacity.
Define the practical threshold before launch. A statistically detectable change may be too small to justify implementation, and a neutral aggregate can hide meaningful harm in a protected or vulnerable group. At the same time, slicing results across many small subgroups increases false-positive risk and can expose sensitive attributes. Predeclare the equity questions that matter and use appropriate privacy and multiple-testing controls.
GrowthBook supports reusable fact tables and metrics so teams can keep definitions reviewable. Use a power analysis for the primary outcome and critical guardrails. If the required sample or duration is unrealistic, do not weaken the standard; use usability research, simulation, staged quality improvement, or a larger treatment contrast.
Create a healthcare experiment review packet
Before launch, the owner should provide one reviewable packet:
- purpose, hypothesis, and operational decision
- classification and required oversight determination
- affected population and exclusion criteria
- clinical, privacy, security, accessibility, and compliance approvals
- treatment screenshots or workflow diagrams
- assignment, exposure, and data-flow design
- primary outcome, diagnostics, guardrails, and equity checks
- sample plan and stopping rule
- rollout stages, monitoring owner, and rollback procedure
- patient or clinician communication plan, if applicable
- documentation and retention plan
Use an approval matrix that names accountable people. Product approval does not replace clinical approval; a privacy review does not settle human-subjects research status; and an IRB determination does not automatically approve the production security architecture.
The WHO clinical-trial best-practices guidance emphasizes ethical standards, regulatory considerations, patient-centered research, transparency, and stakeholder collaboration. Not every healthcare product experiment is a clinical trial, but high-risk work should inherit the same respect for people and evidence.
Build trust into the experimentation program
Start with reversible operational improvements where both experiences are already acceptable. Prove that the team can classify risk, minimize data, validate assignment, monitor safety, and document decisions before expanding scope.
Publish internal rules for what teams may test, what requires added review, and what is out of bounds. Maintain an experiment registry and audit trail. Record neutral and negative results so a new team does not repeat the same risky idea.
GrowthBook can support the controlled delivery and analysis layer through experimentation, feature flags, permissions, and warehouse-defined metrics. The organization remains responsible for the clinical, ethical, legal, privacy, and operational framework around every test.
In healthcare, speed is valuable only when the learning process protects the people whose behavior creates the data.
Build a governed test workflow
Connect controlled releases to reviewable metrics and decision rules while keeping healthcare data in your approved architecture.
Get Started With GrowthBook
The right statistical test is determined by the question and data-generating process, not by which function is easiest to run. Start with the outcome, groups, and dependence structure; the test name comes later.
Z-tests, t-tests, chi-square tests, and analysis of variance (ANOVA) all compare observed data with a null model. They differ in the kind of outcome they model, the uncertainty they estimate, and the number or structure of groups they can compare.
For a simple product experiment, a useful first pass is:
- continuous outcome, two independent groups: usually a Welch two-sample t-test
- binary proportion, two large independent groups: a two-proportion z-test is common
- categorical counts across groups: chi-square test, if expected counts are adequate
- continuous outcome across three or more groups: one-way ANOVA or Welch ANOVA
Those rules are a starting point. Paired observations, clusters, ratios, repeated measures, heavy tails, covariate adjustment, or sequential monitoring require a model that reflects the design.
Choose from the outcome and hypothesis
Write the estimand before choosing a test. An estimand is the quantity the experiment is trying to estimate: a difference in mean revenue, a difference in conversion probability, or an association between two categorical variables.
| Question | Outcome | Common test |
|---|---|---|
| Did average order value change between A and B? | Continuous | Welch two-sample t-test |
| Did signup probability change between A and B? | Binary | Two-proportion z-test |
| Is plan choice associated with variant? | Categorical, 3+ levels | Chi-square test of independence |
| Do mean task times differ across four variants? | Continuous | One-way ANOVA |
| Did the same users' scores change before and after? | Paired continuous | Paired t-test |
The number of groups alone is insufficient. Conversion in four variants is still categorical data; a chi-square or binomial model may fit. Revenue in two groups is continuous; a t-test or regression is more natural.
The University of Michigan's statistical-test guide uses the same sequence: identify variable types and the relationship being tested before selecting a method.
When to use a z-test
A z-test compares a standardized estimate with the standard normal distribution. The classical one-sample z-test for a mean assumes the population standard deviation is known. That condition is unusual in product analytics, where variability is estimated from the current sample.
Z-tests remain common for proportions. In a two-arm conversion experiment, the estimate is:
Under the null of equal proportions and with adequate counts, the standardized difference is approximately normal. This yields a two-proportion z-test.
Use it when:
- the outcome is a binary count summarized as successes and failures
- assignment groups are independent
- sample sizes make the normal approximation credible
- the hypothesis and one- or two-sided direction were set before analysis
Do not rely on a universal “n greater than 30” rule. For rare events, 30 observations can produce almost no successes; for balanced common events, approximation quality can be good. Inspect expected successes and failures and use an exact or model-based method when counts are sparse.
In high-volume online experiments, a normal approximation is also used for many sample means through the central limit theorem. The important question is whether the estimator's sampling distribution and variance calculation are valid for the metric, not whether the raw user values look perfectly normal.
When to use a t-test
A t-test is designed for inference about means when the variance is estimated from sample data. That extra variance uncertainty produces a t distribution with heavier tails than the standard normal, especially at small sample sizes.
For two independent groups, default to Welch's t-test unless equal variance is justified. Welch's version does not assume the two population variances are equal and handles unequal group sizes. NIST's two-sample t-test reference shows the unequal-variance standard error based on each group's sample variance and size.
Use an independent two-sample t-test when:
- the outcome is numeric and the mean is the target
- the two groups contain different experimental units
- observations are independent within the model
- the mean and standard error behave well enough for the sample size
Use a paired t-test when each value has a meaningful partner: the same user's before-and-after score, or deliberately matched units. The analysis reduces each pair to a difference and tests the mean of those differences. Treating paired data as independent discards information and computes the wrong standard error.
The t-test can be sensitive to extreme values because the sample mean and variance are sensitive to them. Product metrics such as revenue or session duration are often skewed. At scale, the mean may still have a usable sampling distribution, but inspect outliers, data quality, and the estimand. Robust inference, transformations, winsorization policies, or bootstrap methods may be more appropriate when a few observations dominate the result.
Reduce variance before launch
Learn how CUPED and covariate adjustment can sharpen experiment estimates without changing the randomized comparison.
Explore Variance Reduction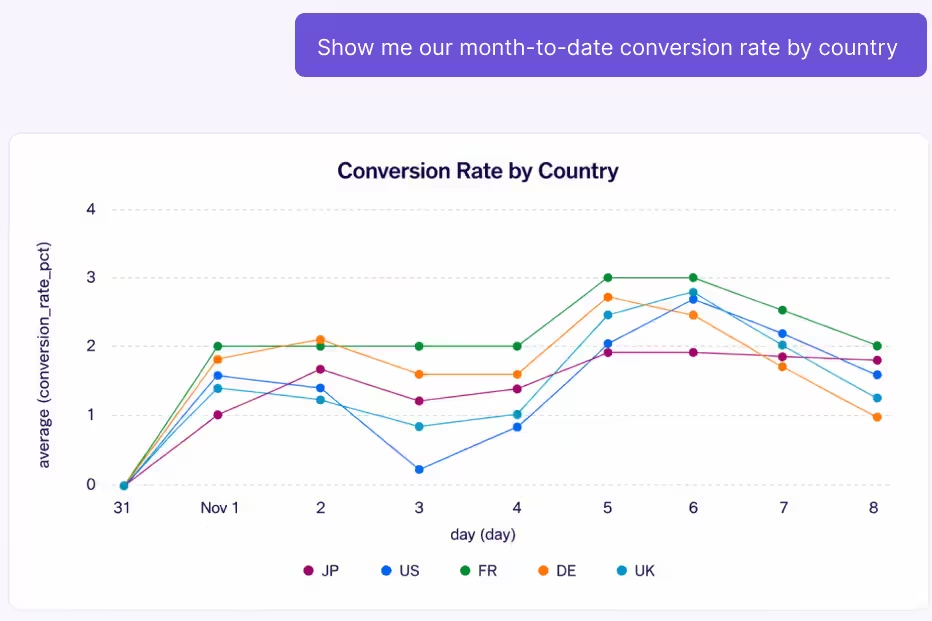
When to use a chi-square test
Pearson's chi-square statistic compares observed category counts with counts expected under a null hypothesis. Two common forms are:
- goodness of fit: does one categorical distribution match specified probabilities?
- independence or homogeneity: is a categorical outcome distributed the same way across groups?
Suppose an onboarding experiment records three outcomes: completed, skipped, and abandoned. Cross-tabulate outcome by variant. A chi-square test asks whether the outcome distribution is independent of variant.
The test statistic sums (observed - expected)^2 / expected across cells. NIST's chi-square documentation describes the same comparison of binned frequency distributions.
Use a chi-square test when observations contribute counts to mutually exclusive categories and expected cell counts are large enough for the asymptotic approximation. With sparse cells, combine categories only when substantively justified or use an exact method such as Fisher's exact test for a two-by-two table.
A chi-square result says the distributions differ somewhere. It does not provide the most decision-friendly effect estimate by itself. Report category proportions, absolute differences, uncertainty intervals, and the cells contributing to the pattern.
For a binary two-arm experiment, the Pearson chi-square test and a two-sided two-proportion z-test are closely related: under standard conditions, the chi-square statistic with one degree of freedom equals the squared z statistic. Choose the representation that matches the hypothesis and reporting needs.
When to use ANOVA
ANOVA compares variation between group means with unexplained variation within groups. A one-way ANOVA tests the null that all population means are equal across levels of one factor.
Use it for a continuous outcome across three or more independent groups when the global question is whether any mean differs. Classical ANOVA assumes independent errors, normally distributed residuals within the model, and equal variances. Welch ANOVA relaxes the equal-variance assumption; R's 0 implements that approximation.
ANOVA's F-test is an omnibus test. A significant result means at least one mean differs, but it does not identify which one. Use planned contrasts or multiplicity-aware post-hoc comparisons to answer the product question.
ANOVA is more than a rule for “three or more groups.” Multi-factor ANOVA can estimate main effects and interactions in multivariate or factorial experiments. Repeated-measures or clustered data need corresponding error structures rather than a basic one-way calculation.
Why several t-tests are not a substitute for ANOVA
With four variants there are six pairwise comparisons. Testing each at 0.05 creates multiple opportunities for a false positive. An omnibus ANOVA tests one global null first, and planned follow-ups can use Tukey, Holm, Bonferroni, or another procedure appropriate to the family of claims.
The Bonferroni correction is simple and conservative. The right procedure depends on whether the goal is all pairwise comparisons, treatments versus one control, or a small set of preplanned contrasts. Define that family before looking at the ranking.
ANOVA and regression are also two views of the same linear-model machinery. R's 0 documentation describes aov as a wrapper around linear models for experimental designs. Regression is often more flexible when the analysis includes covariates, interactions, or unbalanced data.
Assumptions that change the choice
Before running any of the four tests, verify:
Independence and assignment unit
If the experiment randomizes accounts but analyzes users as independent observations, standard errors will usually be too small. Analyze at the randomization unit or use cluster-aware inference. If users can appear in both groups, repair the assignment or use a model that represents the dependence.
Paired or repeated observations
The same user measured twice is not two independent users. Use a paired test or repeated-measures model. For experiments with many events per user, aggregate to the user level or use appropriate clustered methods.
Outcome distribution and metric construction
Check missingness, zero inflation, extreme tails, ratio denominators, and censoring. A test can be mathematically correct for the supplied numbers while the metric itself misrepresents the user outcome.
Variance assumptions
Prefer Welch's t-test or Welch ANOVA when group variances may differ. Equal sample sizes do not prove equal variance, and a preliminary variance test can introduce another decision layer.
Sample size and sparse cells
Approximate z and chi-square methods need enough information in the relevant cells. Low-frequency guardrails and small segments may need exact methods or longer collection.
A product experimentation decision tree
Use this sequence before opening a statistics package:
- What unit was randomized: user, account, device, session, or region?
- What is the primary estimand: mean, proportion, category distribution, or model coefficient?
- Are groups independent, paired, repeated, or clustered?
- Are there two groups, several groups, or multiple factors?
- Do expected counts and sample sizes support the approximation?
- Are variances, tails, or outliers likely to break the default model?
- How many confirmatory hypotheses can trigger the decision?
- Was the test direction and stopping rule declared before launch?
Then choose the simplest model that answers the exact question. A two-proportion z-test may be perfect for signup conversion, while a t-test handles mean revenue and a chi-square test handles plan mix in the same experiment. Different metrics can require different tests.
Report effects, not only test names
The test produces a statistic and p-value under a null model. The guide to interpreting a t-test p-value shows why that number needs the effect, interval, and degrees of freedom beside it. The product decision needs more:
- the effect estimate in business units
- a confidence or credible interval
- sample sizes and allocation
- baseline and treatment values
- assumption and data-quality checks
- the planned hypothesis family
- practical thresholds and guardrails
GrowthBook's statistics documentation explains the frequentist and Bayesian engines available for experiment analysis. Whichever framework is used, review effect magnitude and uncertainty together. A small p-value can accompany a trivial lift in a huge sample, while a valuable estimated lift can remain uncertain in a small one.
Choose the test by tracing the data back to the experiment design. For three or more continuous-outcome variants, the deeper ANOVA guide covers the omnibus F-test, planned contrasts, and Welch alternative. When the outcome, assignment unit, dependence, and hypothesis are explicit, the difference between z, t, chi-square, and ANOVA becomes a modeling decision rather than a memorization exercise.
Analyze tests with context
Connect experiment assignments to trusted metrics, inspect uncertainty, and keep decision rules visible to the whole team.
Get Started With GrowthBookAn experiment with control plus three variants creates more than one comparison. ANOVA gives the team one principled global test of whether the variants differ before it starts hunting for a winner.
Analysis of variance, or ANOVA, is a family of statistical models for comparing group means and decomposing sources of variation. In a one-way product experiment, the “factor” is the assigned variant and its “levels” are control, B, C, and D.
The basic ANOVA question is deliberately broad: if all variants had the same population mean, would the observed separation among their sample means be surprising relative to the noise within variants?
That question is useful, but incomplete. A significant ANOVA result does not say which variant won, whether the lift is large enough to ship, or whether assumptions and instrumentation are sound. Those conclusions require planned contrasts, uncertainty intervals, and experiment-quality checks.
How ANOVA compares means through variance
ANOVA separates total variability into components:
- between-group variation: how far each group mean is from the overall mean
- within-group variation: how far individual observations are from their group mean
Each sum of squares is divided by its degrees of freedom to produce a mean square. The F statistic is:
Under the null hypothesis that all group means are equal, both quantities estimate the same underlying error variance, so their ratio should often be near 1. When group means are separated relative to the residual noise, F grows.
NIST's one-way ANOVA explanation describes this as comparing the level mean square with the residual mean square. The p-value is the probability, under the null model and assumptions, of an F statistic at least as large as the observed one.
For k groups and N total observations, one-way ANOVA usually has:
The numerator asks how much the k means vary. The denominator pools information about variability inside the groups.
A four-variant experiment example
Suppose a SaaS team tests four onboarding flows and measures projects created per eligible account during the first week.
| Variant | Accounts | Mean projects | Standard deviation |
|---|---|---|---|
| Control | 1,000 | 2.30 | 1.80 |
| B | 1,020 | 2.42 | 1.84 |
| C | 990 | 2.61 | 1.91 |
| D | 1,010 | 2.36 | 1.79 |
The null hypothesis is:
The alternative is that not all four means are equal. Notice what it does not say: “C is best.” The global alternative includes any pattern where at least one mean differs.
If the F-test rejects the null, the team should evaluate the comparisons it planned. It might compare every treatment with control, or test one contrast between the current flow and the average of three new concepts. The comparison plan should reflect the decision, not the visual ranking in the finished dashboard.
Make multiple tests trustworthy
See how experimentation leaders plan hypotheses, guardrails, and review practices when a result surface contains many possible claims.
Watch the Trustworthy Experiments Talk
Why not run every pairwise t-test?
Four groups create six pairs. If the team runs six independent tests at alpha 0.05 and treats any significant result as proof, the probability of at least one false positive across the family can exceed 0.05.
ANOVA gives one global test of the equality of all means. It also estimates residual variation using all groups, which can be more efficient than estimating it afresh for each pair under the classical equal-variance model.
The global test does not eliminate multiplicity in follow-up comparisons. R's Tukey HSD documentation explicitly notes that ordinary t-tests inflate the probability of a false declaration across a family. Choose the follow-up procedure for the comparisons the decision actually needs:
- every pair: Tukey-style simultaneous comparisons
- every treatment versus control: Dunnett-style comparisons
- a few planned product questions: predeclared contrasts with a suitable adjustment
- a conservative small family: a Bonferroni or Holm correction
An omnibus test can also be nonsignificant while one carefully planned contrast is persuasive, because the hypotheses and power differ. Decide before launch whether the global null or a treatment-versus-control contrast is the primary decision test.
Unequal group sizes do not automatically invalidate ANOVA, but they make the variance assumption and contrast plan more consequential. If allocation is intentionally uneven, power the smallest comparison that drives the decision and preserve the assignment probabilities. When variances and sample sizes both differ, classical pooled ANOVA can behave poorly; Welch ANOVA or a regression with suitable standard errors is usually easier to defend.
Planned contrasts can also use product structure that the global test ignores. Instead of comparing every pair, a team might compare control with the average of three related treatments, or compare two low-intensity treatments with two high-intensity treatments. A small set of predeclared contrasts often answers the business question with more power and clearer multiplicity control than an exhaustive winner search.
ANOVA assumptions in experiments
The familiar one-way fixed-effects model can be written as:
Classical inference depends on the residuals and design, not on a requirement that the combined raw outcome form one bell curve. NIST's model reference assumes independent, normally distributed errors with mean zero and common variance.
Independent observations
The analysis unit must respect randomization. If accounts are assigned but every user within an account is treated as independent, the standard error ignores clustering. Aggregate at the account level or use cluster-robust or hierarchical methods.
Repeated events from one user create the same problem. Ten sessions from one user do not carry the same independent information as ten users.
Appropriate residual behavior
ANOVA is often robust to moderate non-normality with balanced, sufficiently large groups, but severe skew, outliers, censoring, or zero inflation can make the mean unstable or the F approximation unreliable. Diagnose residuals and assess whether the mean is still the business estimand.
Equal variance for classical one-way ANOVA
Classical ANOVA assumes a common population variance. This can fail when a treatment changes both the mean and spread, or when groups serve different traffic mixes. Unequal group sizes make the problem more consequential.
SciPy's 0 supports Welch ANOVA when equal_var=False. Welch's method relaxes equal population variances and adjusts the degrees of freedom.
Correct outcome model
ANOVA targets a continuous mean. Conversion is binary; event counts are discrete; time-to-churn can be censored. Large-sample mean inference can sometimes work, but logistic, Poisson or negative-binomial, survival, or other generalized models may better represent the outcome and produce interpretable effects.
One-way, two-way, and repeated-measures ANOVA
“ANOVA” names a family rather than one calculation.
One-way ANOVA
One categorical factor with multiple levels, such as four assigned onboarding variants. This is the usual A/B/n example.
Two-way or factorial ANOVA
Two controlled factors, such as headline and layout. The model estimates each main effect plus their interaction. The interaction asks whether one factor's effect changes with the other. This is central to a properly designed multivariate test.
Repeated-measures ANOVA
The same units are observed under multiple conditions or times. Dependence is part of the design and must be modeled. A basic independent one-way ANOVA is invalid for repeated measurements.
ANCOVA
Analysis of covariance adds continuous covariates to the group comparison. In randomized experiments, pre-experiment covariates can improve precision when they are chosen and measured without post-treatment contamination. GrowthBook's guide to variance reduction explains the same motivation in online experimentation.
Run one-way ANOVA in Python
At the action boundary, keep one numeric observation per independent analysis unit in each group. In SciPy:
Before running it, confirm that rows match the randomization unit and missing values have a documented policy. Afterward, inspect group summaries and residual behavior. The p-value alone cannot reveal a broken exposure join or a few enormous outliers.
In R, aov(outcome ~ variant, data = experiment) fits the classical model. R documents 1 as a linear-model interface, which helps explain why ANOVA, regression, and contrasts are closely connected.
Interpret the ANOVA table
A standard output contains:
- degrees of freedom
- sum of squares
- mean square
- F statistic
- p-value
Suppose the output reports F(3, 4016) = 6.8, p < 0.001. Under the model, the observed ratio of between-variant to within-variant variation is unlikely if all four population means are equal. It does not mean every treatment beats control or that any effect is commercially important.
Add the quantities the product decision needs:
- each mean and sample size
- differences from control in original units
- simultaneous or comparison-specific intervals
- an effect-size measure when useful
- guardrail and data-quality results
- the follow-up comparison method
Avoid ranking noisy means without uncertainty. The highest observed variant has benefited from both its true effect and sampling variation, especially when many variants were screened.
Common ANOVA mistakes
Treating events as independent users
Repeated events make the nominal sample size huge and uncertainty too narrow. Preserve the assignment unit.
Using ANOVA for every metric shape
The word “variant” does not imply ANOVA. Match the outcome distribution and estimand to a model.
Checking assumptions after selecting a winner
Write the model, outlier policy, transformation, and variance choice before the ranking is visible. Result-driven switching creates hidden researcher degrees of freedom.
Treating a significant F-test as a winner declaration
Follow with the planned contrasts. The omnibus test only rejects equality of all means.
Ignoring practical significance
A very large experiment can detect a tiny difference. Compare intervals with a minimum practical effect and account for implementation cost and guardrails.
Use ANOVA as part of an experiment plan
Before launch, specify the factor and levels, independent unit, primary continuous outcome, minimum effect, sample-size plan, variance assumption, global or contrast hypothesis, comparison family, and stopping rule.
Then verify assignment and exposure before interpreting the model. A sample ratio mismatch can signal that observed group counts no longer reflect the planned randomization. No F-test can repair biased exposure data.
ANOVA is valuable because it turns a field of variant means into a structured model of signal and noise. The broader z-test, t-test, chi-square, and ANOVA guide shows when the outcome and hypothesis call for another member of that family. Use the omnibus test for the global question, planned contrasts for the decision, and effect estimates for practical judgment. That sequence makes a multiple-variant test easier to defend than a dashboard full of uncoordinated p-values.
Compare variants with discipline
Run controlled experiments, connect trusted metrics, and review treatment effects and uncertainty in one shared workflow.
Start With GrowthBookReady to ship faster?
No credit card required. Start with feature flags, experimentation, and product analytics—free.

