

What does a holdout test actually measure?

Teams use holdouts differently but call them by the same name. This post is about what each one actually estimates, what it's for, and when the configuration matters.
TL;DR: A holdout measures what everything you shipped over a period was worth. Holdout estimates are usually less than the sum of your individual A/B test wins, mostly because the wins are inflated by the winner's curse. This piece explains four different configurations that all get you slightly different versions of the "effect of everything over the last period". The right pick depends on how much your features interact, how much novelty effects worry you, and which version you find most relevant.
What is holdout testing?
Most experiments answer a single-feature question: what is the value of shipping this change, versus staying with the current product? A holdout experiment asks the bigger question about the effect of every feature you shipped recently. You hold a group of users back from everything your team shipped (or tested) over a given period and compare them against users who got all of it. The result tells you whether the cumulative impact of those releases actually moved the needle for the business.
You hear people talk about holdouts, and it sounds like a good idea. But why exactly would you do it, and what do you do if it comes back flat? Roll back a quarter of the features? Probably not. So why bother?
Part of the trouble is the word. "Holdout" covers a few different things, and people reach for it to mean whichever one they have in mind. Two are worth separating before we go further.
One is about a single feature. You shipped something, it won, and you keep a small group on the old version for a few months to see whether the short-term win holds up in the long run. That's a question about the long-term effect of one change, and we'll cover that separately someday, but that's not this piece.
The focus of this post is testing everything at once. You hold a group of users back from the whole set of shipped work and compare them against everyone who got the changes. That's the kind of holdout this piece is about: the one you run to answer "how much did all of this really help the business?"
The idea is simple. What's confusing is that many companies are doing this slightly differently, and each tends to present its way as the obvious one. Same word, different machinery, different answers. To see what's really going on, and whether the differences matter, you have to be precise about what each one estimates. Let's start with that.
What a holdout actually measures
A combined holdout is just an experiment. The only unusual thing is the treatment you assigned. Normally, the treatment is one feature, and you hold everything else still. Here, the treatment is the whole batch of changes you shipped this quarter, and the control group stays on the product as it was before any of them.
That can sound like a clumsy way to get a number you could back out for free. You ran a bunch of experiments, kept the winners, and you can add up their effects. Why hold a group out from everything to learn what summing the wins would tell you?
Because summing fools you. The wins you kept are inflated: you only ship the experiments with significant effects, and those oversample the ones whose noise happened to push them up (the winner's curse). A companion piece, Why summing your experiment wins overstates impact, works through how much and the mechanics more clearly. Interactions are the softer second worry: two changes that each win in isolation can partly cancel when both ship, so the sum overcounts them. But that only happens when they were genuinely tested apart. If they ran concurrently, or you shipped one before testing the next, the sum already captures the interaction, the same way the holdout does. Whether it alters the sum at all depends entirely on how your experiments overlapped, and under a clean rollout, it often doesn't. We’ll cover this in a separate piece too. Either way, a holdout sidesteps both: it turns everything on and reads the joint effect as a whole. Here we take that as given and ask: what, precisely, does the holdout measure?
What holdout testing is actually for (and what it isn't)
If a holdout comes back flat, you're not going to roll back the quarter, so what was the point?
The point is rarely a ship-or-rollback decision. A holdout is an accounting instrument and an alarm. It tells you whether the wins are real once they're added up, and what to expect going forward (with some faith). The holdout result answers, "Did all the work we did really move the needle?" Hold out per team instead, and the question changes to "which teams are driving more impact," which is a funding-and-headcount call as much as a measurement one. Etsy, a marketplace, runs a quarter-long holdout for exactly this kind of company-level read: the collective impact of everything its teams shipped, which is rarely the sum of the individual wins.
That alarm is worth taking seriously. A holdout is the safety net against naive claims: it measures the whole configuration at once, so the net of every interaction, detectable or not, is already in the number. It won't tell you which culprit is at work, the inflated wins or the features stepping on each other, but it tells you there's something to find, and roughly how much of your reported progress went missing on the way. Airbnb reported a case where a run of individual wins summed to a 7.2% effect, but the holdout put the real number near 4%, almost half the sum gone.
Four holdout testing configurations: what each one estimates
Now, the part that confuses everybody: implementation. The configurations really do differ, and we will now unpack exactly how. Whichever one you run, you get an answer to the same bottom-line question of what the quarter was worth. But each answers a slightly different version of it, and two choices set them apart. First, what you compare the held-out group against. It is either a sample of the full population that lived through the rollout, losers and all, or a clean winners-only arm carved out of the holdout itself, a split. Second, when you read the result. Either incrementally, as the winners accrue, or in a terminal window at the end with everything on. Those two choices make four configurations, one per cell of the grid below. A fifth, the Reverse holdout, sits off the grid. It is the after-the-fact option for when you never set one up.
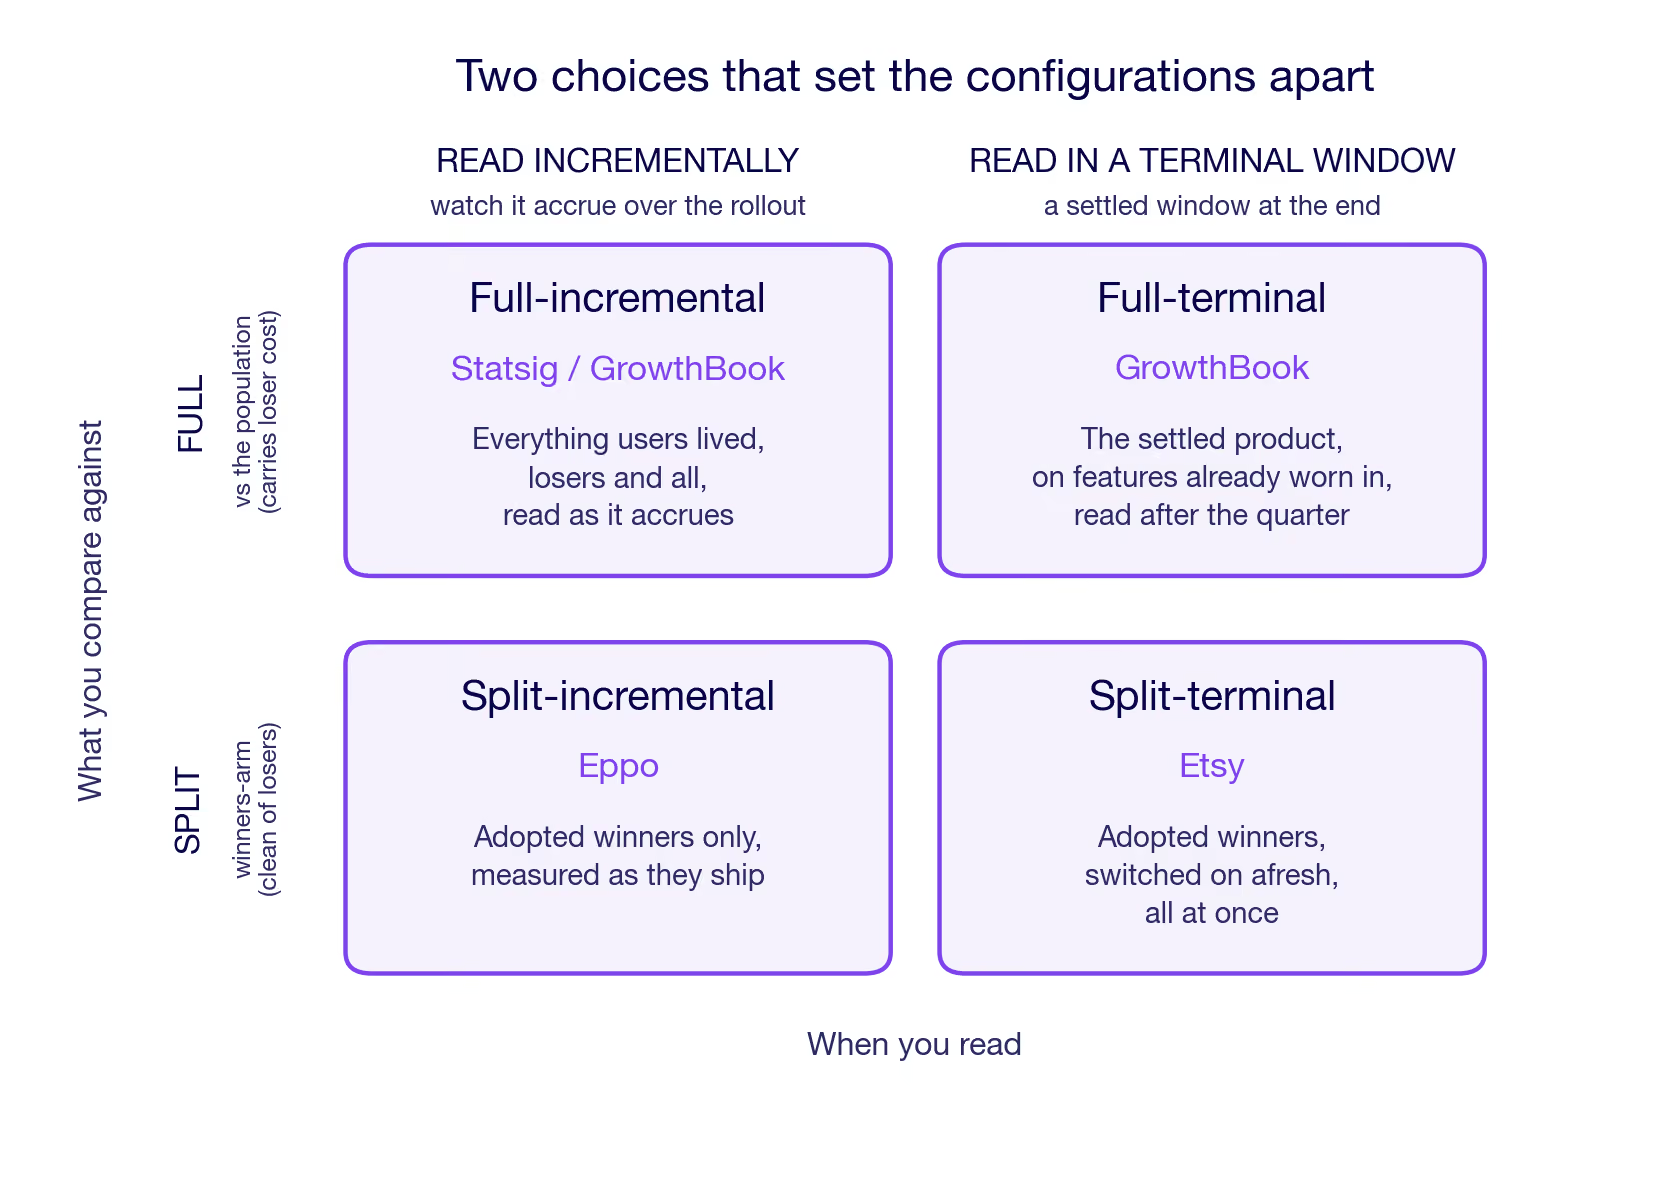
Two things separate the configs below. Which features are on when you measure: today's adopted winners, or also the losers users lived through on the way. And how fresh those features are when you read: just-shipped, worn-in, or averaged across the whole rollout. Each configuration is described in plain terms here. The corresponding potential-outcomes estimand for each lives in The estimands, formally at the end.
Full-terminal (GrowthBook)
GrowthBook reads a single held-out group two ways from the same setup, switched by a toggle on the analysis window: the terminal read here, the incremental one in the next configuration. One holdout group, both reads. Hold a group on the old product and compare it against a sample of everyone else, deliberately the same size as the holdout, so the comparison stays balanced. The held-out group gets no new features after the holdout starts. The comparison group lives through the full product experience over the time period, features arriving as they ship, and the losers are the losers switched on for a while before getting dropped.
What makes this read terminal is the analysis period: after the active period, the set of features freezes, and the number is read over a few weeks. By then, it is the adopted winners all on and the losers all off. So the transient cost of weeding out the losers is not part of the measurement, only the cost that really persists. What's left to measure is the impact of the winning features, net of most novelty effects and the persistent cost of finding the winners. One thing to keep in mind: the comparison group lived through the losers earlier in the period, so any permanent damage the losers did still pulls the number down. The transient cost of running the losers is taken out, but the lasting cost is not.
Full-incremental (Statsig/GrowthBook)
Statsig keeps the same structure. A single held-out group against an equal-size sample of everyone else. However, it is measured continuously from the start. It thus captures the winners as they accrue and the losers as they get tested. No terminal measurement window. So the number is the net effect on your users as they actually lived through the full product experience. The winners and the running cost of weeding out the losers, each interaction weighted by how long the features overlapped. This is the full account of what happened.
Read this way, the held-out gap is not one number but a moving one: small early, when only a few winners are on, and growing as they accumulate. You add the gap up as it builds, rather than reading a single end-of-quarter snapshot.
For GrowthBook, this is the same held-out group as the terminal read, now read continuously, the other setting of that toggle.
Split-incremental (Eppo)
Take a holdout of any size, say 10%, and split it in half: half see no new features for the whole period, the other half get each winning feature the moment it's adopted. Both are shielded from the live experiments. Because the winners were picked from the population outside the holdout, the split re-measures them on a fresh sample. That is a replication on a fresh sample: winners that got through on noise tend not to survive it, and the number can come in lower than the individual tests promised.
Both arms come from the holdout and sit out every live experiment, so the contrast runs between two halves: a winner's arm that picks up each winner the moment it is adopted, against a status-quo arm still on the old product. Read incrementally, like the full version, but over winners only. Two things set it apart from the full version. The losers never reach either arm, so no loser cost enters. And because the winners were selected from the population outside the holdout, this re-reads them on units that took no part in picking them, the cleanest form of replication that every holdout does.
Split-terminal (Etsy)
Splits the holdout in half, too, but delivers everything at once. Hold a group out from everything for a quarter. At quarter's end, turn on all the adopted winners together for half the holdout for several weeks. Compare that half against the other half still on the old product. Because every feature goes live at the same moment, they all have the same age when measured. No ambiguity about which feature has been live the longest and which was turned on only at the end. Like split-incremental, this is a split, so the winners reach held-out users who had no hand in picking them, the same clean replication on out-of-sample users.
In the other configurations, features arrive across the holdout period. So at the measurement, each carries a different age. Turning everything on at once for half the holdout group gives every feature the same starting line instead. All of them fresh.
Every winner shares the same age, and that age is young. It aims at the same winners-all-on contrast as GrowthBook's full-terminal read, but with the features fresh instead of worn in: every feature at the same young age, measured the first time users meet it.
Reverse holdout
The one you probably didn't plan. Every design above has to exist before launch, because you can't hold a group out from something you already shipped. If you didn't set one up, you can still take a random group and revert them, turning the quarter's changes off again. That measures something genuinely different: not the effect of never having the features, but the effect of losing them. Take away something people have settled into, and you measure their annoyance along with the feature's value. Useful when it's the only option, but "had it and lost it" is its own estimand.
The same comparison shows the asymmetry. The kept group is on the worn-in winners. The reverted group is back on the old product, but reached by removal: its baseline carries the history of having had the features and lost them, not the clean never-had-it baseline the other four compare against. Losing something you have settled into provokes a reaction of its own that a never-had-it baseline never contains. Strip out features that were doing real work, and the reverted group drops below the kept one, so the number comes out positive; the bigger it is, the more the quarter is worth.
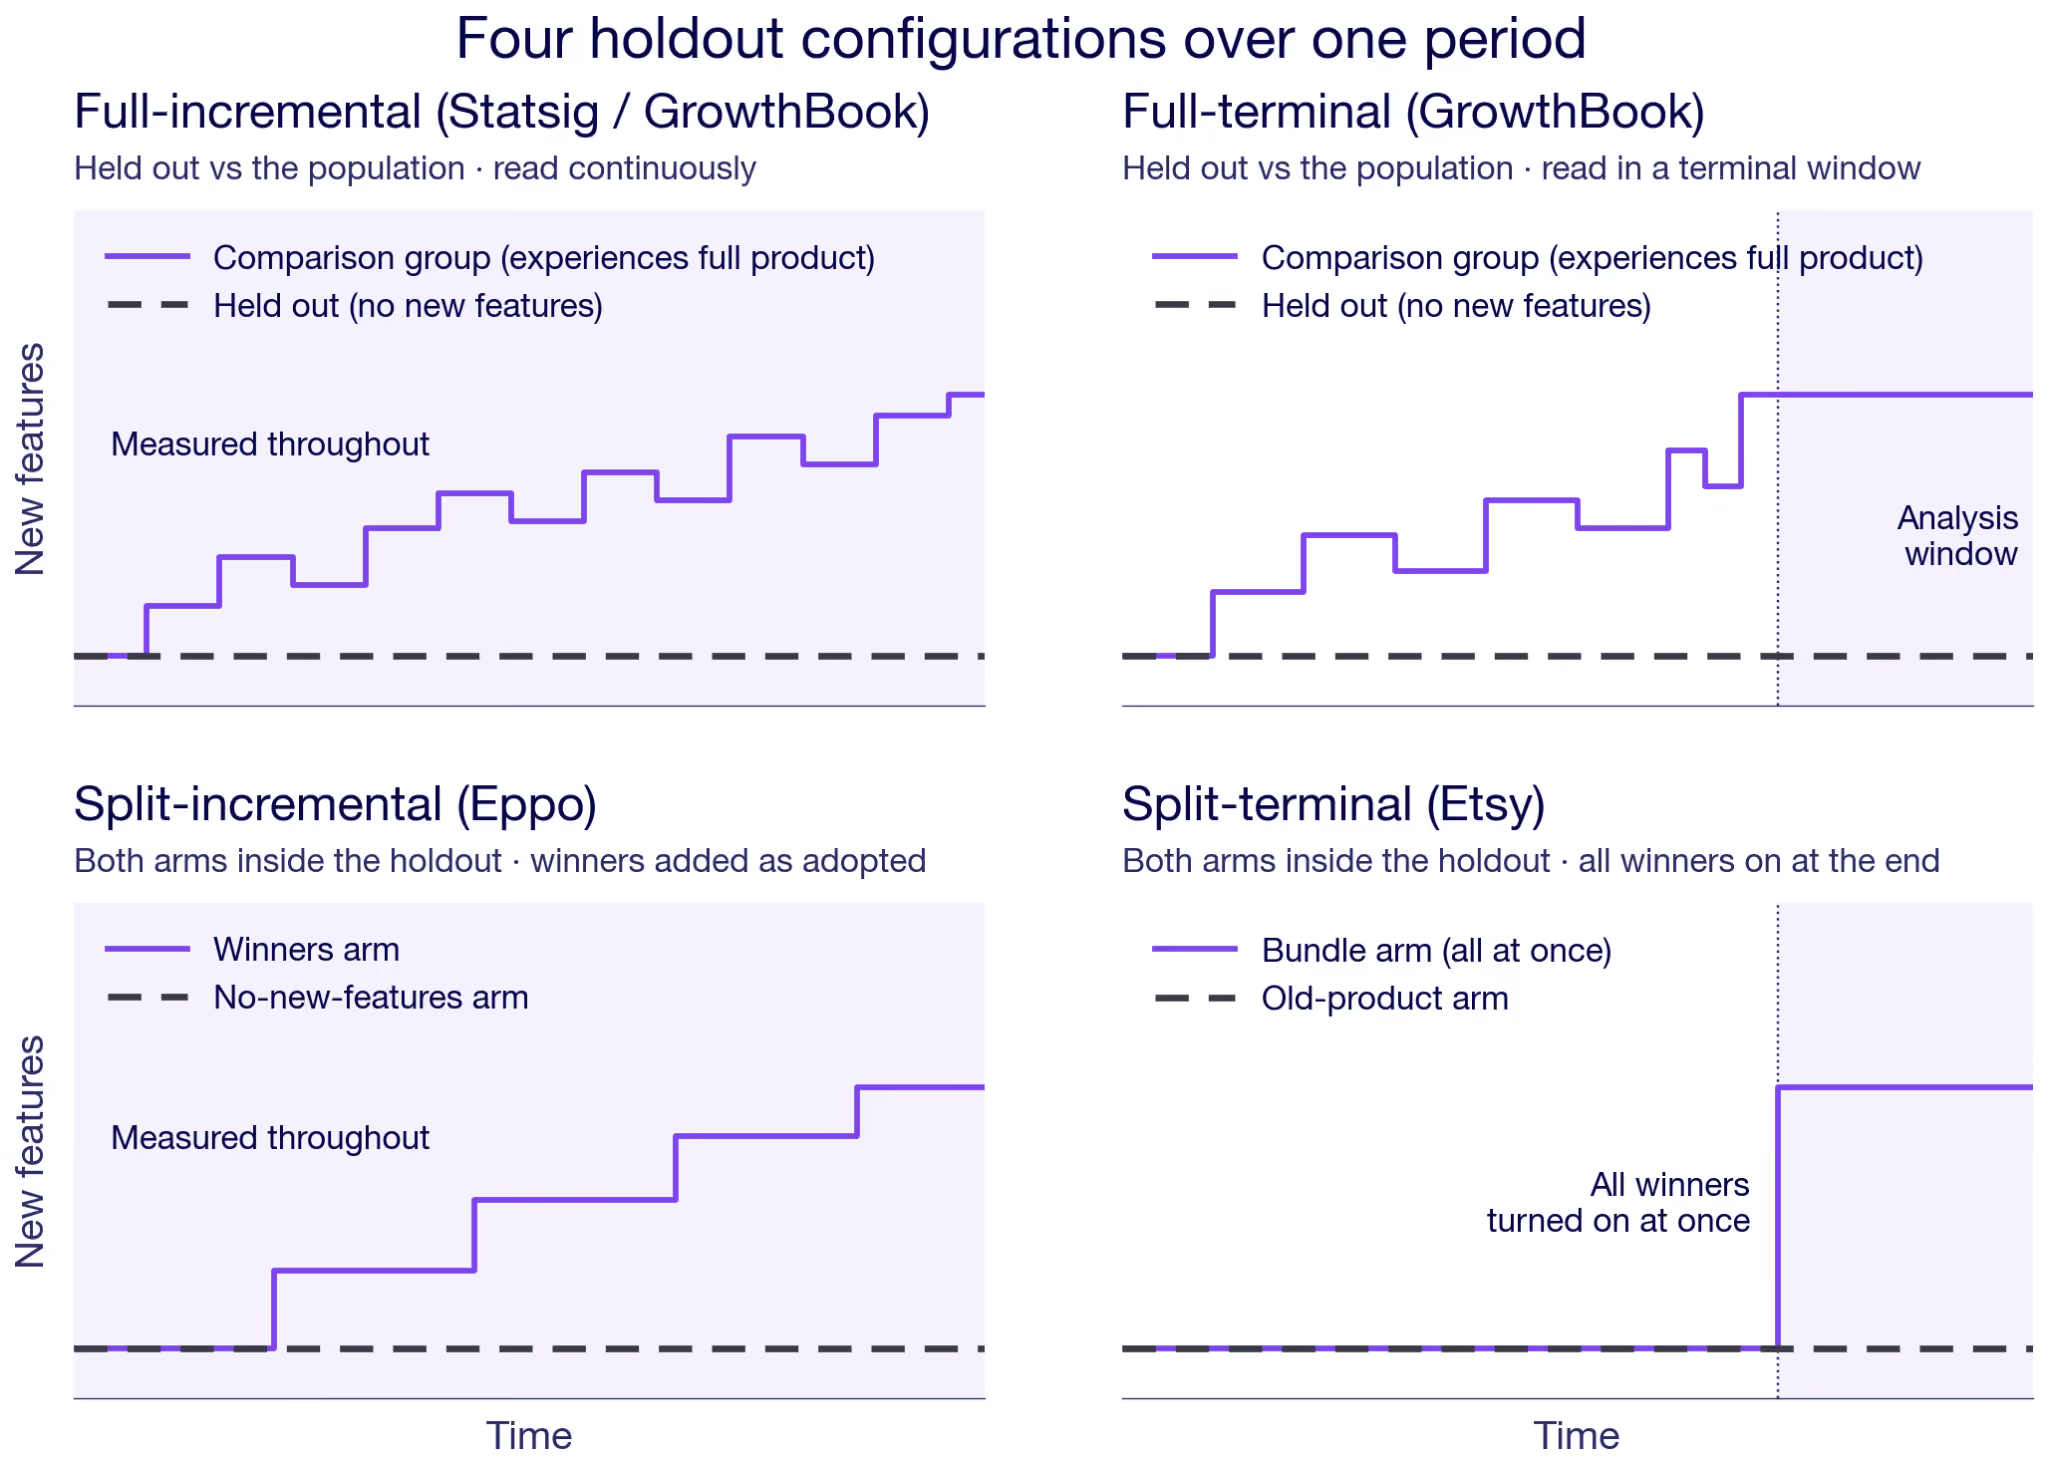
One practical thing cuts across all four, but not the Reverse holdout. Something has to keep the held-out users out of every experiment. On a platform that's handled for you: a feature-flag prerequisite in GrowthBook, the holdout config in Eppo or Statsig. The coordination cost mainly shows up if you build it yourself, which is why Etsy's writeup is half about the infrastructure it takes to keep a holdout clean across every team for a whole quarter.
Does your holdout testing configuration actually matter?
Start with what you actually want to measure. Read continuously against the full population, like Full-incremental, and you get the quarter as your users lived it, losers and all. The other four lean toward what to expect going forward: they focus on the winners, and the terminal reads let novelty settle before they measure.
How much the choice between configs then bites sharpens along the grid's two axes. The read axis, terminal versus incremental, decides how interactions and novelty land. The comparison axis, full versus split, trades the winner's curse against power.
On the read axis, start with interactions. If your teams ship to separate corners that don't touch, features barely interact, and the choice hardly matters. When many fight over the same surface, it does. The two terminal reads have every winner on when they are measured. So each interaction enters at full weight. Clean interaction accounting. The two incremental reads absorb interactions as they build over the rollout, each pair weighted by how long the two features happened to coexist. That is a more faithful picture of what users lived through. It is also a less clean account of the period's all-on state. The larger the interactions, the more the two reads diverge, so the choice matters. If you want the joint effect of everything turned on together, a terminal read measures it at full weight. If you want what users actually lived through the rollout, the incremental read is more appropriate.
Novelty is the other read-axis driver, and it sets the two terminal reads apart. They look like the same measurement taken at different times, and novelty is the difference you notice first. Split-terminal turns everything on fresh, so its window is novelty-heavy, while Full-terminal reads the winners worn in. With strong novelty effects, the two genuinely disagree, one catching the first reaction, the other closer to the mature state. A longer read settles the novelty but leaves the held-out group further behind. Age is not all that separates them, though: one is a full comparison and the other a split, so they part on the compare axis too.
On the compare axis, hold the read axis fixed and line up two terminal reads: GrowthBook's full-terminal against Etsy's split-terminal. Going from full to split changes two things at once, and they are worth separating.
The first is who you measure on. A full comparison measures the winners using a new sample of the same population from which they were selected. A split comparison measures them on held-out users who took no part in the selection. The winner's curse isn't creeping back in either case: both compare against a freshly randomized held-out baseline, so a false-positive winner regresses toward its true effect anyway. The split is the cleaner replication, but a full comparison is mostly fine on this count, too, since it still draws a fresh group to compare against, independent of the one that picked the winners.
The second is whether the losers are in the number. A full comparison's baseline lived through the losing experiments, too, so whatever lasting damage they did still sits in the comparison. A split's winners reach users who never met a loser. So a split also isolates the winners from the loser residue. Put the two together, and a split gives a cleaner, selection-independent read of the winners on their own. The more underpowered your experiments, the more lucky draws you ship, and the more that a cleaner read is worth.
That cleaner read costs something, though. A split keeps two arms out of your experiments, where a full comparison keeps only one, so it takes more traffic, and so more power, from the feature tests you're running. Whether a cleaner winner number is worth thinner experiments is a real trade-off, so it matters how much traffic you have to spare.
One caveat cuts across all of them. Every configuration assumes the held-out group shows you the world without your changes. In a marketplace, or any product with network effects, that breaks. The held-out users shop in the same market as the treated majority, who just moved. So the holdout's baseline is not really the old world. It is the old product in a moving market. This is not unique to holdouts. But a holdout makes it bite harder. The holdout group is deliberately tiny, so the market has shifted almost completely to the new equilibrium under the shipped features. And a batch of winners all pushing demand the same way moves that market more than any single test would. So read a holdout in a marketplace as a partial-equilibrium number, not the grand total.
The estimands, formally
For readers who want the potential-outcomes version, here is each configuration written as an estimand. Everything above stands without it, but here is a more technical description that can add some clarity.
Take every change you shipped as a switch, on or off. The product is a vector d, one entry per feature, and a customer's outcome under it, say revenue per user, is Y(d). The held-out group stays on the start-of-quarter product, every switch off: Y(0). Today's product is the winners you kept with the losers switched back off; call that configuration W.
A feature's effect the week it ships is not its effect once users settle in, so tag the treated outcome by age:
- Y(·; novel): just shipped, the first reaction
- Y(·; mature): worn in, the settled effect
- Y(·; global): the whole lived experience, novel and mature together, averaged across the rollout
The age tag, not a day-by-day index, is what separates the reads. A terminal read lands on a single settled state, mature if novelty has likely worn off, novel if everything goes live at once. An incremental read integrates the gap over the whole rollout, which is exactly the global outcome: young and mature in the proportions users actually lived them. One more tag, Y(0; loss), marks a baseline reached by taking features away rather than never having them.
The five estimands, side by side:
- Full-terminal (GrowthBook): E[ Y(W; mature) − Y(0) ]
- Full-incremental (Statsig/GrowthBook): E[ Y(d; global) − Y(0) ]
- Split-incremental (Eppo): E[ Y(W; global) − Y(0) ]
- Split-terminal (Etsy): E[ Y(W; novel) − Y(0) ]
- Reverse holdout: E[ Y(W; mature) − Y(0; loss) ]
A couple of things to read off the list. The treated state is W, the adopted winners with losers off, everywhere except full-incremental, which keeps the full lived configuration d because it never drops the losers from the measurement. The age tag carries the terminal-versus-incremental distinction: mature or novel for a settled window, global for the running read. And the reverse holdout is the only one whose baseline moves, from Y(0) to Y(0; loss).
Note that W = W(S) is a function of the selection time window data — the winners are whichever features cleared the bar during the rollout period. The formal estimands above condition on the realized W. Whether the estimator that produces them is independent of S is the argument in the compare-axis section of the body.
Know what you're measuring with holdouts
Simple idea, but messy in practice. The choice between configs comes down to three things. Whether you want the quarter as your users lived it or the settled value going forward — that's the read axis. Whether novelty effects are strong enough to matter, which separates the two terminal reads. And whether the power cost of a split is worth it for your traffic situation. Get those three straight, and the config mostly picks itself.
Know what you're holding out for.
For the GrowthBook implementation specifically, see the mechanics and the business case.
Related articles

.png)
Ready to ship faster?
No credit card required. Start with feature flags, experimentation, and product analytics — free.

