

How to run multiple experiments at once and keep results trustworthy
.png)
Running experiments one at a time is safe. Every test enrolls the whole user base and nothing overlaps. It’s also slow. Any test using the whole user base blocks everything behind it. Even with access to the entire user base, many experiments need to run for at least 2 weeks to balance out day-of-week and novelty effects. This means a program that only runs one test at a time can’t complete more than 26 experiments in a year.
But Microsoft, Amazon, Booking.com, Facebook, and Google were each running more than 10,000 experiments a year as far back as 2017. Even at their scale, this is only possible when tests overlap. Meta has since described running about 20,000 concurrent experiments.
This is possible because, in practice, two overlapping tests rarely distort each other’s results. To scale an experimentation program to thousands or even tens of thousands of tests, most companies need to default to simultaneous experimentation. This guide will explain when overlapping experiments conflict and how to keep your results trustworthy as you scale.
Can you run multiple experiments at the same time?
Yes, you can run many experiments on the same users at the same time, as long as each experiment randomizes its assignment independently. Independent randomization spreads the effect of every other experiment evenly across your variations, so overlapping tests don't distort each other's results. The largest experimentation programs depend on this independence. Microsoft runs hundreds of A/B tests daily with each user in several simultaneously, and DoorDash runs thousands of experiments in parallel every month.
Independent randomization comes from how experiments assign their units. GrowthBook assigns with a hash function, a fixed calculation that turns the user's identifier and the experiment’s seed into a number between 0 and 1. The outputs are spread evenly and unpredictably, so across many users they behave like random draws, and each user’s number determines their variation. The same inputs produce the same number every time, so a user who returns tomorrow gets the same variation they got today (often called sticky bucketing). Because every experiment uses its own seed, a user’s assigned variation in one experiment is independent of their variation in any other.
Because of that independence, the comparison between your treatment and control groups stays valid even while other experiments are running. Users in another experiment’s treatment split evenly between your control and treatment groups, so any effect on those users applies equally to both and cancels out. A holiday campaign or a service outage works the same way, affecting both groups equally.
Whether you run 5 or 500 independent experiments on the same population, you have, essentially, a full factorial design, where every combination of variations runs at the same time. Users spread across those combinations in predictable proportions, and each experiment measures its own effect averaged over all the others.
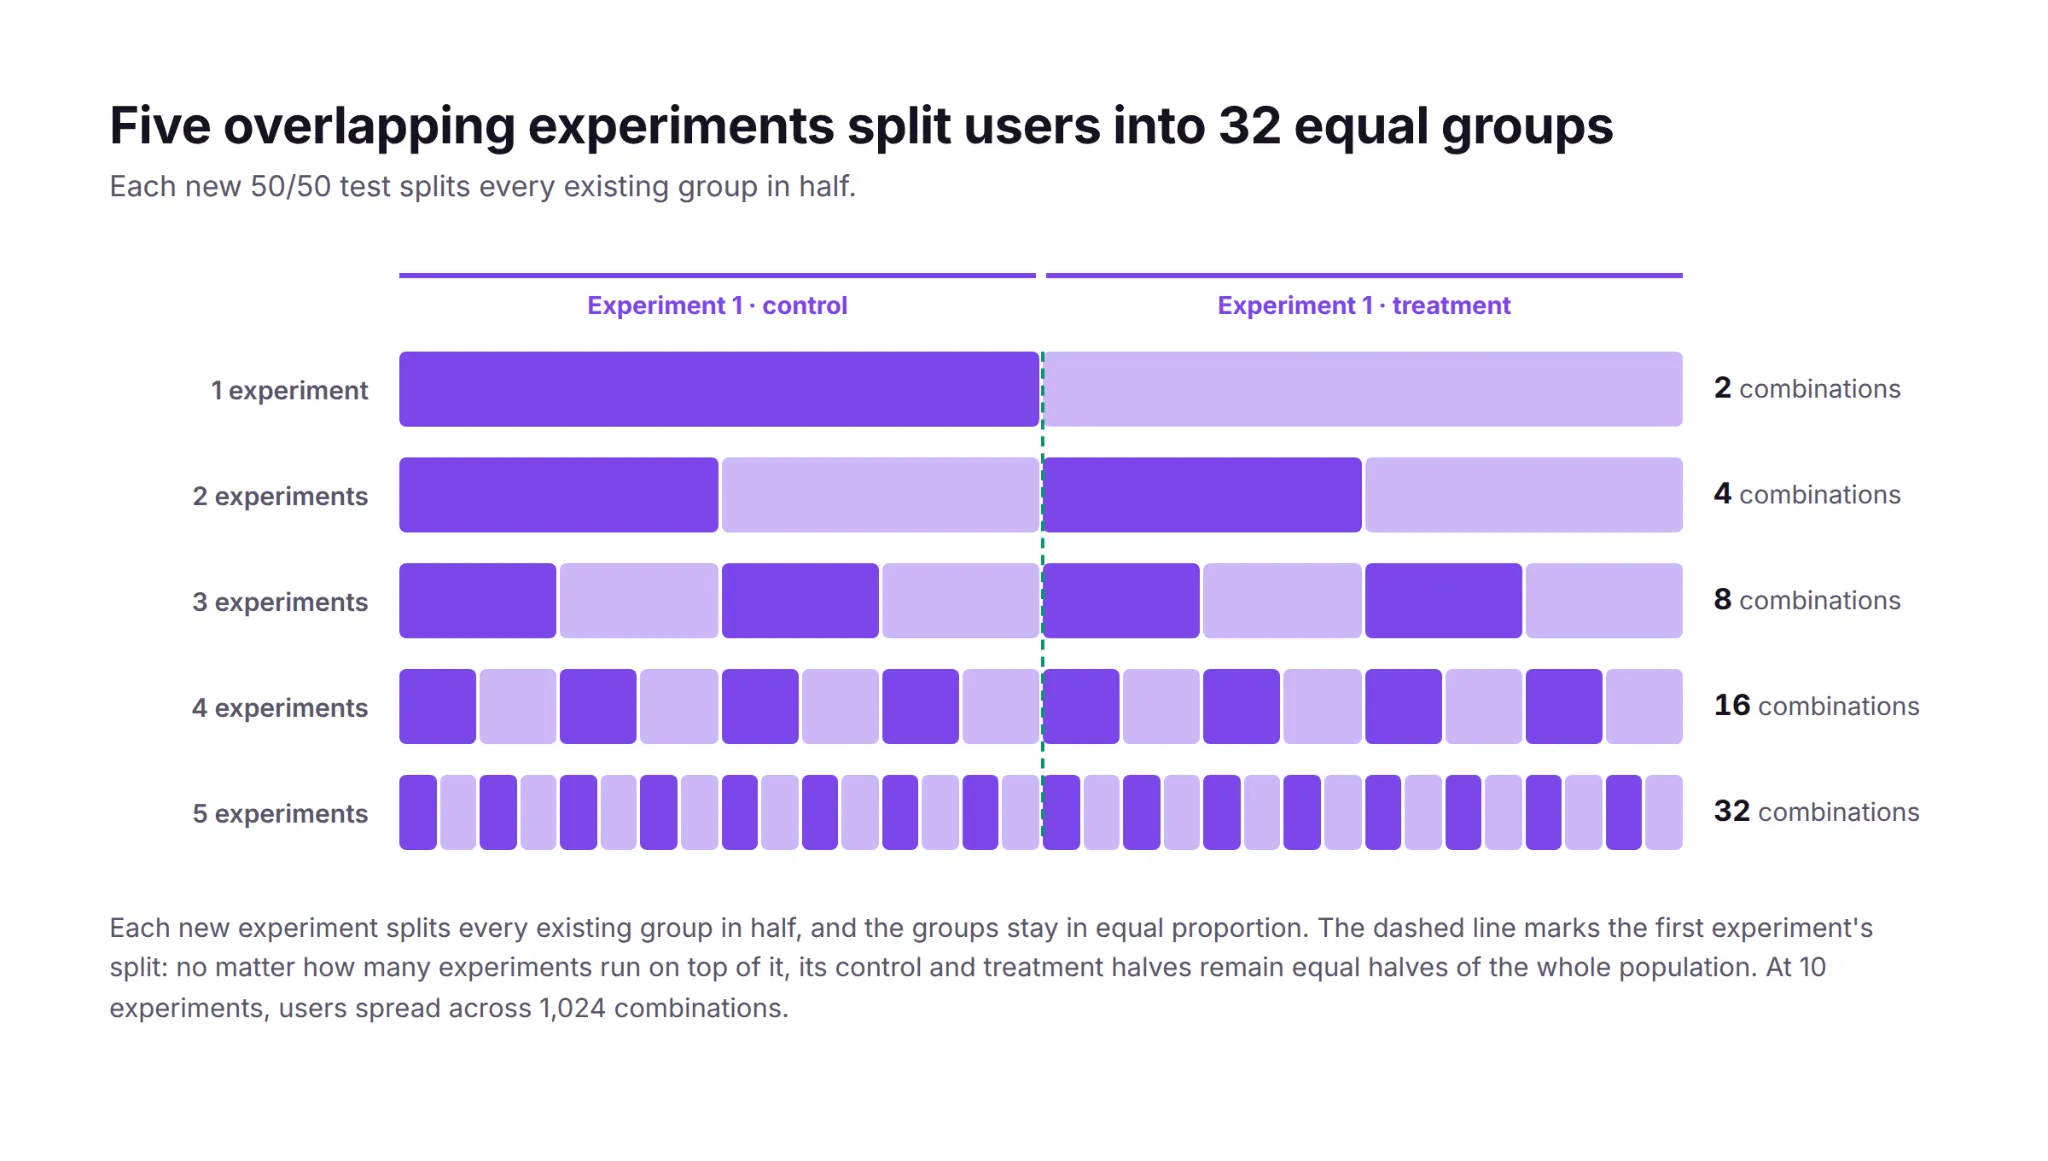
In the real world, users never experience one change at a time anyway. Releases, marketing campaigns, seasonal traffic patterns, and other experiments are always running, so a result measured while everything else changes reflects the conditions after rollout better than a result measured in artificial isolation.
When do concurrent experiments conflict?
If one experiment adds 1% to conversion on its own and another adds 1%, users in both treatments should see close to 2%. An interaction effect is any departure from that sum, in either direction. For example, two page-speed improvements can produce a combined gain smaller than the sum of their separate gains, because performance improvements have diminishing returns. Conversely, cart-reminder emails combined with a smoother checkout can add more than the sum because the emails bring users back to their carts, and the improved checkout converts more of the users who return.
Strong interaction effects are rare. Practitioners running the largest programs report that two interacting experiments rarely distort results enough to change a ship decision. Part of the reason is the base rate. At Microsoft, roughly a third of experiments improve their key metric, a third hurt it, and a third show no effect, and a treatment with no effect has nothing to interact with.
Although rare, two experiments can distort each other’s results when their changes collide in the product itself. In one documented case, two experiments each added an element to a retail page that pushed the buy button lower. Neither change moved the button below the fold on its own, but a user in both treatments got both elements at once. That combination pushed the buy button below the fold, and add-to-cart rates dropped.
The collision doesn’t have to be visual. If one experiment tests a 15% welcome discount and another lowers the free-shipping threshold, each offer may pay for itself on its own while users in both treatments can stack offers into unprofitable orders.
Experiments can also collide by trying to change the same parameter. If one experiment sets a search page’s default sort order to newest-first while another personalizes the ranking, a user in both treatments can only be exposed to one. Which sort change they actually see is determined by an implementation detail (such as the order the rules evaluate in), and the overridden experiment measures a treatment that part of its assigned group was never exposed to.
In practice, the most common collision is an unintentional bug. Both teams develop and test against the page's default experience, so the combination of their two treatments only exists once both tests are live, for the users assigned to both. Neither team tested that combination, and when the two changes are incompatible, part of the page stops working for those users. The second experiment then records a negative effect that reflects a bug rather than the change being tested.
Teams can predict most of these conflicts before launch. Two tests that modify the same element, the same page, or adjacent steps in the same funnel should be reviewed together. They usually belong to a single team that can see the collision coming, but if multiple teams work on related tests, shared rituals like a weekly experiment review can surface collisions. Tests on different surfaces with different metrics can overlap freely.
How to isolate the experiments that conflict
Teams that expect two tests to conflict can make them mutually exclusive, so users are only enrolled in one experiment. GrowthBook implements mutual exclusion with namespaces. Overlapping experiments stay independent because each one hashes users separately. A namespace removes that independence for a chosen group of experiments. The namespace hashes each user once to a number between 0 and 1, and each experiment in the group claims its own slice of that range. Each user’s number falls in at most one slice, so each user is enrolled in at most one of the experiments.
Google's infrastructure uses the same design at a larger scale. Its experiment system partitions system parameters into layers and hashes users separately per layer, so experiments in different layers overlap freely while experiments inside a layer stay mutually exclusive. The partitions exist because letting every parameter vary freely would serve combinations like “pink text color on a pink background,” but “Google has to always serve a readable, working web page.”
Exclusion costs power, so use it sparingly. Every experiment in a namespace runs on a slice of the population, which lowers its statistical power. Detecting the same effect takes longer because the population is smaller. Isolating experiments also creates a queue, because a new test waits for an old one to release its users. A program focused on experimentation at scale should reserve exclusion for conflicts a team can identify in advance.
How to detect the conflicts you didn’t predict
Mutual exclusion only covers the conflicts a team predicted in advance. The conflicts that go unpredicted usually disrupt assignment or event logging, and those issues appear in an experiment's health checks.
A sample ratio mismatch (SRM) is a statistically significant gap between the assignment ratio you configured (like 50/50) and the ratio you actually observed. SRMs can have many causes, including other experiments. For example, on platforms that reuse the same hash or user buckets across experiments, assignment in one experiment can becorrelated with assignment in another (either one running alongside it or one that ran before it). When two experiments split users with the same hash, each user gets the same number in both, so the users in one experiment's treatment are largely the same people as in the other’s. Users are only counted in your experiment when they show up and trigger an assignment. If the other experiment’s treatment makes its users return more often, and the correlation places those users mostly in one of your variations, that variation enrolls more users than the ratio you configured. GrowthBook's per-experiment hashing prevents this correlation, so overlapping GrowthBook experiments don't produce it.
A conflict that stops the page from working for one combination of users can produce an SRM too. For example, if the combination of your treatment and another experiment's treatment crashes the page before the exposure event is logged, the missing users will be concentrated in one variation, and the observed split won’t match the configured one.
GrowthBook runs an SRM test on every experiment along with a multiple-exposures warning. A multiple exposure means the same user was exposed to more than one variation of the same experiment, such as both its control and its treatment. That usually signals an identifier or assignment problem, and those users can’t be counted toward either variation. An overlapping experiment can also trigger it. For example, if another test’s treatment changes the identifier your experiment hashes, such as by prompting users to sign in, the re-assigned users can appear in both of your variations.
The largest programs also test for interaction effects directly. A daily job checks every overlapping pair of experiments for combined effects that depart from the sum of the pair's separate effects, and Google runs the same kind of check inside its layers. An interaction only shows up among the users who received both treatments, and that group is small, so only strong interactions surface. Most days the job finds nothing.
Strong interactions are rare, and reviewing adjacent tests before launch along with routine health checks prevents most conflicts.
How to maintain statistical rigor across overlapping experiments
Overlapping experiments make it possible to run hundreds of tests at once, but as experiment volume grows, so does the need for statistical rigor, as issues like false positives and peeking have more opportunities to surface.
More experiments produce more false positives in absolute terms. At a 5% significance level, 100 experiments whose treatments have no effect will produce about 5 statistically significant results by chance alone, so a program that ships every significant winner will inevitably ship some false positives along with the real ones.
The same risk repeats inside each experiment. An experiment with 5 goal metrics and 2 treatment variations runs 10 significance tests for a single ship decision, and each one is another chance at a false positive, a problem known as multiple comparisons. GrowthBook applies Holm-Bonferroni or Benjamini-Hochberg corrections, which hold each individual test to a stricter significance threshold so the experiment’s overall false positive risk stays controlled.
You might think you could apply the same corrections at the program level, but the cost is prohibitive. Holding 100 concurrent experiments to one shared 5% false positive budget would demand p < 0.0005 from every test. Reaching significance at that threshold requires roughly 2.4 times as much sample per test. With the same sample size, each test’s chance of detecting a true effect falls from 80% to about 25%. And since the experiments that are running change often, one experiment’s verdict shouldn’t depend on how many tests other teams have launched.
More experiments also mean more results to look at while tests are still running. Every early look at a running test is another opportunity for a chance fluctuation to cross the significance threshold, which inflates the false positive rate. Sequential testing keeps that rate under control regardless of how many times you look.
A real improvement in the primary metric should also appear in the metrics downstream of it. More signups should mean more activations and, eventually, more revenue. A significant lift that doesn't flow downstream may be a false positive, and teams should investigate before shipping it.
What limits how many experiments you can run
In most organizations, the limit on experiment volume is operational rather than statistical. As long as each experiment hashes users separately, far more tests can overlap than most programs run. The capacity to set up, monitor, and analyze each experiment is exhausted first. Practitioners from 13 companies at the first Practical Online Controlled Experiments Summit tied scale directly to automation. With hundreds of experiments running simultaneously on millions of users each, a program sustains routine experimentation only when the platform computes every experiment’s metrics automatically and reliably.
Booking.com is designed around the same constraint. Its platform doubles as a searchable repository of every past experiment, with its results and failures, so a team can find out whether an idea was already tested before testing it again, and its safeguards let any team run its own experiments from setup through decision. Pre-launch checks and a lightweight review step maintain the quality of each test while the number of tests grows, so a program can add volume without trading away learning.
Chess.com treats experiment volume as a direct measure of that setup-and-analysis capacity. The team ran about 400 tests in a year and then set a goal of 1,000. Nafis Shaikh, Chess.com’s director of product management, explained the goal on The Experimentation Edge: “Part of that goal is actually to determine how effective we are at just getting through work.”
Mature programs also monitor the portfolio itself, tracking velocity and win rates across teams to find the bottlenecks. Programs that want to scale should focus on operational improvements like automated analysis, shared documentation, and a standardized launch process, and worry less about interaction effects.
How DoorDash runs 12,000 experiments a year
DoorDash runs about 12,000 experiments a year, with thousands in parallel every month across 42 million monthly active users.
Analyzing that many experiments became a bottleneck. Experiment analysis at DoorDash had no standard and struggled to keep up with the rate of experiments, so the team built a shared statistics engine and an automated analysis platform around it. DoorDash’s logistics group alone grew from about 10 experiments a month to more than 100 in 3 years with standardized processes and automated analysis. Ilya Izrailevsky, the senior engineering manager who leads the platform, outlined the team’s next investment on The Experimentation Edge: agentic tooling to set up experiments, debug imbalance issues, and generate readouts quickly.
How Microsoft keeps hundreds of daily tests from colliding
By 2013, Bing was running more than 200 concurrent experiments on any given day, with 90% of eligible users in more than 15 experiments at once, and about 80% of proposed changes run first as a controlled experiment. Bing prevents known collisions with declared constraints. An experimenter marks the surface a test touches, ad layout for example, and the platform keeps two experiments carrying the same constraint from running at the same time. The daily pairwise job catches whatever the constraints miss.
Microsoft checked every pair of A/B tests running on the same day across 4 of its products. In 3 of the 4, no interactions were detectable at all. In the fourth, they appeared in 0.002% of test-pair metrics, which is 1 pair in 50,000, and no pair produced two significant effects moving in opposite directions. The team titled its write-up of those results “A Call to Relax.”
How GrowthBook helps you run more experiments at once
GrowthBook is built to handle overlapping experiments. The SDKs assign variations with deterministic per-experiment hashing, so any number of experiments can overlap with independent assignment, and teams use namespaces for the exceptions that must stay mutually exclusive. Every experiment gets an automatic balance check, multiple-exposure warnings, and a health tab, and the stats engine applies multiple-testing corrections within each experiment. On the operational side, GrowthBook 5.0 adds agent-created experiments that launch as drafts a human can review, under the same approval policies and audit trails as manual changes.
If your program is ready to start running overlapping experiments, now is the time to choose a platform that can scale with you. Get started free or join a live demo.
Related articles
.png)
.avif)
.avif)
Ready to ship faster?
No credit card required. Start with feature flags, experimentation, and product analytics — free.

