

A/B Testing with Feature Flags: Turning Every Rollout into an Experiment
.png)
You can put 50% of your users on a new checkout flow in about thirty seconds using a feature flag. But that doesn’t mean you’ve run an A/B test.
Feature flags only control who sees the change, but A/B tests measure whether that change actually worked. A flag can split users into groups, making it easy to assume you’re experimenting. However, controlling exposure and actually measuring impact are two different things.
In this article, we’ll explain how you can use feature flags to roll out features and, in turn, turn those rollouts into concrete experiments.
What’s the difference between feature flags and A/B testing?
A feature flag is an if/else conditional in your code that decides which version of a behavior a user gets. You wrap new code in a conditional check so you can control who sees it and shut it off in seconds if something breaks. So it acts as the delivery infrastructure.
An A/B test is an experimentation method. You split users into groups at random, show each group a different version, and compare outcomes to work out whether the difference came from your change or not. It randomly assigns users to two versions of an experience and measures whether one actually performs better on a metric you care about.
It’s easy to confuse them because, from the outside, they involve splitting users between experiences. The difference is that a flag asks who should see this, but an experiment asks whether it actually worked.
The roots of A/B testing go all the way back to R.A. Fisher’s agricultural experiments in the 1920s. Software just made it cheap enough to do it on every release because feature flags give you the baseline infrastructure to make that happen.
Why a percentage rollout is not an A/B test
Let’s say you roll out a new feature to 50% of your users and conversion rates go up by 3.5%. You might be tempted to credit the feature, but how do you really know it was responsible for this?
Without a concurrent control group, you can’t prove it caused the lift. That’s because several things can change during a rollout window:
- Timing: If you ramped it over 5 days and there was a seasonal promotion, that could’ve influenced the results. You would have no way to isolate the variables.
- User mix: The first 10% and the next 20% of users might not be the same type of users. Percentage rollouts are random by nature, so if the rollout picked up more mobile traffic or regional users, you can’t compare them.
- Additional changes in the pipeline: Your team might’ve made two backend changes or a landing page tweak in the same week. So there’s no way to know which change made a difference.
- No concurrent control: If you’re comparing before and after, it means you’re comparing two different weeks. But to draw a conclusion, you need two equivalent groups seeing different things at the same time.
In fact, engineering teams have seen this play out early on. Back in 2004, an intern built behavior-based search at Amazon, a prototype that put product recommendations in a user’s shopping cart.
At the time, its senior VP blocked the development because they believed it would distract customers from checking out. But the engineer ran a controlled experiment anyway, and the feature won by a huge margin, increasing revenue by 3% and resulting in hundreds of millions of dollars in incremental sales. If they never tested the feature, they would’ve never known its real impact.
In short: a rollout tells you what happened while the feature was live. An experiment gives you a real shot at knowing what happened because of it. Given that studies say that more than half of tested ideas don’t move the metric, treating every rollout as an experiment and a success is the wrong approach.
What are the building blocks of feature flag-based experimentation?
You need to have four components in place before you start experimenting:
1. A hypothesis
An experiment starts with a claim, i.e., a hypothesis. For example, “The new checkout flow will increase completed purchases by <2%.”
You’re describing what you expect to happen, but it doesn’t have to come true. This process lets you define the metrics you’ll use to analyze the results down the line.
It also forces product and data science teams to align on what the change should accomplish and how you’ll measure it before the flag goes live.
2. Variations and a control
Your experiment will need two states to compare the results:
- Control: what users see without the change (the existing experience)
- Treatment: what users see with the change (the new experience)
Your feature flag already handles this. The flag’s default value is your control, and the value you’re testing is the treatment. Both have to run at the same time under the same conditions so you can isolate whether the change made a difference.
3. Randomized, sticky assignment
Now, you randomize assignment of values to both groups so they look alike in every setting except the change you’re testing. This makes sure your results are truly statistically significant.
If your treatment skews toward specific segments, like enterprise accounts or behavior, unintentionally, the results will be biased because you didn’t control the variables.
Also, the assignment has to be “sticky.” By that, we mean that every user has to see the same version every time they visit to prevent inaccurate data collection.
In feature flagging and experimentation platforms like GrowthBook, the platform handles this via deterministic hashing. The experiment seeds with the user’s value for the assignment attribute, and maps the result to a number between 0 and 1. The variation is assigned a number, and wherever the user’s value hash falls, that’s what they get.
Note: The attribute you hash on defines what a “user” is for the test. Hash on user ID and you’re measuring people. Hash on a company ID or tier type, and everyone on that segment will land on the same side.
4. Metrics and statistical analysis
You need to choose your metrics before the experiment starts. You’ll want one primary metric tied to the hypothesis, along with a few guardrail metrics to make sure nothing degrades. For instance, metrics like error rates or p99 latency.
If you need to understand whether there’s a real difference between two groups, you’ll need a statistical engine or method to test it. The method you choose depends on the test, but here are a few common ones:
- Bayesian or frequentist analysis to determine whether your result is statistically significant.
- CUPED for variance reduction so that you can reach significance faster with smaller samples.
- Sequential testing for valid interim checks without inflating your false positive rate.
- Automatic SRM detection to catch assignment problems before they corrupt your results.
Most feature flagging platforms don’t come with built-in statistical analysis capabilities. They hand it off to a separate analytics tool, but platforms like GrowthBook run this natively. If experimentation is a core use case for you, keep that in mind when choosing the right platform for your team.
How to turn a flag rollout into an experiment
Let’s say you have a feature sitting behind a flag and you want to know whether it works. Here’s how you can do that:
- Write the hypothesis: Write down what you expect the feature to change and by how much. For example: “The new onboarding flow will increase activation by at least 3% within the next 7 days.”
- Define control and treatment on the flag: The existing experience is your control and the new one is your treatment. If you’re testing more than two options, define each value on the same flag.
- Use an experiment rule instead of a percentage rollout: Instead of using a percentage rollout, configure the flag to run a randomized experiment. As the users are assigned and those assignments are recorded, the control group will be maintained throughout. In GrowthBook, you can use an “Experiment Rule” to run a feature flag-based experiment.
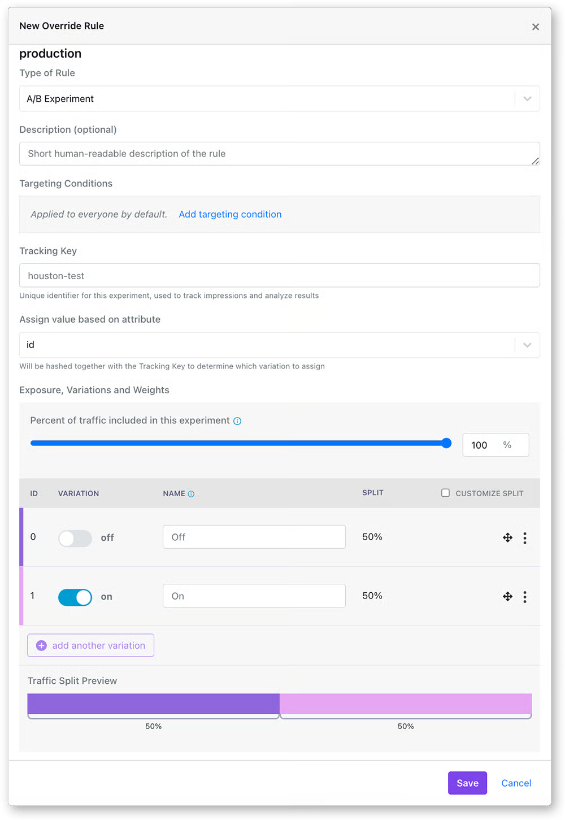
- Attach your metrics: Pick the primary metric tied to your hypothesis and the guardrails that must hold. Platforms like GrowthBook read these from fact tables defined against your warehouse, so you’re using the definitions your data team already maintains.
- Set coverage and traffic split, then start it: An even split between control and treatment gives you the most statistical power for a given number of users. If you’d like to limit your risk, start at 90/10 or 80/20 (control/treatment) and adjust it as you build confidence in the results.
- Run the experiment: Don’t check partial results and declare a winner early. It’ll inflate your false positive rate because you’re making a decision based on incomplete data. Run sequential testing if you’re willing to trade some statistical confidence for the ability to decide a winner after early peaks at the data.
- Check the data quality before analysis: Look for sample ratio mismatch (SRM). If the ratio of users in treatment vs. control doesn’t match what you set, something in your assignment logic is broken, and you can’t trust the results.
- Decide if it’s a go/no-go: If the treatment wins and your guardrail metrics also hold, roll out the feature to 100% of your users. A no-go or null decision is also a decision because it saves you from scaling something that doesn’t work.
- Remove the flag: Once you have a clear winner and have rolled it out, the feature flag is essentially dead code. Clean it up before it becomes part of the permanent codebase.
When to use a percentage rollout, experiment, or safe rollout
Not every release needs an experiment. There are three ways to roll out a feature using a feature flag:
- A percentage rollout for controlled exposure when you want to limit blast radius and will monitor metrics yourself.
- A safe rollout when the change is shipping regardless and you want automated guardrail monitoring with auto-rollback.
- An experiment when you need to measure whether the change actually caused an effect.
All three run on the same feature flag, and the difference between them comes down to whether assignment gets recorded and what you’re comparing it against.
Percentage rollout
Use a percentage rollout when your goal is controlled exposure, and you’re limiting how many users are affected if something goes wrong.
Let’s say your team rebuilt their authentication service. You need to know if the new one holds up in production without any issues. Roll it out to 5% of your users and manually ramp it up as your guardrail metrics hold.
In GrowthBook, you can use the “Percentage Rollout” feature on the feature flag. The ramp-up is manual, but if you want to automate it, you can use the Ramp Up Schedule feature.
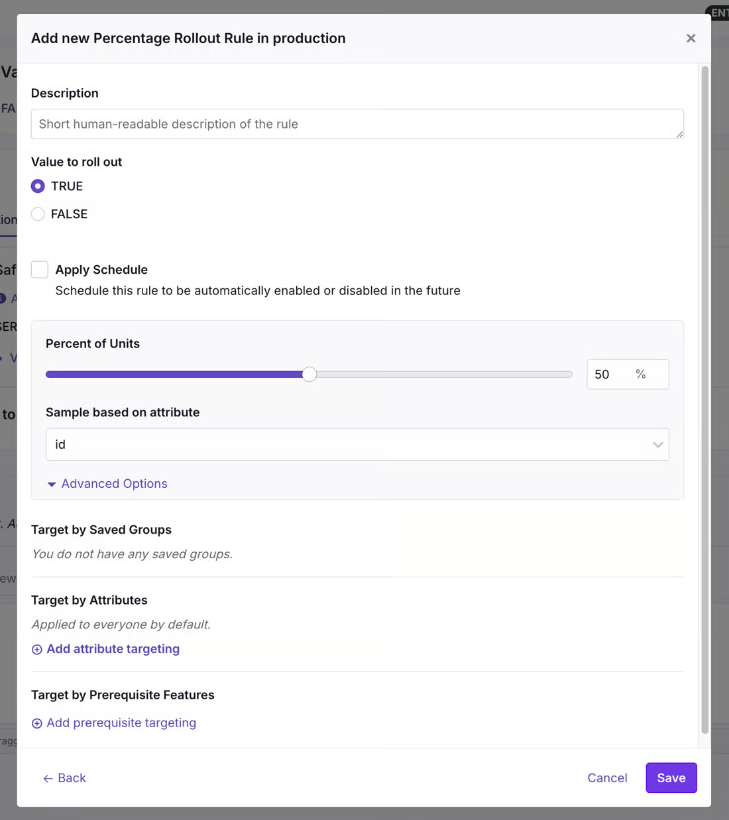
Safe Rollouts
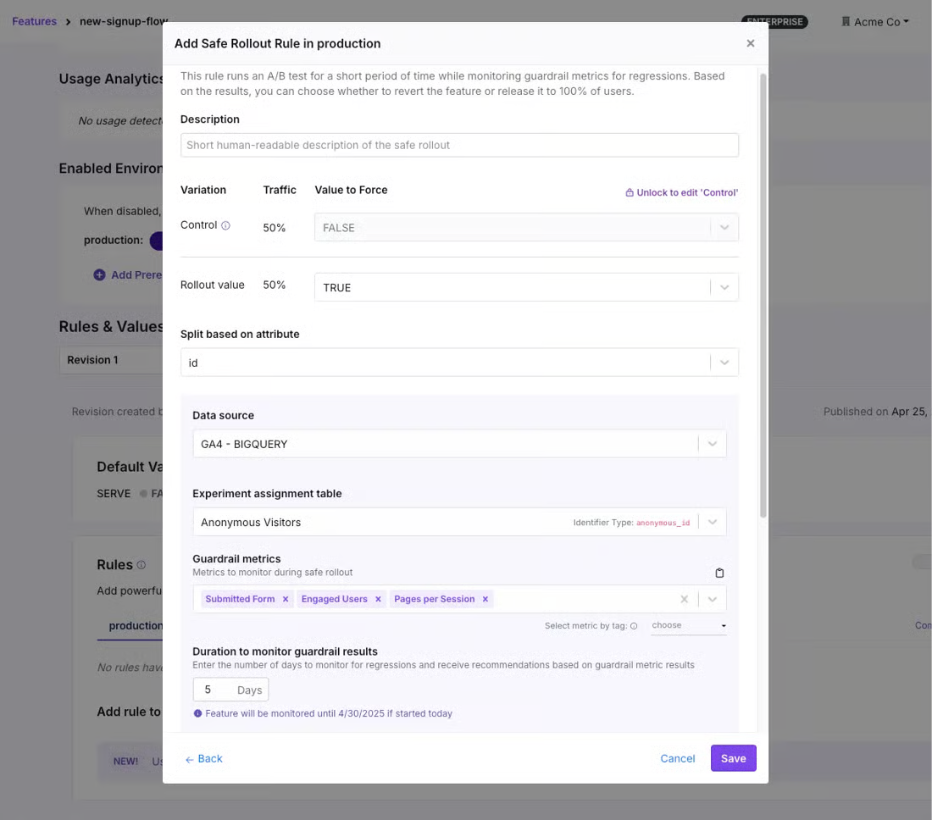
Use a Safe Rollout when your goal is to understand how the feature performs against different guardrail metrics. You can gradually release a feature with automated ramp-up and guardrail monitoring.
Let’s say your team is shipping a new pricing display across your ecommerce platform. The change will go live because it reflects updated pricing, but you want to catch any issues before it hits the entire user base. You can configure a Safe Rollout and monitor metrics like revenue per session and error rates to build confidence in your release plan.
GrowthBook attaches a ramp schedule to a targeting rule and monitors the ramp-up at every stage. If a guardrail metric degrades, it’ll automatically roll back the feature.
Since the platform runs sequential testing against the guardrail metrics, you can trust the results and make go/no-go decisions based on it.
Experiment
Use an experiment when you need to know whether a change makes a measurable difference.
Let’s say you redesigned your onboarding to improve activation rates. If 50% of users experience the new flow and 50% see the old one, you can monitor activation rates after a defined period to see whether they increased.
In GrowthBook, you can add an experiment rule to the same flag, and it’ll handle everything from assignment to data collection. The metrics come from fact tables defined against your data warehouse so the results are in a standard format your team understands. Since it has a warehouse-native architecture, there’s no data duplication either and data stays within your infrastructure.
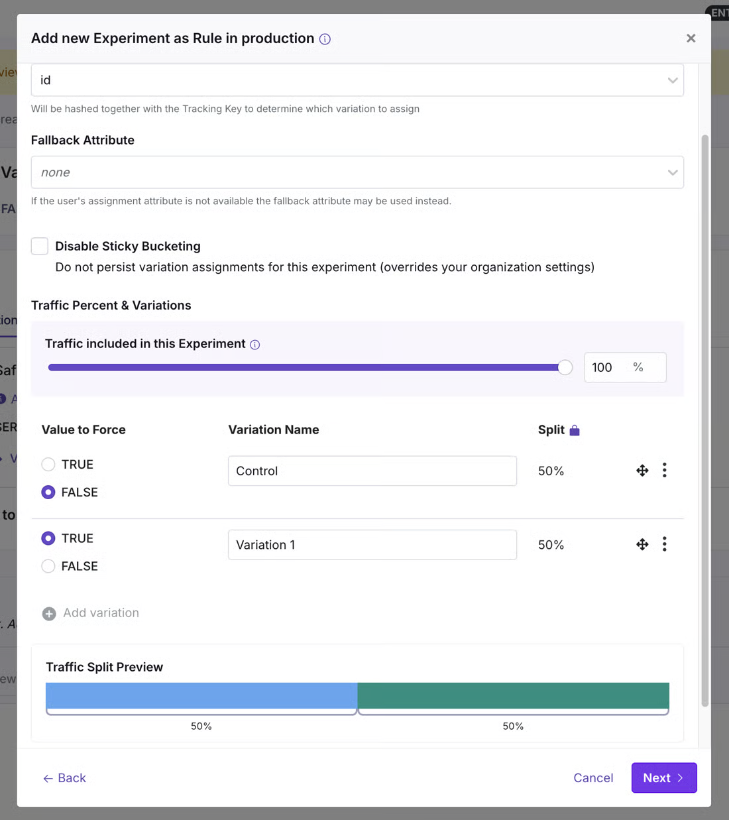
When is it not necessary to experiment?
Avoid running an experiment in the following scenarios:
- You already know the outcome, and the upgrade doesn’t need a control group.
- If your sample is too small because of traffic volumes and it’ll take too long to build the sample size.
- Suppose a feature has to be universally on at all times. This is common for regulatory requirements or contractual obligations.
Do you need a separate A/B testing tool?
When your feature flags and experiments live in two different platforms, you could end up with:
- Duplicated metric definitions
- Data duplication
- Separate assignment systems
- Multiple dashboards for the same purpose
- Reconciliation issues
As it is, 50% of developers say they’re duplicating work already done by another team, and 50% lose more than 10 hours a week to organizational inefficiency. If you add using separate tools for something that can be handled in one, you’re contributing to the problem.
And building the platform internally doesn’t solve the problem either.
Companies like Upstart did the math and realized they would need four engineers to build a platform in-house and two engineers to maintain it later. By choosing GrowthBook, they consolidated three platforms into one, avoided unnecessary development costs, and saw a 6X improvement in experimentation time.
“We had to be familiar with these different tools and rely too heavily on our analytics team for data analysis rather than having software that could handle some of that for us. […] We had to rally our teams for this project and get our old tools cleaned up. Still, the process is significantly improving the quality of our systems and reinforcing best practices around experiments and feature-flagging hygiene. […] We’ve been able to see underperforming experiments quickly and react immediately, empowering our engineers to make decisions independently.”
— Diego Accame, Director of Engineering, Growth, Upstart
4 best practices for feature flag-based A/B testing
Here are a few tips to consider when you’re using feature flags for A/B testing:
1. Fire the exposure event server-side
If you log exposure on the frontend, you’ll only count users whose browser ran your JavaScript. Bots and crawlers usually get assigned server-side and never run it, and depending on your site, they could very well be half the traffic. Plus, ad blockers stop analytics scripts for a large portion of users.
Since your losses are rarely even across variations, you’re better off logging the assignment from the backend the minute it happens.
If you also need to know who saw the change, fire a separate frontend event and use it as an activation metric, so the health checks still run against the reliable data.
2. Run an A/A test before you trust the pipeline
An A/A test splits users into two groups and shows them the same thing. Any difference it reports can be considered noise, so it tells you whether assignment and logging are working properly before you run the test.
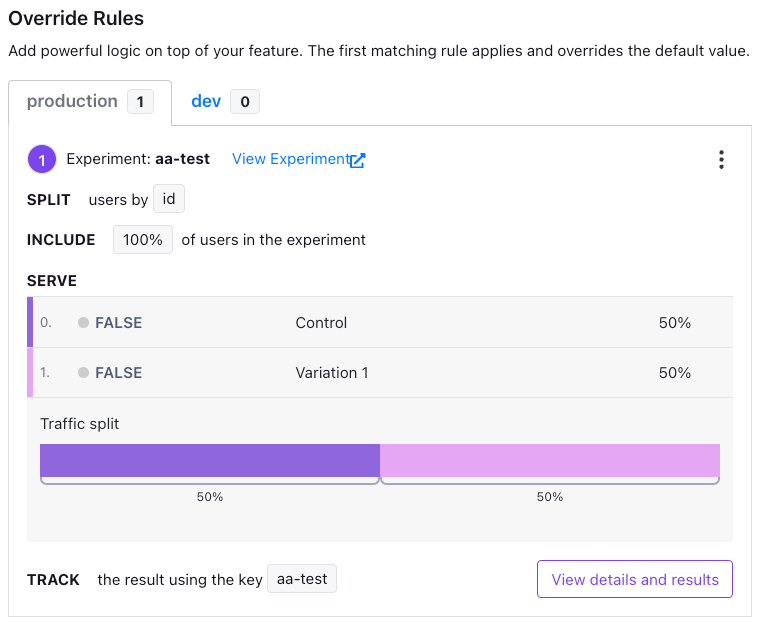
It’s best to run one before your first experiment and again after any changes you make to your warehouse or tracking code. That said, you should expect false positives roughly 10% of the time.
3. Widen a running experiment instead of reshuffling it
Once an experiment is live, it’s safe to increase the share of users in it. New users get bucketed on arrival anyway, and everyone in the test continues to see the values they were seeing.
But changing the traffic split between variations isn’t. Users move from one variation to another, so that’ll contaminate the data you’ve collected and can’t be considered valid.
4. Know what else is running at the same time
If you’re running two different experiments, they could interfere with each other. As a result, the effect you’re measuring could belong to the combination of the changes, instead of a single one.
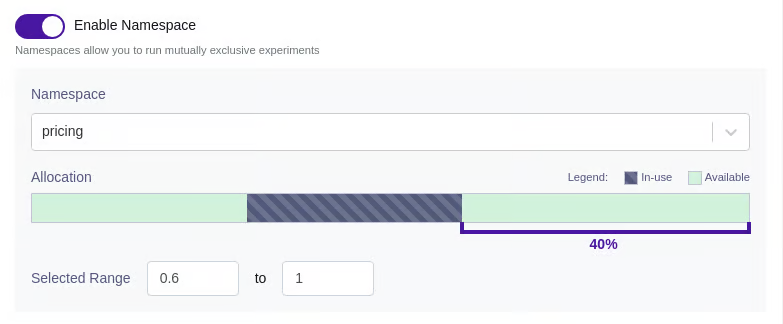
That’s why you need to either know what’s running simultaneously, which is unrealistic in a large organization. Or use namespaces to handle conflicts. If you do, each experiment will claim a slice of the traffic, and they won’t overlap. Every experiment sharing a namespace has to use the same assignment attribute.
How GrowthBook consolidates feature flagging and A/B testing
It still takes 30 seconds to put 50% of your users on a new checkout flow. But what you learn from that 30 seconds depends on whether the assignment was recorded and compared against a control at the same time.
Controlling exposure and measuring impact are two different things, but they don’t need two different systems. The feature flag decides who sees the change, but when you attach a hypothesis and related metrics, it turns into an experiment.
GrowthBook does both. It makes feature flag-based experiments a reality by giving you the infrastructure to do it. You can add experiments to existing flags, or vice versa, and get the full rollout, advanced statistical analysis, and reporting in one platform. Plus, you can run experiments easily by filling out just five fields and getting started.
In fact, companies like Breeze Airways have doubled experimentation throughput and avoided $1 million in losses with GrowthBook.
If you’re ready to turn your next rollout into a concrete experiment, try GrowthBook for free or book a demo.
Related articles
.png)
.png)
Ready to ship faster?
No credit card required. Start with feature flags, experimentation, and product analytics — free.

