What is chaos engineering? Benefits and reliability practices

A redundant service can still fail when an optional dependency gets slow.
Your checkout has several application instances, a replicated database, and health checks. Then the recommendation service starts taking seconds to respond. Checkout requests wait, connection pools fill, and customers cannot finish paying. Every instance is technically running.
The architecture diagram showed redundancy. It did not demonstrate that the checkout path would remain usable under this particular failure.
Chaos engineering addresses that gap by testing explicit assumptions about system behavior under controlled disruption. The useful result is evidence about a failure mode: whether timeouts work, whether fallback behavior protects a critical journey, and whether the team can detect and recover from harm.
This guide explains how to choose that assumption, define acceptable behavior, limit exposure, and separate stopping a test from restoring service. The examples use an imaginary checkout system. Their numbers are proposed exercise settings, not reliability benchmarks or reported production results.
Test a resilience assumption, not a random failure
Start with a claim you can challenge
Chaos engineering is the practice of deliberately introducing controlled disruptions to learn how a system behaves and improve its resilience. The discipline's foundational principles emphasize measurable normal behavior, realistic events, and minimizing the scope of harm.
The hypothesis should describe the service users receive. “The recommendation container can restart” describes a component. “Checkout remains usable when recommendations are unavailable” describes a resilience claim worth testing.
For the imaginary checkout, a sharper hypothesis is: when the recommendation dependency slows down, the application abandons that optional request, displays checkout without recommendations, and continues processing purchases within agreed limits. That statement identifies both the fault and the expected protective behavior.
It also makes failure informative. If checkout stalls, investigate the timeout boundary, connection sharing, or fallback path. If checkout stays healthy but recommendations disappear permanently, the initial hypothesis may hold while the recovery design still needs work. One binary pass label would conceal that distinction.
Keep adjacent testing methods in view
Fault injection is a technique: introduce delay, terminate a process, reject a request, or simulate an unavailable dependency. Chaos engineering supplies the question, observation plan, and improvement cycle around the technique.
Load testing changes demand to examine capacity or performance. A chaos exercise may combine load with a fault, but changing both immediately makes diagnosis harder. A game day is a coordinated exercise format. It can include fault injection, incident communication, or recovery rehearsals without testing every aspect of the architecture.
Product A/B testing asks a different question: how assignment to a product change affects an outcome. Its randomization and statistical analysis do not replace a chaos exercise's operational stop controls. A failed-payment alarm should not wait for a product experiment to reach statistical significance.
These practices complement the layered testing used for reliability. Unit tests can check timeout logic cheaply. Integration tests can check dependency responses. A system exercise can reveal that a healthy fallback still competes for an exhausted shared resource.
Describe benefits as learning, not immunity
A well-designed exercise can expose hidden dependencies, test alerts, reveal recovery gaps, and give responders practice with a specific failure. Those benefits become useful when they produce a change: a bounded retry policy, an independent resource pool, or an updated runbook.
Passing demonstrates behavior under the conditions actually exercised. It does not prove that the service can withstand every outage, traffic level, or fault combination. Keep the tested software version, load profile, dependency configuration, and scenario alongside the result so another team can interpret its limits.
Define steady state and the smallest useful scope
Measure the customer journey before component health
Steady state is the measurable behavior you expect the service to maintain during the exercise. It need not mean that every internal metric stays unchanged. A fallback may increase cache reads while protecting checkout success.
Choose a small set of user-facing signals, then add diagnostic signals to explain changes. In the imaginary example, the team might require checkout success of at least 99.5% and a checkout p95 latency of no more than 800 milliseconds during the planned fault. These are illustrative exercise criteria; another service needs its own limits and measurement windows.
The distinction between user-visible symptoms and internal causes is central to monitoring distributed systems. Watch success and latency for the critical journey. Use dependency duration, retry volume, connection utilization, and queue age to understand what happened underneath.
Define denominators explicitly. A success rate calculated only from completed requests may exclude timeouts before they reach the logging path. A dashboard can look healthy because the failing clients stopped reporting. Compare application events with an independent probe or ingress measurement where appropriate.
Monitor the enrolled cohort and the system as a whole separately. In this example, the acceptance thresholds apply to enrolled checkout attempts, while system-wide success, latency, and resource pressure protect everyone else. A healthy aggregate can hide serious harm to a small cohort. If the cohort is too small for a stable percentile or rate estimate, use a representative synthetic probe and a longer acceptance observation period rather than claiming that a sparse window demonstrates health.
Bound infrastructure as well as enrollment
Start with the smallest scope that can answer the question: one test tenant, one worker pool, a dedicated environment, or a limited set of requests. Scope the injector separately from the application cohort. A correctly targeted application flag does not prevent an infrastructure tool from selecting the wrong resource.
At an illustrative volume of 10,000 requests per minute, a 1% enrollment corresponds to about 100 requests per minute. That arithmetic estimates direct enrollment at the stated rate. It does not cap the number of affected users. Those requests may consume a shared database pool, trigger retries, or write to a queue used by everyone.
Map the path outward from the target. Which caches, databases, credentials, control services, and background jobs are shared? Does the fallback call a second dependency that could also become saturated? Can the injector reach the observability service or the mechanism needed to stop it?
Use this map to choose physical or logical isolation where needed. Percentage targeting is useful, but it is only one layer of the boundary.
Treat the error budget as a constraint
For a request-success SLO of 99.9%, 30 million eligible requests allow 30,000 unsuccessful requests over the defined period. That is a request-based illustration, not an uptime allowance. Whether a planned exercise counts follows the service's SLI policy; do not silently remove affected requests to make a result look better.
Check the remaining budget and current service health before the exercise. A small planned disturbance can be a poor decision during an unrelated incident or when recovery capacity is already constrained. The target percentage cannot answer that risk question by itself.
Design a stronger flag boundary
Explore feature flag architecture, lifecycle practices, and observability before using targeting as one layer of a reliability exercise.
Read the Feature Flag Guide
Write stop and recovery plans before injecting faults
Give every control an owner
Name the exercise lead, the person monitoring service health, and the person authorized to stop the test. For a small rehearsal, one person may fill several roles, but the responsibilities should remain explicit. Include the on-call owner for every shared system the exercise could affect.
Write down what each control actually stops. Disabling application enrollment may protect future requests without ending an injected network delay. Stopping the injector may leave an application feature enabled. Rolling back a deployment may do neither if fault injection runs independently.
Verify that the stop path remains reachable under the proposed failure. A runbook stored behind the dependency being disrupted is not available when needed. The same problem applies to credentials, dashboards, or a control service that shares the targeted network path.
Distinguish acceptance limits from abort limits
The hypothesis can fail before the exercise reaches an emergency threshold. In the example, latency above 800 milliseconds could falsify the intended behavior while a separate, more severe threshold triggers immediate operational intervention.
The team might propose stopping if checkout success falls below 99% or p95 latency exceeds 1,200 milliseconds for 2 consecutive 30-second evaluation windows, in either the enrolled cohort or the whole service. Evaluate each population separately. Require adequate observations for each metric; otherwise classify that window as insufficient evidence and use the predeclared missing-data or low-traffic stop rule. It should also stop immediately for duplicate financial writes, unexpected target expansion, lost monitoring, or an unrelated incident. These are proposed settings, not universal recommendations.
The enrollment example produces only about 50 requests per 30-second window. A p95 based on so few observations is unstable, and a single failed request already changes the observed success rate by 2 percentage points. Set minimum observation counts and independent probe criteria before the run. Do not keep an unsafe test running simply to accumulate a smoother percentage.
Two 30-second windows do not guarantee a stop within 60 seconds. Metric collection, aggregation, missing data handling, alarm delivery, and control propagation add delay. Rehearse the entire chain and determine whether that delay is acceptable for the possible harm.
An infrastructure service can provide a concrete mechanism. AWS FIS stop conditions, for example, use CloudWatch alarms to stop an experiment. The alarm must still measure the right behavior, target the intended experiment, and react quickly enough.
Explicitly review how the alarm treats missing data. A sparse error-only metric and a continuously reported availability probe need different interpretations. Confirm the exercise's response to missing telemetry rather than assuming the alarm's default matches the plan.
Verify restoration separately
An experiment status of stopped is a control-plane observation. Recovery means users and dependent systems have returned to acceptable behavior. Those events may occur at different times.
The FIS stopping procedure describes completion of remaining post actions before an experiment stops. That does not establish that every downstream consequence has disappeared. A queue can retain work, a cache can retain a bad value, and a failed transaction can require reconciliation.
Before the exercise, record how you will remove the fault, restore application configuration, inspect persistent side effects, and confirm recovery. For a stateful test, include an integrity check. For the recommendation example, verify both purchase success and that recommendations eventually resume without an accumulating backlog.
| Planning decision | Evidence required before the exercise |
|---|---|
| Target boundary | Exact resources and application cohort, with shared dependencies identified |
| Acceptance and abort rules | Metric definitions, thresholds, evaluation windows, and missing-data behavior |
| Stop mechanism | A rehearsed way to end injection and a separate way to halt application exposure |
| Recovery | A restoration procedure plus user-facing and data-integrity checks |
| Ownership | Named lead, observer, responder, and go/no-go authority |
The checklist is an entry condition, not paperwork to finish while the fault is active. An unresolved recovery step is a reason to improve the rehearsal before expanding its scope.
Run a controlled learning cycle
Rehearse with representative conditions
Use a nonproduction environment for the first attempt, with synthetic or appropriately protected test data. Confirm that the selected fault is reversible and that test accounts cannot accidentally create real purchases or contact customers.
Representativeness matters as much as the environment's name. A staging system with unlimited resources, no background jobs, and a mock dependency may miss the exact pool exhaustion you want to study. Record the differences rather than presenting staging success as proof of production behavior.
Reliability testing across critical flows connects failure modes to recovery targets. Apply that idea to the whole checkout journey: initiation, payment response, confirmation, and any asynchronous work needed to complete the order.
Production testing can reveal interactions that a rehearsal misses. It also creates real exposure. Moving there requires a specific risk decision, narrower initial targets, reliable controls, and an observation window with responder capacity. Production fidelity is a reason to plan carefully, not permission to skip rehearsal.
Separate baseline, disruption, and recovery
Observe a stable baseline first. Confirm target selection and expected traffic before introducing the fault. Record the injection's actual start and end, rather than assuming they match the requested timestamps.
During disruption, watch both the hypothesis metrics and the abort conditions. Keep the duration bounded. If monitoring disappears, treat the loss of visibility as a reason to stop rather than interpreting an empty dashboard as healthy behavior.
After removal, continue observing until queues, connections, and customer-facing signals stabilize. Record the time the fault ended and the time the service recovered separately. If the application returns to normal only after a manual restart, that intervention belongs in the result.
Avoid changing several unrelated controls mid-exercise. Increasing traffic, changing a timeout, and replacing the fallback simultaneously can produce an apparent improvement without revealing which change mattered. End the run, document the observation, and design a follow-up that isolates the uncertainty.
Interpret evidence without overstating causality
A before-and-after comparison is vulnerable to concurrent deployments, demand changes, and background work. An unaffected comparison group can help where feasible, but only if the fault does not spill into shared resources used by both groups.
Keep raw observations, traces, and the intervention timeline. State what they support: “The checkout pool saturated after injected dependency delay; fallback requests then waited for connections.” That is more useful than “Chaos proved the architecture is unreliable.”
For each weakness, assign a repair, an owner, and a retest condition. If the hypothesis holds, preserve the scenario so it can detect a later regression. Maintained chaos experiments are more valuable than one impressive demonstration followed by no follow-up.
Record what an aborted run still teaches
Suppose the checkout exercise stops because the cohort's latency rises while system-wide latency barely moves. That result does not establish that the global boundary worked perfectly. It shows that aggregate monitoring would have missed the enrolled users' experience, and that the cohort-specific stop path deserves to remain part of the design.
Now suppose the injector reports stopped, but checkout stays slow. Separate the timelines. Did dependency latency end when requested? Did existing connections remain occupied? Did retries continue from already queued work? Did the fallback share the same exhausted pool? Each question points to a different corrective action.
An observer should record these events while another person restores service. Reconstructing everything later from memory loses the timing that distinguishes a slow stop mechanism from slow application recovery. Preserve the event record without delaying intervention to gather a cleaner chart.
The follow-up exercise should test the repair against the original failure, under comparable conditions. If the team fixes connection isolation but also reduces traffic substantially, a clean result does not isolate the effect of that fix. Document the changed conditions and decide whether another representative run is needed before increasing confidence.
Use feature flags to control exposure
Gate a behavior that already has a fallback
A flag can choose whether a request uses the recommendation path. It cannot invent a fallback after the dependency fails. Engineers must implement and test the behavior on both sides of the gate, including how in-flight requests and background jobs behave when configuration changes.
GrowthBook feature flags separate release exposure from code deployment. In a reliability exercise, that can help enroll a chosen test cohort or return new requests to an existing behavior path. The same mechanism can support later rollout of a timeout or fallback repair.
Do not assume that flipping a flag cancels work already running. Verify the SDK's configuration update behavior in your application and the point where each request evaluates the flag. A cached result, a long-lived process, or an enqueued job can retain earlier behavior.
Verify rules, attributes, and environments
In GrowthBook, rules are evaluated in order, with the first matching rule determining the outcome. A broad rule above the intended test cohort can change who receives the behavior. Review the whole effective rule list, not just the new condition.
Targeting attributes come from the application. If the test-tenant attribute is absent or inconsistent between services, the observed population may differ from the planned one. Confirm several included and excluded cases before introducing disruption.
Use the correct SDK connection for the intended environment. An application labeled staging in a deployment dashboard can still load the wrong feature configuration. Confirm the effective configuration from the running application and its test identity.
Finally, inspect the fallback behavior when a feature is disabled. “Disabled,” “false,” and “return to the old application path” are not interchangeable without considering the SDK call and the code surrounding it.
Keep release monitoring distinct from emergency control
GrowthBook's Safe Rollouts combine a ramp schedule with metric monitoring to compare existing and new values. That can help evaluate the product impact of a release, including a resilience improvement.
A short fault-injection exercise still needs independent operational monitoring and a rapid stopping procedure. Warehouse ingestion and statistical detection may be too slow for its harm window. A product guardrail is not a substitute for an infrastructure alarm, a tested fault-removal action, or direct recovery checks.
The resulting division is practical: flags control application exposure, the injection system creates and removes the disturbance, and operational telemetry tells responders whether to intervene. Test their interaction rather than assuming one tool owns the entire lifecycle.
Make resilience learning part of delivery
Measure closed weaknesses, not dramatic disruptions
A count of terminated instances says little about reliability improvement. Track which important failure assumptions have been exercised, which weaknesses remain open, and whether fixes survived a repeat of the original scenario.
Keep the evidence understandable to someone who was not in the room. Include the hypothesis, actual targets, software version, traffic conditions, observation windows, stop reason, recovery actions, and limits of the conclusion. Attach the repair or a deliberate acceptance of the remaining risk.
Change the scenario when the architecture changes. Moving recommendation work to a queue may remove synchronous latency while introducing backlog and replay risks. Repeating the old HTTP-delay test alone would no longer cover the critical assumption.
Choose the next exercise from an unresolved question
Start with one plausible dependency failure and one customer journey. Finish with a concrete decision: the fallback held under the tested conditions, the design needs a repair, or the evidence was insufficient because visibility or isolation failed.
An inconclusive exercise can still be useful. Discovering that the team cannot measure recovery reliably identifies prerequisite work. Fixing that measurement gap may be a better next step than injecting a more severe failure.
For the imaginary checkout, the first durable improvement might be a dedicated connection pool and an explicit dependency timeout. The next run should ask whether those controls keep checkout usable and whether recommendations recover cleanly afterward. That is how a controlled disruption becomes an engineering practice rather than an event.
Control your next release
Use GrowthBook to introduce a repaired behavior behind a feature flag, validate targeting, and expand exposure through your team's release process.
Get Started
Related Articles
CLI vs MCP: TLDR, it doesn’t matter as much as you think
Your agent should know how to do the job whichever interface it uses.
Your coding agent can already run terminal commands. Your product manager's assistant can connect to remote tools. Both need to inspect the same experiment, understand the same metric, and prepare changes to the same feature flag.
That creates a familiar question: should you give them a CLI or an MCP server?
The usual answers mix several concerns. A CLI is easy to compose with scripts. MCP gives compatible clients a standard way to discover and invoke tools. Skills can supply the instructions that make either route useful. None of those statements tells you whether the agent knows your release process or can distinguish a draft from a live change.
For GrowthBook, the choice has become smaller. We've built the agent layer around a REST API and reusable workflow skills, then made those available through different interfaces. Your choice of CLI or MCP no longer needs to determine which product workflow your agent can understand.
It still determines how the agent connects, executes requests, and handles credentials. This article explains that distinction, shows the same disabled-flag operation through both routes, and gives you a way to evaluate the integration you actually intend to use.
The debate combines three different questions
Start with a specific job: prepare a release control for a new checkout flow. The agent needs to know which project owns checkout, which environments exist, what the default behavior should be, and whether the proposed flag key already exists.
Choosing an interface answers only part of that job.
How can the agent reach the product?
A command-line interface lets an agent invoke a program in an environment where it has shell access. That program can make authenticated API requests and return data. You can also run the same commands yourself, put them in scripts, and preserve output for inspection.
The Model Context Protocol architecture connects a host application to servers through clients. An MCP server exposes capabilities that a compatible host can discover and call. The host might be a coding environment, a desktop assistant, or another agent application.
These categories overlap. A terminal-based agent can also be an MCP client. A local MCP server can be a process launched by that client. A remote MCP connection can work without the host giving the model a general-purpose shell.
So “terminal agent” doesn't automatically mean “use the CLI,” and “MCP” doesn't automatically mean “remote service.” Ask what access the runtime provides before choosing the adapter.
What procedure should the agent follow?
An API can expose a create operation without teaching an agent when to use it. A syntactically valid feature flag might still have the wrong project, an ambiguous key, or a default value that doesn't match the application.
That's the job of a skill: reusable instructions for a recognizable task. The Agent Skills format gives those instructions a portable structure, including a skill entry point and supporting references. A workflow can describe the context to inspect, the sequence to follow, and the evidence to return.
For the checkout example, useful guidance says to resolve environments, check the permanent key, choose a value type, and create the flag disabled. Merely exposing a create command leaves those decisions to the agent's general knowledge.
Skills are also useful when the right answer is to take no action yet. “Create a flag” and “design an experiment” are related requests, but they can require different objects and sequencing. An agent needs enough product guidance to make that distinction.
What context makes the procedure relevant?
Even a good playbook needs the current product state. The agent should inspect the objects in your GrowthBook organization and, when it is changing application code, the repository's SDK initialization and tests.
Those are different sources of context. GrowthBook supplies flags, experiments, metric definitions, and other authorized product resources. Your coding runtime supplies the application files it can access. An MCP connection doesn't by itself grant repository access, and a CLI doesn't by itself explain your metric definitions.
Evaluate the combination: access to the product, a maintained procedure, and enough context to apply that procedure. A comparison that changes all three at once cannot isolate the effect of CLI versus MCP.
GrowthBook puts the durable parts below the interface
We separated the agent layer into responsibilities that can be reused. The product API exposes operations. Skills explain workflows. The interface connects the agent to those two layers.
This is the architectural shift behind GrowthBook's agent experience. Instead of making every client integration carry its own interpretation of experimentation, we can share the interpretation and change how it is delivered.
The API provides the operations
GrowthBook's REST API makes product objects addressable. An agent can inspect a project, retrieve a flag, or perform an authorized operation against those objects.
The rebuilt API described in GrowthBook 4.4 uses shared schemas to support types, validation, and API documentation. The CLI is generated from the API definition. That reduces the amount of separately maintained command logic needed to expose product operations.
The OpenAPI specification explains the underlying principle: a machine-readable description can represent an HTTP API's paths, operations, inputs, and responses. Generation is useful because it derives another interface from that contract.
Generation doesn't mean any installed binary knows every future endpoint. The generated client still has a version, and your GrowthBook server still has a version. A self-hosted instance can lag behind the public documentation. Treat API compatibility as a deployment fact you verify.
Skills provide the workflow guidance
GrowthBook's feature-flags skill routes requests to more specific workflows. Creating a flag, inspecting dependencies, changing targeting, requesting review, and publishing a revision are separate procedures.
That structure lets the agent load the guidance relevant to the current job. The skill authoring guidance on progressive disclosure supports this approach: keep the entry point focused and place detail in references that are loaded as needed.
The benefit is maintainability as well as context management. A correction to a flag workflow can be made in the maintained skill rather than repeated across a series of tool descriptions and client-specific prompts.
There are two shell concepts to keep distinct. The generated growthbook CLI is a terminal interface to the product API. The skills repository also includes a small gb-call helper for making REST requests. Installing a skill doesn't make that helper a globally available command; its location depends on the installation. Both can reach the API, but their configuration and invocation are different.
MCP provides a thin bridge
The current GrowthBook MCP implementation exposes four tools: growthbook_list_skills, growthbook_read_skill, growthbook_api_read, and growthbook_api_write.
An agent discovers a domain, reads the relevant workflow, then makes API calls. It doesn't need a dedicated MCP tool for every product endpoint. Calls described as gb-call GET in a skill map to the read tool; mutating methods map to the write tool with the same path and body.
The bridge does not run the shell helper. It forwards authenticated requests. Product-side permissions and validation remain important because a small tool surface can still reach many operations.
Shared guidance also has a delivery boundary: the MCP server bundles skills when it is built, using a pinned source revision. A newly edited skill in the repository needs to be included in a subsequent server build before that server supplies it. “Shared source” is a maintainability claim, not a promise of instant synchronization.
Explore the shared flag workflows
Open the feature-flags skill to see the procedures that guide creation, targeting, reviews, and publishing. Bring the same workflow knowledge to the agent interface your team uses.
View the Flag Skill
The same disabled flag can use either route
The practical question is whether the interface changes the job. Let's create a Boolean flag called checkout-redesign, with a false default and every environment disabled.
This is an API example for a sandbox project, not an application integration tutorial. It creates a control object; your application still needs a correctly configured GrowthBook SDK to evaluate it. The feature flag documentation covers the product concepts behind that integration.
Connect and verify before preparing the write
For the terminal route, install the current GrowthBook CLI, configure a Personal Access Token through its interactive setup, and inspect the available command syntax:
Check that the active server and identity are the ones you intend to use. Prefer a tested, pinned CLI version in repeatable automation. Don't include a live token in a command you plan to share.
For an MCP route, the GrowthBook Cloud setup uses the hosted endpoint and browser OAuth. In a client using the documented mcpServers configuration shape, such as Cursor, add:
Complete the browser authorization and confirm tool discovery. Other clients can use a different configuration shape. Self-hosted GrowthBook users should follow the local stdio or self-hosted HTTP instructions rather than point a private instance at the Cloud service.
Next, let the connected agent discover the flag-creation workflow. These are tool-call parameters, shown separately in the order to invoke them:
The returned guidance should describe the prerequisites for creating the flag. If the workflow isn't present, resolve the server's bundled skill version before substituting instructions from an older integration.
Resolve real IDs and construct one payload
The flag-creation workflow checks existing keys, lists projects, and resolves environments. In the MCP client, invoke the read tool with each of these argument objects:
For the CLI route, perform that discovery with the corresponding command groups documented in the CLI command catalog:
Inspect each command's help if your installed version differs. The returned keys, project IDs, and environment IDs are the inputs to the payload below. In MCP, the equivalent read-tool arguments are:
Verify that checkout-redesign isn't taken, identify the sandbox project's ID, and enumerate every actual environment. These read responses determine the payload; don't treat example environment names as a complete inventory of your organization.
Save the following as flag.json, replacing <PROJECT_ID> and the environment keys with the discovered values. This example assumes the only environments are staging and production:
The API represents defaultValue as a string, even for a Boolean flag. Explicitly disabling each environment avoids relying on the organization's default state for newly created flags. Use a PAT for this example so the caller has a user identity for attribution.
Review the permanent key, project, value, and disabled states before submitting. If the intended job is an experiment, route to experiment design first instead of creating an unrelated flag and hoping to connect it later.
Submit once, then read the object back
With the CLI, the create command accepts a JSON body. In a Bash-compatible shell, inspect the request with dry run before submitting:
The first command previews a request; it doesn't prove the server will accept it. Run the second only after checking the preview and approving this creation. In PowerShell, use that shell's file-reading syntax rather than paste the Bash substitution unchanged.
The PowerShell equivalent, using the same reviewed file, is:
The same distinction applies: preview first, approve the specific creation, then submit. Neither command changes the application's deployed code.
Through MCP, call growthbook_api_write with the same payload serialized into its body string. Substitute the same resolved project and environment names:
Choose one creation route. Don't run both against the same key; they target the same product object, and the second creation should encounter an existing key.
Verify through the CLI get command:
Or invoke growthbook_api_read with:
Check the returned key, project, value type, default value, disabled state of every environment, and absence of unintended rules. Report those facts rather than “success.” No targeting or exposure change is included in this example.
Choose the route that fits the runtime
Once the procedure and API operation are shared, the remaining choice is operational. Where does the agent run? What can it execute? How does it authenticate? What does your team need to inspect afterward?
Shell access favors terminal composition
A shell-capable agent can run the CLI alongside repository tools, save structured output, and combine product inspection with local checks. That is useful when the job includes code changes, generated files, or a reproducible script.
For example, a flag audit can produce an inventory file while an engineer separately checks code references. The agent should preserve the association between the GrowthBook key and each repository reference. The final artifact can include both the product state and the proposed code diff.
The shell makes composition available; it doesn't make a workflow safe by default. A script can select the wrong profile or swallow an error. Decide which failures stop the workflow, where outputs are stored, and which steps need a reviewable artifact.
Remote tool access favors MCP clients
MCP is useful when the host already provides a tool connection but doesn't expose a terminal. A PM can inspect an experiment through a compatible assistant without installing a product CLI inside that assistant's runtime.
The MCP authorization specification defines an authorization framework for HTTP transports. GrowthBook Cloud uses browser OAuth, while local stdio configurations use credentials supplied to the process. Those are distinct deployment paths.
MCP also gives hosts a structured description of tools. The tool specification includes annotations such as read-only and destructive hints. Hosts can use those signals in their interaction design, but the signals are not an access-control boundary. The product must still enforce the caller's actual permissions.
Use a small decision table
| Your immediate requirement | Route to consider | What to verify |
|---|---|---|
| Combine product operations with local files and scripts | CLI plus maintained skills | Shell access, profile, installed version, structured output |
| Connect a compatible assistant without a shell | Hosted MCP | HTTP/OAuth support, identity, tools, bundled workflow |
| Keep requests inside a self-hosted deployment | CLI or self-hosted MCP | Network reachability, server version, credentials, trusted app origin |
| Reuse a procedure across different team clients | Shared skills through either route | Workflow revision, API compatibility, expected review artifact |
You can support more than one row. An engineer's CLI and a PM's MCP connection can operate on the same objects with different identities and permissions. Standardizing the workflow is often more useful than standardizing everyone's client.
Compare actual outcomes, not tool counts
Four MCP tools can address a large API. A large CLI command catalog can expose the same operations. Counting entries tells you little about whether an agent completed the intended job correctly.
Likewise, there is no universal token or speed result implied by the architecture. The client, model, instructions, response size, pagination, and number of requests all affect a real run. Measure the work you need instead of importing a result from an unrelated integration.
Keep the evaluation task constant
Use one sandbox project and one bounded task. For a read test, ask each route to find a named flag and identify its enabled environments, current revision, and relevant dependencies. For a write test, use separate temporary keys with the same reviewed disabled-flag requirements.
Give both runs the same expected output. Record whether each identified the correct objects, loaded the relevant workflow, handled missing data, and preserved the boundary between creation and exposure. Measure elapsed time and context consumption only alongside those correctness checks.
If one run gets rich workflow guidance and the other gets only a command name, you're testing the guidance as well as the interface. That can still be a useful product evaluation, but describe what changed.
Test failure behavior deliberately
Try a nonexistent object, an existing key, and a credential without the required permission. The agent should identify the failure and stop the dependent action. It should not invent an ID, silently pick another environment, or reinterpret a permission error as permission to retry with a broader credential.
The revision workflow adds another important test: multiple open drafts. When a chain of changes belongs in one revision, the agent must preserve its version rather than repeatedly ask for whichever draft is latest.
A creation receipt and a publication receipt are different artifacts. If your evaluation only checks that a request returned without error, it can miss the point where a proposed change became live or where a draft failed to include the intended edits.
Record the versions behind the result
Capture the CLI version, server version when available, client configuration, and the skill text or revision used. With MCP, inspect the guidance actually returned by the connected server. With installed skills, inspect the local instructions actually loaded.
That record makes a later regression diagnosable. A changed result may come from new guidance, a client update, a changed API, or different product state. “MCP became worse” is too broad to help you fix it.
Build workflows that survive the next client
The most useful consequence of GrowthBook's design is organizational. Engineers, PMs, and analysts can choose the agent surface that fits their work while referring to the same flags, experiments, and metrics.
An engineer can prepare a disabled flag from a terminal. A reviewer can inspect its draft in the app. An assistant connected through MCP can retrieve the same object and explain its state. The handoff should carry an ID, a revision where applicable, the proposed behavior, and the decision still required.
This is where the CLI-versus-MCP question loses much of its importance. Your release procedure doesn't need to be rewritten around each client. The product holds state; the API exposes operations; skills explain the work; the chosen interface delivers access.
Start with one inspection or sandbox creation. Require the agent to return a concrete object and its verified state. Then add the next workflow only when the current one is reliable enough for your team to review.
GrowthBook's feature flag platform gives that work a common place to live. The durable choice is how you connect release control and measurement to your team's process. CLI and MCP are ways to carry that process into the tools people already use.
Start with a common foundation
Set up GrowthBook for the flags, experiments, and metrics your agents will share. Then choose the CLI or MCP connection that fits each team member's work.
Get Started With GrowthBookStandard deviation vs variance: Key differences for A/B testers
A metric can have wide user-to-user variation and still yield a precise experiment estimate.
That is why confusing standard deviation with standard error creates bad A/B testing decisions. A dashboard may show that users differ substantially while the average effect is estimated closely enough to guide a release. Those statements can both be true.
Variance and standard deviation describe spread. Variance works on a squared scale; standard deviation takes its square root to return to the metric's original units. Neither is automatically the uncertainty around an experiment result.
For A/B testers, the useful distinction is practical: use standard deviation to communicate outcome variability, use variance in the calculations that combine uncertainty, and inspect the standard error or interval for the treatment effect. Start by making sure all three describe the correct unit of analysis.
Understand the difference in units
Variance uses squared distances
Outcomes above and below a mean have deviations with opposite signs. Simply averaging those signed deviations gives zero. Variance avoids that cancellation by squaring each deviation before combining them.
The sample variance formula is s² = Σ(xᵢ − x̄)² / (n − 1), where x̄ is the sample mean and n is the number of observations. The symbol Σ means to add the terms across observations.
If the outcome is measured in seconds, variance is measured in seconds squared. That is mathematically useful but less intuitive for explaining a product experience. “Variance is 4 seconds squared” does not mean users differ by 4 seconds.
Standard deviation returns to the original scale
Standard deviation is s = √s². A variance of 4 seconds squared corresponds to a standard deviation of 2 seconds. Both describe the same dispersion, expressed on different scales.
Do not define standard deviation as the average absolute distance from the mean. That is a different measure. Squaring deviations gives large deviations more influence, and taking the square root afterward does not undo that weighting.
| Quantity | What it describes | Units for task time |
|---|---|---|
| Variance | Squared dispersion in outcomes | Seconds squared |
| Standard deviation | Outcome dispersion on the original scale | Seconds |
| Standard error of the mean | Sampling variability of an estimated mean | Seconds |
Neither variance nor standard deviation requires a normally distributed population merely to be calculated. Normality matters for particular interpretations and inferential procedures, not for the existence of these summaries when the required moments are finite.
Calculate both from the same observations
Work through a small dataset
Use four synthetic task times: 2, 4, 4, and 6 seconds. This tiny dataset is for arithmetic, not evidence about a real product or a basis for confident inference.
The mean is (2 + 4 + 4 + 6) / 4 = 4 seconds. Deviations from the mean are −2, 0, 0, and 2 seconds. Their squares are 4, 0, 0, and 4 seconds squared, totaling 8.
Treating these observations as a sample, the usual sample variance is 8 / (4 − 1) = 8/3, or about 2.667 seconds squared. The sample standard deviation is √(8/3), or about 1.633 seconds.
This is a useful check on a report. If someone describes the same sample's variance as 1.633, they have probably substituted the standard deviation. If the units are missing, the mistake is much harder to spot.
Choose sample or population formulas deliberately
If those four observations constitute the entire finite population you want to describe, population variance divides by 4: 8/4 = 2 seconds squared. Population standard deviation is √2, or about 1.414 seconds.
The population and sample distinction depends on what you are estimating. Having every recorded event from an experiment does not necessarily make those events the full population of future users or future conditions you care about.
The n − 1 denominator makes the usual sample variance an unbiased estimator of population variance under independent, identically distributed sampling with finite variance. It does not make the square root exactly unbiased for population standard deviation. Nor does it correct biased sampling or dependence between observations.
Verify the calculation with explicit function names
Python's statistics functions distinguish sample calculations from population calculations. With Python 3 installed, this standalone example requires no external packages or data:
The first line of output is 2.667 1.633; the second is 2 1.414. The different denominators explain the difference. Before comparing statistics from two tools, check their sample/population defaults and handling of missing values.
Find the noise you can reduce
Explore practical variance reduction methods, including metric design and CUPED, and the conditions that make each approach useful.
Read the Variance Reduction Guide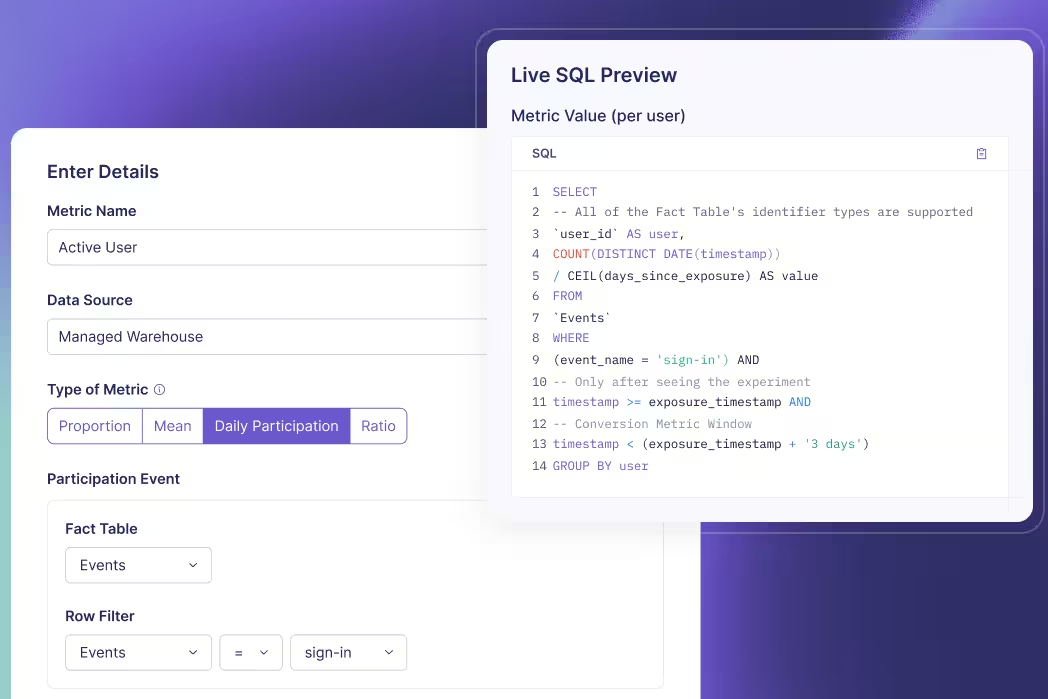
Use standard errors for experiment uncertainty
Distinguish users from estimated means
Standard deviation describes how users' outcomes vary. Standard error describes how an estimator would vary across repeated samples. For an independent sample, the estimated standard error of its mean is s / √n.
Suppose a user-level task-time metric has a sample standard deviation of 20 seconds among 10,000 independent users. The estimated standard error of the mean is 20/√10,000 = 0.2 seconds. Large differences between users coexist with a much smaller uncertainty around their average.
Collecting four times as many independent users would halve this standard error if the outcome variance stayed similar. It would not mechanically halve user-level standard deviation. The individual experience remains variable even as the estimated mean becomes more precise.
Combine arm variances before taking the square root
For independent treatment and control groups, a simple unadjusted difference in means has estimated variance s²ₜ/nₜ + s²꜀/n꜀. Its standard error is the square root of that sum. You do not add the two arm standard deviations and call the result the experiment's uncertainty.
Take a separate synthetic summary with 10,000 independent users in each arm and a 20-second standard deviation in both. The variance of the estimated difference is 400/10,000 + 400/10,000 = 0.08 seconds squared. Its standard error is √0.08, about 0.283 seconds.
If the observed treatment-minus-control difference is −1 second, an illustrative large-sample, unadjusted 95% normal interval is −1 ± 1.96 × 0.283, approximately −1.554 to −0.446 seconds. Negative values mean faster completion under this metric definition.
This example assumes independent groups and an appropriate large-sample approximation. It is not the exact output of GrowthBook's relative-lift, sequential, covariate-adjusted, or ratio-metric methods. GrowthBook's statistical details describe how the platform estimates effects and their uncertainty.
Avoid interpreting intervals as outcome ranges
That interval concerns the mean treatment effect. It does not say that 95% of individual users improved by between 0.446 and 1.554 seconds. An individual user's causal effect is a different quantity, and the experiment does not observe both potential outcomes for the same person.
Likewise, mean ± one standard deviation is not a universal statement about where 68% of users fall. That familiar interpretation depends on an approximately normal distribution. Skewed task times or revenue can look very different.
The frequentist confidence level describes the repeated-sampling coverage of the interval procedure under its assumptions. It is not a posterior probability assigned to a fixed realized interval.
Check what your metric actually measures
Match the variance to the randomization unit
If users are randomized and each contributes many requests, request rows are not automatically independent experimental units. Treating 100 requests from one person as 100 unrelated users can make uncertainty look smaller than it should.
Define the outcome at the intended unit or use a method that accounts for clustering. GrowthBook's aggregate data requirements are relevant when supplying precomputed summaries: the sample size, sum, and dispersion must correspond to the statistic and analysis method.
Two teams can report different standard deviations without either making an arithmetic mistake. One may summarize per-request latency while the other summarizes each user's average latency. They are describing different outcome distributions. Clarify the grain before comparing their numbers.
Paired measurements need another distinction. If the same users provide before-and-after outcomes, the measurements within each pair can be correlated. Analyze each user's difference or use an appropriate paired method; do not apply the independent-arm formula automatically. The paired-means framework treats those differences as the observations of interest. Pairing also does not remove time trends or establish causality by itself; the design still determines which comparison is defensible.
Inspect tails instead of deleting them casually
Large observations influence both variance and standard deviation. A few unusually long tasks can dominate a time metric; a few large purchasers can dominate revenue. Determine whether those values reflect valid behavior, instrumentation defects, retries, or unit errors.
A valid expensive user is not automatically an outlier to discard. Removing high values after seeing an experiment result can change the estimand and introduce selective analysis. Decide justified exclusions or transformations before interpreting the test.
Report complementary summaries when they answer useful questions: a histogram, median, or a relevant tail percentile can show what a single spread measure hides. Those summaries do not replace the mean effect if the mean remains the decision metric.
Keep units consistent across pipelines
Converting seconds to milliseconds multiplies every value by 1,000. Standard deviation also multiplies by 1,000, but variance multiplies by 1,000,000. A dramatic numerical variance increase can therefore be a unit conversion rather than a product regression.
For the four-value example, sample standard deviation becomes approximately 1,633 milliseconds and variance becomes approximately 2,666,667 milliseconds squared. The underlying task times have not changed. Store units with metric definitions and inspect them when comparing dashboards.
A lower variance caused solely by rescaling a metric does not create more statistical information. The effect size rescales too. Separate a numerical change in units from an actual improvement in the precision of your estimate.
Also avoid averaging standard deviations from daily reports and labeling the result a weekly standard deviation. The complete-period spread depends on both variation within days and differences between daily means. Keep the underlying observations or sufficient summaries that support the intended calculation. A simple average of displayed daily values generally loses information needed to reconstruct the full distribution.
Turn spread into a better testing plan
Define the outcome before planning the sample
Start with the metric definition: population, identity, aggregation, window, units, exclusions, and desired effect. Estimate variability from representative historical data at that same grain.
Historical variance is an input, not a guarantee. New traffic, a different user mix, or a changed measurement window can alter it. Explore plausible variance and effect-size assumptions rather than treating one historical number as exact.
Keep the two arm variances separate when appropriate. A treatment can change variability as well as its mean. The simple equal-standard-deviation illustration above is a teaching assumption, not a requirement that production groups have identical spread.
Reduce estimation noise without hiding behavior
CUPED and post-stratification use suitable pre-experiment information and covariates to improve effect estimation. CUPED stands for Controlled-experiment Using Pre-Experiment Data. Its value depends on useful predictive information and a valid implementation.
Adjustment can reduce uncertainty in the treatment effect without making real users' outcomes less variable. That distinction prevents a reporting error: a narrower adjusted interval is not evidence that customers now experience a more consistent product.
Also separate missing data from genuine zeros. A user with no purchase may correctly contribute zero revenue; a missing instrumentation event might represent an unknown outcome. Treating both identically can distort the mean and its variance before any statistical engine sees the data.
Report the right quantity for the decision
| Reader's question | Useful quantity |
|---|---|
| How much do individual outcomes differ? | Standard deviation, with distribution context |
| What enters this uncertainty calculation? | Variance at the correct analysis unit |
| How precisely is the effect estimated? | Standard error and an appropriate interval |
| Is the measured difference worth acting on? | Effect size, uncertainty, guardrails, and decision context |
For a clear experiment readout, show the metric's unit and analysis grain, the estimated effect, and its appropriate uncertainty interval. Add outcome spread when it helps readers understand the population or diagnose a noisy metric.
GrowthBook's experimentation platform brings defined metrics and statistical analysis together. A trustworthy interpretation still starts with your measurement choices: describe spread with standard deviation, calculate with variance where required, and judge precision using the estimator's uncertainty.
Build a clearer experiment readout
Connect your metrics to GrowthBook and evaluate effects with the analysis method and measurement definitions your team has chosen.
Get Started With Experimentation
Catching 80 defects means little until you know how many defects existed.
Suppose a detector flags 125 suspicious software changes. Engineers inspect them and confirm 80 real defects. That tells you something about alert quality, but it does not tell you how many defects the detector missed. To calculate true positive rate, you need the actual positives outside the alert queue too.
True positive rate, or TPR, measures the share of actual positive cases that a system correctly identifies. It is also called recall or sensitivity. The formula is TP / (TP + FN), where TP means true positives and FN means false negatives.
The arithmetic is simple. Choosing the right population, labels, threshold, and denominator is the difficult part. This guide works through an engineering example, distinguishes neighboring metrics, and explains what changes when the “test” is an A/B experiment rather than an item classifier.
Start with actual positives, not alerts
Define the positive class
“Positive” means the condition you want to detect. It does not necessarily mean a good outcome. In a defect detector, positive means a real defect. In a spam filter, it means spam. Write that definition before calculating anything.
A true positive is an item that is actually positive and predicted positive. A false negative is actually positive but predicted negative. Those two groups together form the denominator: all actual positives in the evaluation sample.
The recall definition is therefore conditional on actual class membership. TPR asks, “Among the real defects, what proportion did we catch?” It does not ask, “Among the alerts, what proportion were real?”
Fix the unit and observation window
Choose a consistent evaluation unit. A code change, an individual finding, and a repository are different units. If one change generates 12 duplicate alerts, counting alerts in the numerator and changes in the denominator produces a meaningless rate.
For the example, each unit is one code change, evaluated once by one fixed detector version at one fixed threshold. An independent review process eventually labels each change as defective or not defective. The observation window is long enough for those labels to mature.
This resembles the discipline needed when defining experiment metrics: the event, identity, time window, and denominator must describe the same question. A correct formula applied to incompatible counts still gives the wrong answer.
Calculate TPR from the confusion matrix
Put every evaluated item in one cell
Consider an original synthetic evaluation of 1,000 code changes. Reviewers establish that 100 contain a defect and 900 do not. The detector catches 80 defects, misses 20, and incorrectly flags 45 nondefective changes.
| Actual label | Predicted positive | Predicted negative | Total |
|---|---|---|---|
| Defective | 80 true positives | 20 false negatives | 100 |
| Not defective | 45 false positives | 855 true negatives | 900 |
| Total | 125 | 875 | 1,000 |
Read the labels rather than relying on cell position. Libraries and reports can arrange axes differently. The scikit-learn confusion matrix convention uses actual classes on rows and predicted classes on columns, with class order also affecting where each value appears.
Check the totals before calculating rates. The four cells sum to 1,000. True positives plus false negatives sum to 100 actual defects. Predicted positives total 125, which is a different denominator.
Divide detected positives by all actual positives
The calculation is:
TPR = TP / (TP + FN) = 80 / (80 + 20) = 80 / 100 = 0.80 = 80%.
Interpret it in words: the detector caught 80% of the actual defects in this evaluation sample. It missed 20%, so the false negative rate is 20%. For a binary task with complete labels, TPR and false negative rate sum to 100%.
Do not divide 80 by 1,000. That would measure true positives as a share of all evaluated changes, not recall. Do not divide 80 by 125 either. That is precision, which answers the alert-quality question.
The result describes this sample and threshold. It does not establish that every future workload will have the same recall, or that all defect categories are equally detectable. Keep the counts beside the percentage so readers can see the support behind it.
Handle zero positive support explicitly
If the sample contains no actual defects, TP + FN equals zero. Sample TPR is undefined. Returning 0% would imply the detector missed known defects; returning 100% would imply it successfully found them. Neither interpretation is supported.
Software libraries need a practical zero-division convention. That convention can return a placeholder or warning, but it does not create evidence. Report “TPR unavailable: zero actual positives” and preserve the support count. A pipeline can then distinguish an unevaluable slice from measured poor performance.
Check the experiment error risks
See how power, repeated checks, and multiple comparisons affect the reliability of experimental decisions beyond a single classifier score.
Read the False Positives GuideCompare TPR with precision and false positives
Keep the denominators visible
For the same 1,000 changes, the other common metrics tell different stories:
| Metric | Calculation | Result |
|---|---|---|
| True positive rate / recall | 80 / 100 actual positives | 80% |
| Precision | 80 / 125 predicted positives | 64% |
| False positive rate | 45 / 900 actual negatives | 5% |
| Specificity | 855 / 900 actual negatives | 95% |
| Accuracy | (80 + 855) / 1,000 changes | 93.5% |
The classification metric definitions differ because they condition on different populations. Here, 36% of alerts are false, but the false positive rate is 5%. Calling both numbers “the false positive rate” hides the operational distinction.
Accuracy can also look reassuring in an imbalanced population. A detector that labels all 1,000 changes nondefective would be 90% accurate while detecting none of the 100 defects. TPR exposes that failure, though it still needs the false-positive side of the picture.
Choose a threshold for the decision
Suppose a stricter threshold, evaluated on the same labeled changes, catches 60 defects and incorrectly flags 10 nondefective changes. Its TPR is 60%, its precision is about 85.7%, and its false positive rate is about 1.11%.
This threshold reduces the review queue from 125 changes to 70. It also misses 40 defects instead of 20. Whether that tradeoff is acceptable depends on the consequences of a missed defect, the review team's capacity, and what action follows an alert.
A ROC curve plots TPR against false positive rate across thresholds. It helps compare operating points. It does not pick the operational threshold for you, and an area-under-curve summary does not specify the queue size at the threshold you intend to deploy.
If you tune thresholds using the same labels you later report as a final evaluation, the score can be optimistic. Use separate validation and held-out evaluation data, or another defensible evaluation design, and freeze the decision rule before the final assessment.
Specify the action at each threshold too. A low-confidence finding might create a suggestion, while a high-confidence finding might block a merge. Those are different interventions with different error costs. One aggregate recall figure should not imply that every detected item received the same treatment.
Make sure the labels can support the claim
Audit predicted negatives too
If engineers review only alerts, you can estimate precision within the reviewed alert population. You cannot directly count missed defects among unreviewed negatives. Assuming those changes are clean makes FN artificially small and TPR artificially high.
An evaluation may need independent review of a representative sample of predicted negatives, delayed incident labels, or a curated benchmark with known defects. Each approach has limits. Incident labels miss undetected failures; curated examples can differ from ordinary production work.
If the evaluation oversamples suspicious changes or certain repositories, report that design. Use appropriate weighting when estimating performance for the real workload. A simple unweighted confusion matrix describes the sampled dataset, which may not represent the deployed population.
Preserve uncertainty and segment support
An 80% estimate based on 4 detected defects out of 5 is much less precise than one based on 800 out of 1,000. The important sample size for recall is the count of actual positives, not just the total number of changes evaluated.
Report positive support by important slices, such as language, defect category, or repository type. A high pooled TPR can hide weak performance on a rare but expensive failure mode. At the same time, avoid declaring tiny slices definitively better or worse from a few examples.
Counts alone do not make observations independent. Many similar changes from one repository can share a common pattern. Use uncertainty methods that fit the evaluation design rather than assuming every row is an unrelated trial.
Separate label delay from label absence
A recently deployed change might appear nondefective because nobody has had time to find the bug. Treating it as a confirmed negative gives the newest cohort a different labeling standard from older cohorts.
Define when an item becomes eligible for evaluation and track unresolved labels separately. Keep model version, threshold, label version, and observation dates with the result. That makes a later score change interpretable: you can tell whether the detector changed, the workload changed, or the labels matured.
For a warehouse-native measurement workflow, these definitions belong in the underlying data model. Joining model decisions to review outcomes still requires identity and time alignment; a queryable warehouse does not automatically resolve ambiguous ground truth.
Keep comparable populations together
When comparing detector versions, evaluate them on the same held-out cases where possible. Otherwise, an apparent recall improvement could come from an easier mix of defects. Preserve a breakdown of new, removed, and unchanged cases so reviewers can see what changed between evaluations.
When combining reports, add the underlying TP and FN counts for nonoverlapping, consistently defined populations, then calculate the pooled rate. An unweighted average of repository percentages answers a different question because it gives a tiny repository the same influence as a large one. Either summary can be useful, but label the weighting explicitly.
If the same change appears in several reports, deduplicate or model that repeated observation before pooling. Repeated scans do not create additional independent defects. Keep an audit trail from the final counts back to the evaluated item identifiers so a suspicious rate can be investigated.
Connect detection quality to product decisions
Distinguish classifier recall from statistical power
In hypothesis testing, statistical power is the probability that a testing procedure rejects the null when a specified alternative is true. It is a repeated-test detection probability, depending on assumptions such as effect size, variance, sample size, and decision rule.
That is related to the idea of detecting a real signal, but it is not the same dataset as a labeled-item confusion matrix. In an ordinary A/B program, you do not observe the true causal effect of every experiment with certainty. Dividing declared winners by all experiments does not reveal a ground-truth TPR.
Power planning asks how often your procedure would detect a particular real effect under its assumptions. A classifier evaluation asks how many labeled positives were detected in the evaluated sample. Keep those questions separate when discussing GrowthBook's statistical methods.
Evaluate the intervention as well as the detector
An improved offline detector can still create a worse product workflow. More alerts might overwhelm engineers, delay releases, or catch defects too late to matter. Conversely, a modest recall change might be valuable if it catches the failures with the highest operational cost.
When appropriate, use randomized experiments to evaluate the downstream intervention: which review experience helps teams resolve defects, with what delay and cost? Keep detector recall, review workload, and product outcomes as separate measures.
GrowthBook's experimentation platform can analyze defined outcomes from such tests. Your team supplies reliable assignment, exposure, labels, and metric definitions. Neither a high TPR nor a significant product result eliminates the need to inspect the other evidence.
Use a repeatable reporting checklist
Before sharing a TPR number, state the positive class, evaluation unit, detector version, threshold, and label process. Show TP and FN beside the rate. Include precision or false positive rate so readers can assess the workload created by detection.
Then ask whether predicted negatives were evaluated, whether labels had time to mature, and whether the sample reflects the population where you will act. Mark zero-support slices unavailable and explain material gaps in coverage.
The useful result is a statement someone can audit: “At this threshold, the detector found 80 of 100 labeled defects in these 1,000 evaluated changes, while producing 45 false alerts.” That is a clearer basis for a decision than “our model is 80% accurate.”
Measure what the change delivers
Connect your data and defined metrics to GrowthBook to evaluate how a product or workflow change affects the outcomes your team cares about.
Start Measuring With GrowthBookReady to ship faster?
No credit card required. Start with feature flags, experimentation, and product analytics—free.