

Simpler, faster SQL queries


Experiment analysis queries in GrowthBook now run up to 2X faster!
This performance improvement is due to 3 main changes.
One dimension and variation per user
When users are exposed to multiple variations in an experiment (due to bugs) or have multiple dimension values (e.g., by using multiple devices), we have to figure out what to do.
The previous behavior in GrowthBook was both counterintuitive and bad for performance, so fixing this was a win-win.
Now, when a user is exposed to multiple variations, we remove them completely from the analysis. We also keep track of how many users fall into this bucket. If it's above a critical threshold (1% of experiment users), we show a big warning on the experiment results. This is a sign that something went seriously wrong in your experiment.
When a user has multiple dimension values, we now pick the earliest dimension they had when viewing the experiment. So if someone first viewed an experiment on a phone and then later on a desktop, their "device" dimension will be set to "phone".
You can read more about how we treat dimensions in our documentation here.
New attribution models
Back in GrowthBook 1.7, we introduced a new attribution model called "Multiple Exposures". This model was great for increasing the number of conversions included in the analysis, but it had one main drawback - performance.
We are replacing this model with a new one - "Experiment Duration". This new model also increases the number of conversions in the analysis but in a much more performant way.
The following figure is another representation of the different attribution models, and which data they use, for an example metric with a 6-hour conversion window and 0 conversion delay.

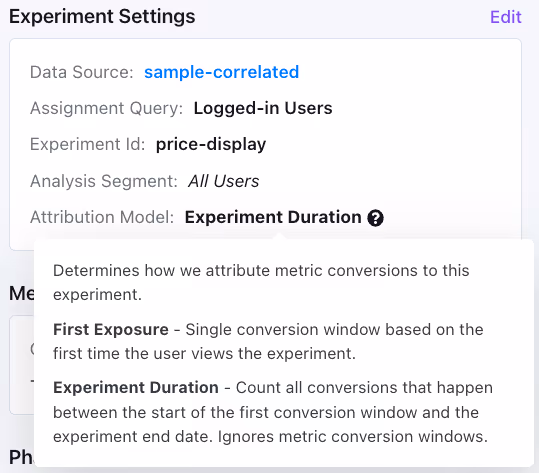
How can I use the new model?
You can change the model on a per-experiment basis under the Experiment Settings.
You can also choose the default attribution model for new experiments under your general organization settings.
Removing OINs and GROUP BYs
Due to the above changes, we eliminated multiple JOINs and GROUP BYs, resulting in significant performance improvements, especially for ratio metrics.
To give you a sense of how much we were able to simplify, some of our test queries went from 130 lines of SQL down to only 80!
Thanks to our extensive testing infrastructure, we were able to safely make these big sweeping changes to our SQL structure while ensuring the results remain accurate.
This is just the beginning, and we have big plans for further performance improvements. Stay tuned for more!
Related articles


Ready to ship faster?
No credit card required. Start with feature flags, experimentation, and product analytics — free.

