

PayPal's $180 million experimentation win
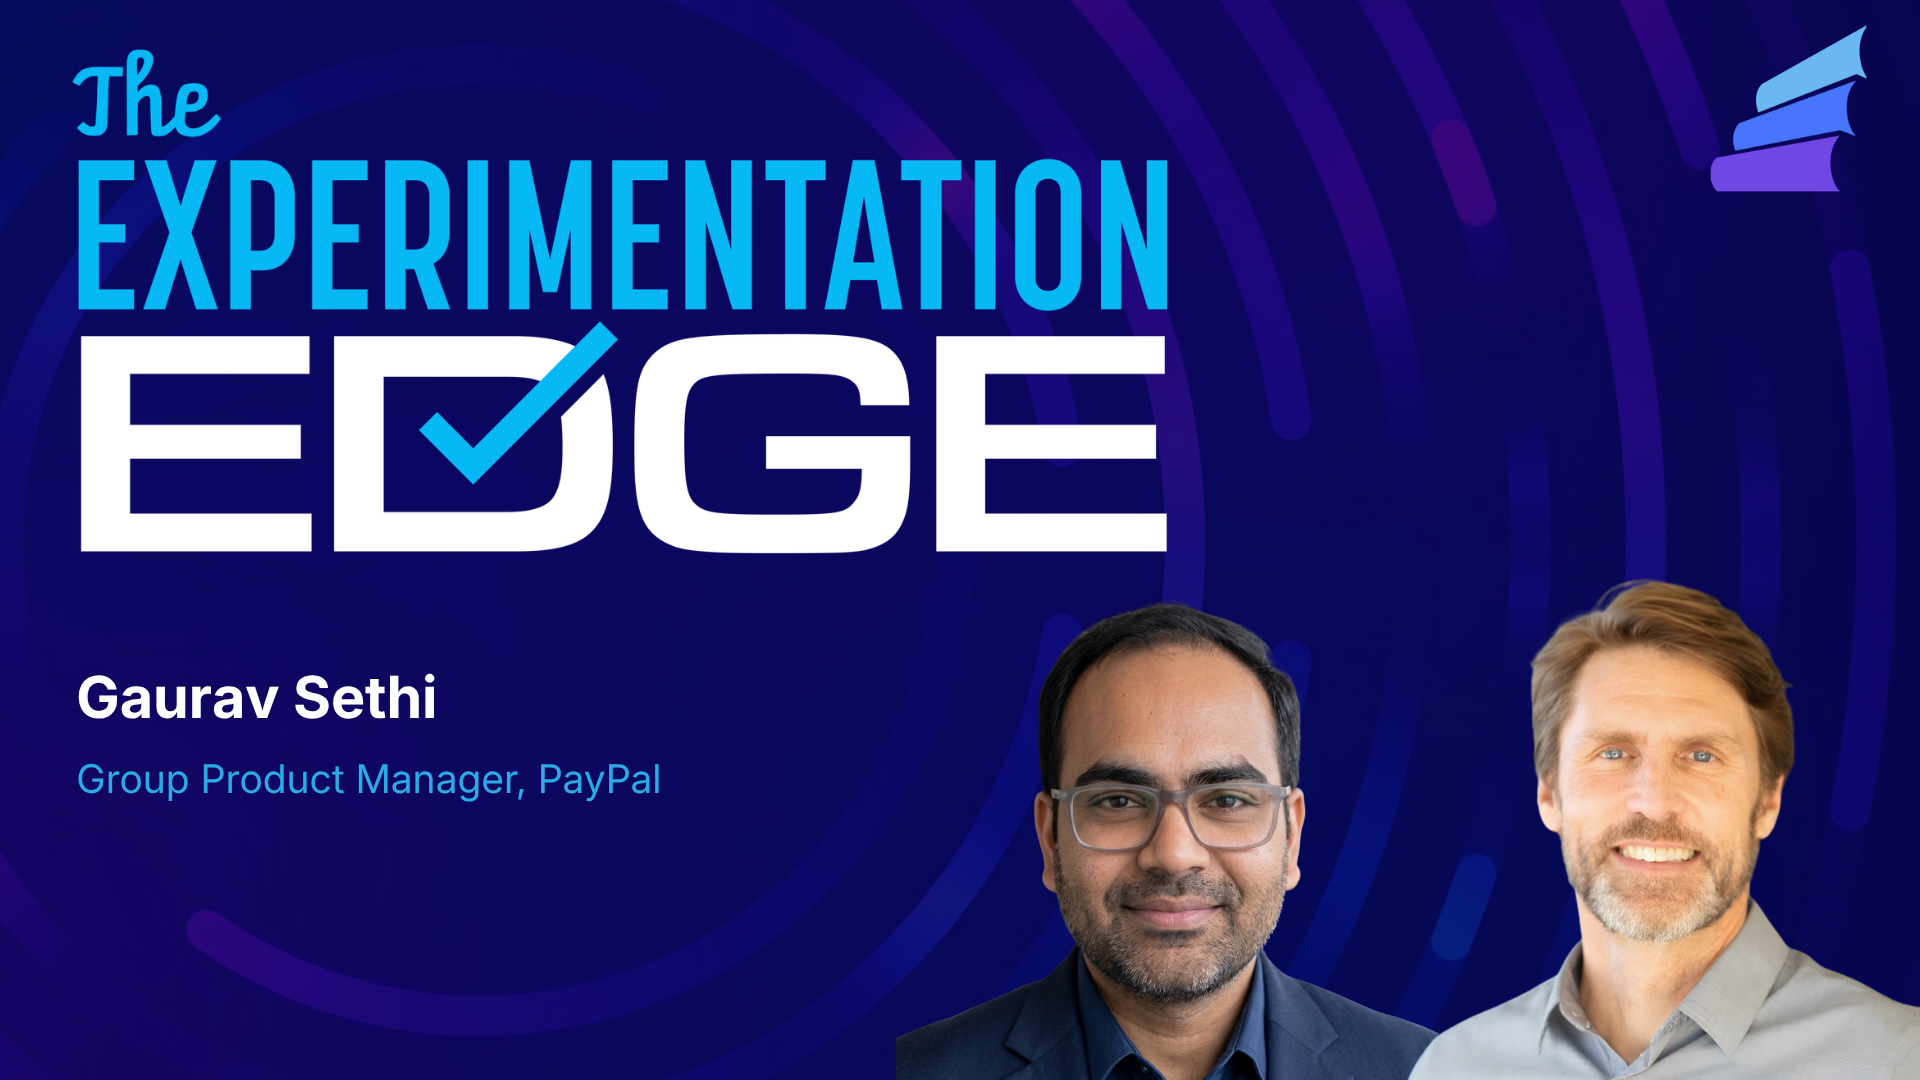
Show: The Experimentation Edge with Ashley Stirrup. Guest: Gaurav Sethi, Group Product Manager, PayPal. Publishing: September 30, 2026. Length: 00:31:21
When Gaurav Sethi inherited PayPal's experimentation team in early 2023, he was handed a number that looked like a trophy. The data scientists were reporting a win rate of 55% to 60%. More than half of everything the company tested was apparently a winner.
The industry average is 11% to 14%.
"So 55% win rate was something that did not really sit well with me," Gaurav said.
Two years later the same program ran 2,587 experiments in a single year and produced roughly $180 million in measured impact. The distance between those two facts is the whole story, and it is not a story about having better ideas. It is a story about making the results worth believing, and then making them arrive fast enough to act on.
On The Experimentation Edge, Ashley Stirrup sat down with Gaurav to walk through the platform his team built and the decisions that turned a program nobody could fully defend into one that could put a dollar figure next to every test.
The fastest way to grow an experimentation program is to make its output credible.
A win rate that was too good to be true
PayPal runs a homegrown platform called Elmo, short for Experiment Lifecycle Management and Optimization. When Gaurav took it over it was carrying 700 to 800 experiments a year and two structural problems. Insights could take up to four weeks, because the data collection underneath was broken badly enough that data scientists and data engineers had to clean it by hand before anyone could read a result. And there were no financial metrics attached to an experiment at all. Nobody could marry transactional data to behavioral data, so nobody could say what a test was worth.
The inflated win rate turned out to be a symptom of the first problem.
Most experiments were using default tracking, which meant assignment data. Gaurav explained the distinction plainly. You go to paypal.com, and the instant you land you are assigned to control or treatment. That is intent. It records that the system planned to show you something. It does not record that you saw it. You may never have scrolled to the section under test. You may never have opened the mobile page where it was running.
Measured that way, the experiments were carrying 25% to 30% dilution.
Ashley pushed on the mechanism: why would dilution produce more wins rather than fewer? Because diluted data reaches significance faster.
"If the data is diluted, then you will reach stat sig very quickly, even if some of the users did not even participate in that experiment," Gaurav said. The sample fills up with people the test never touched, the confidence interval tightens, and a flat result gets declared a winner. The 55% was not measuring wins. It was measuring noise with enough volume behind it to look like signal.
A win rate far above the industry average is a data question before it is a success story.
The exposure event that fixed the data
The fix had a name and a cost. Gaurav introduced an exposure event: as close as you are to rendering the experiment to a user, fire an event that says from this moment forward, this person is in the test. Do not log anything when the page loads.
Technically it is a small idea. Organizationally it was the hardest thing he did.
PayPal's UI is largely server driven, so the server decides what gets rendered and the client has to confirm what was actually shown. That connective tissue did not exist, and building it meant asking three different groups to absorb work they had not planned for. Data scientists had already built dashboards on assignment data. Engineers liked assignment precisely because the platform did the logging and they did not have to touch their features. Product managers were the hardest sell, because instrumenting exposure adds time to a launch, and shipping the feature is what they are measured on.
The same alignment problem showed up in instrumentation more broadly. Checkout tracked its own metrics. The digital wallet tracked different ones. Every team had internal metrics their own leaders cared about, and none of the specifications matched. Since the platform was trying to automate analysis end to end, every mismatched specification meant a pipeline that could not run without a human in it, which is exactly why insights took four weeks.
Then there was the transactional side. PayPal had acquired roughly ten brands, each arriving with its own data structures, and there was no canonical metric definition anywhere. Gaurav searched the catalog for total payment volume and found eleven different versions of it.
His team normalized the structures, settled the definitions, aligned transactional grain with customer grain and behavioral grain, and put the whole thing on a schedule mapped to exposure events. That is what made financial impact computable per experiment. He had an advantage going in: before taking the experimentation team he had led PayPal's data organization, so he already knew where everything lived.
By the time he left, experiment readouts were available within 24 hours.
Standardizing the measurement is what makes automation possible, and automation is what makes speed possible.
700 days, or 51
The best illustration of what the rebuilt platform bought them was a carousel.
PayPal's marketing team wanted to test the home page carousel with new images and new copy, which produced six or seven variants. The projection for reaching significance across all of them as a standard A/B test came back at about 700 days.
Ashley's reaction was the obvious one: PayPal.com gets enormous traffic, so how is that possible? Gaurav's answer is worth sitting with. Most PayPal volume arrives through pay with PayPal, which drops the user directly onto a login page. They never see the home page or the hero banner. More users had moved to mobile. The traffic actually available to that test was a small fraction of what the brand implies.
So they ran a multi armed bandit.
"It's an A/B experiment on steroids," Gaurav said. When an arm underperforms, the bandit pulls traffic off it and redistributes it to the rest, exploring and exploiting at once instead of spending equal sample on options already known to be losing.
Within roughly 40 days, two variants had separated clearly from control and the others. His team eliminated the rest, ran a straight head to head A/B test between the final two, and by day 51 had a significant result. The winner delivered almost five basis points of improvement.
When the math says a test is impossible, that is a signal about the method, not the idea.
Every result is a return
The $180 million number that came out of 2025 has two halves, and Gaurav is deliberate about both.
One half is revenue from winning experiments. The other half is cost avoidance: the features that tested badly and never shipped, along with the build time, maintenance, rollbacks and customer damage that never happened.
"There are no winning or losing experiments," he said. A winner gives you direct revenue or a direct move in your primary KPI. A loser tells you not to ship something that was never going to scale. One is impact, one is avoided cost, and both belong in the number you report upward.
Believing that changes how experiments get designed. Gaurav's guidelines for product managers are unglamorous. Write a hypothesis that states something testable, not a one liner about turning a button red to see if people click more. Design the target segment deliberately and check it for bias. Name a primary KPI before launch, with a secondary and a guardrail where the test warrants it, so the criteria cannot be relitigated once results are in.
And the platform is only half the job. Six good engineers can build a decent experimentation platform in six months, Gaurav said. The effort that actually consumed his time was education: biweekly sessions that regularly drew more than 100 attendees, standing office hours, and an LMS course so a new product manager or engineer could learn the basics on day one.
What comes next: Experimenting on AI agents
Asked where experimentation goes from here, Gaurav split it in two.
The first direction is AI applied to experimentation: agents that summarize a readout so a product manager does not wait on a data scientist, hypothesis checks against the existing repository to catch tests that have already been run, recommendations on primary metrics and target segments.
The second is harder. Traditional A/B testing assumes determinism. The button rendered or it did not, and the user clicked or did not. Agents offer none of that. An agent might finish the job and burn $100 of tokens doing it. It might finish the job using the wrong tool. It might not behave the same way twice. Measuring one means asking several questions at once: did it complete the task, does it do so consistently, did it read the user's intent, and what did it cost.
Ashley agreed that this is where the discipline has to level up, since evaluations can do quality assurance but cannot tell you the effect on a human user. Gaurav's comparison: measuring ROI on an AI feature is about to become what web analytics was in 2010.
His default recommendation is the one experimentation people will recognize. Every agent that goes to production should go behind a feature flag, because an agent with broad data access and no governance is a risk the business has not priced.
The moves
- Track exposure, not assignment. Fire the event as close to render as you can, and treat any win rate far above 11% to 14% as a data question first.
- Standardize instrumentation and metric definitions so the analysis pipeline can run without a human in it. That is what takes readouts from four weeks to 24 hours.
- Match the method to the traffic you actually have. A bandit turned a 700 day test into a 51 day answer.
- Count cost avoidance as impact. Half of $180 million came from features that never shipped.
- Budget more for education than for the platform. The build is six months. The teaching never ends.
- Put every production agent behind a feature flag.
Full conversation with Gaurav Sethi, Group Product Manager at PayPal, on The Experimentation Edge.
Related articles



Ready to ship faster?
No credit card required. Start with feature flags, experimentation, and product analytics — free.

