

Beyond evals: A/B test AI features with LLM traces and business metrics
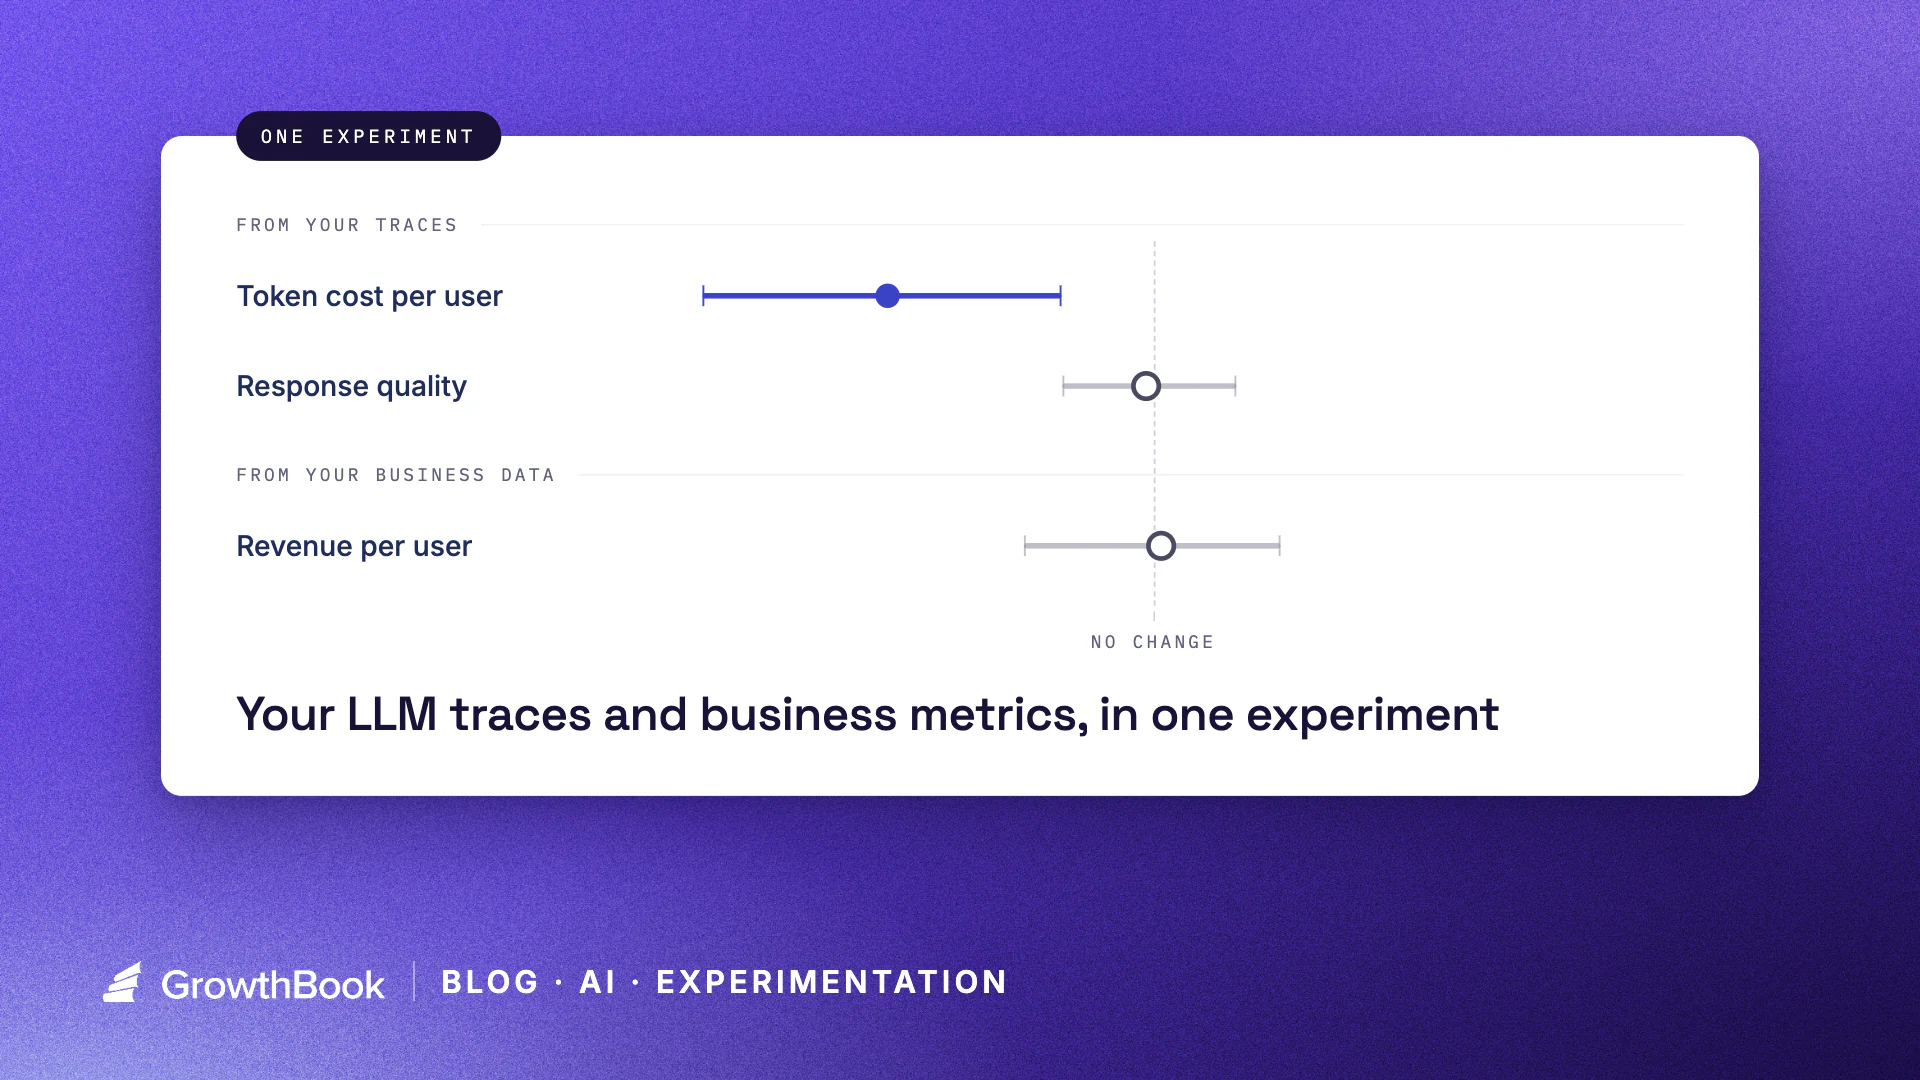
Every new AI model brings its own response style, its own strengths, its own sharp edges when it meets your application.
You’ve probably written offline eval specs to capture the most important response qualities for your users. As you consider switching from Sonnet 5 to Sonnet 5.5 or updating your prompts to work with the new models (or your changing users), you run these evals to make sure the new model's sharp edges don't show up as regressions in quality or performance.
Until you ship to prod, though, you don’t really know how your customers, with all their edge cases, will respond. Or what impact your changes will have on your revenue, daily active users, and token costs.
Before your release to everyone, everywhere, all at once, you can figure out that potential cost. You can run an online, controlled experiment, using the trace data you already collect.
GrowthBook can now use your LLM trace data as experiment metrics, so you can connect your changes with your observed LLM behaviors and the business metrics that matter.
Experiments are stronger with traces and business metrics
Trace data on its own is valuable, whether it’s observed data like latency or cost, or data generated through offline evals or LLM-as-a-judge setups. Experiments that leverage just trace data can help you determine, with experimental validity rather than gut feel or quick comparison, which model, prompt, or parameter configuration actually improves your scores without degrading other metrics.
But experiments on your AI features are stronger when tied in with business data. GrowthBook analyzes your data where it lives. When your trace data rests in the same warehouse as your product and business data, a single experiment can measure both: token cost, latency, tool calls alongside revenue, clicks, and daily active users. Your trace metrics could be goals or guardrails or both, and integrating them with other experiment metrics enables you to answer more complex questions. You can answer not just “which prompt scores better,” but “which prompt leads to higher feature adoption rates and revenue growth.”
What you can A/B test: Prompts, models, and agents
Some changes affect just what can be measured in your traces. Others matter most if they affect your conversions, revenue, or customer satisfaction. GrowthBook handles both.
When the answer is in your traces and evals
Managing costs without sacrificing quality: Shift your summarization feature to a cheaper model to bring down LLM costs per user, and switch only if the eval score for summary quality and error rate stay steady or improve.
Improve prompt quality to improve helpfulness: Rewrite the system prompt for your support assistant, and test whether its helpfulness score improves. Guard against token usage ballooning and latency increases, since more thorough answers could easily get longer and slower.
Dynamically adjust traffic to multiple prompts: Suppose you have several prompts that all seem viable. You can run a multi-armed bandit with helpfulness (as defined by an LLM judge) as your primary metric, and GrowthBook will allocate more users to the most helpful prompt as evidence comes in.
When the answer rests in your business
Ensure that larger models actually sell more: Using a larger model for your shopping assistant costs more for every request and response. Does it actually sell more? Test with revenue per user as your primary goal, and evaluate revenue lift alongside token spend.
Find sharp edges before your entire user base does: Release your new onboarding agent to internal users first, then ramp up from 2 to 5 to higher percentages of users. Measure their activation or retention rate after a set period, like 7 days, with error rates and latency as guardrail metrics. If your agent negatively impacts these metrics, turn it off via flag.
Turn LLM traces into experiment metrics
Here’s how a single trace tag turns your observability data into experiment data:
When someone runs an experiment, GrowthBook decides which version of a model, prompt, or parameter each user should see, then tags that user’s trace with the assignment. Your tracing tool, like Langfuse or Arize Phoenix, records that tag right alongside the normal trace data it already collects, such as latency, cost, and errors.
GrowthBook then reads those tagged traces back out of your tracing tool and groups them by which version each user saw. That lets it compare how each version performed on the metrics you care about, so you can see which one actually wins before rolling it out to everyone.
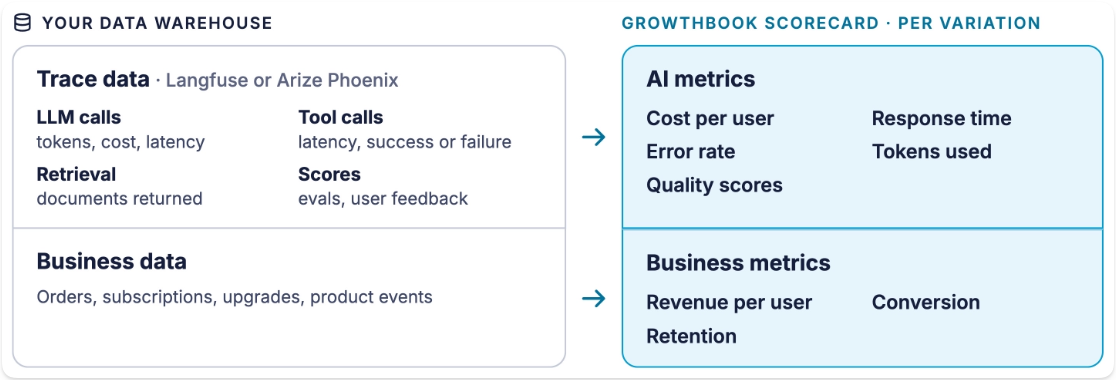
Langfuse and Arize Phoenix are our first two integrations. More are on the way.
Setting up an experiment with trace data
1. Tag each trace with the version the user saw. The GrowthBook JavaScript SDK 1.8 includes a tracing plugin that records each assignment as a tag, such as gb.exp:support-model=small. Pass the tags to your tracing SDK at the start of each request. With Python and other SDKs, you add the tag yourself.
import { GrowthBook } from '@growthbook/growthbook';
import { tracingPlugin, getTracingTags } from '@growthbook/growthbook/plugins';
import { context, getTracer, setTags, setUser } from '@arizeai/phoenix-otel';

const gb = new GrowthBook({
  clientKey: 'sdk-abc123',
  attributes: { user_id: userId },
  plugins: [tracingPlugin()],
});
await gb.init();

const model = gb.getFeatureValue('support-model', 'large');

// Put the user and the experiment tags on the trace, then start it
const ctx = setTags(setUser(context.active(), { userId }), getTracingTags(gb));
await context.with(ctx, () =>
  getTracer('support-bot').startActiveSpan('support-reply', async (span) => {
    await answerQuestion(model);
    span.end();
  }),
);
2. Connect GrowthBook to your trace data. GrowthBook sets up six metrics for you: LLM cost per user, p95 LLM latency, LLM error rate, tokens per LLM call, LLM calls per user, and traces per user. Add metrics for the eval scores and user feedback you already record.
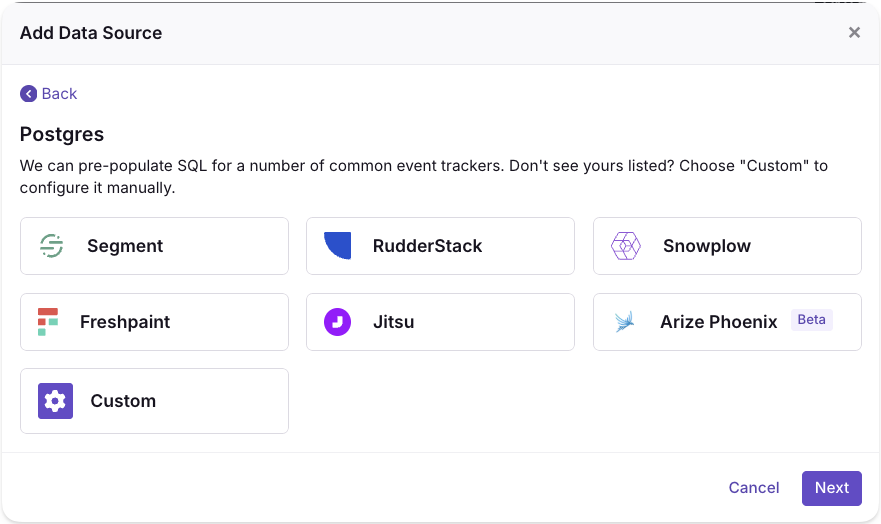
3. Run the experiment. Choose who's included, how much traffic each version gets, and your goal and guardrail metrics. You can assign versions per user, per session, or per request. Frequentist or Bayesian statistics tell you when a difference is real.
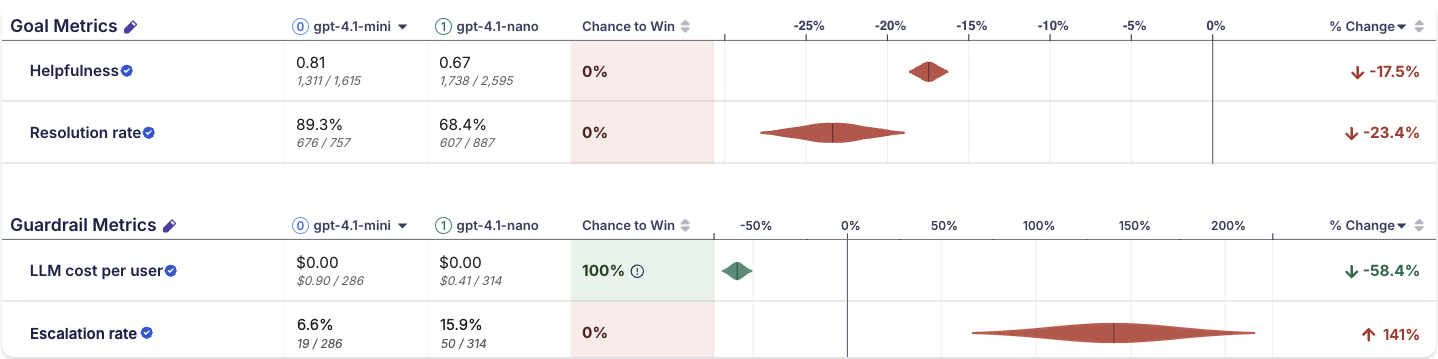
4. Analyze the results. GrowthBook shows how each version performed on every metric and whether the difference is real. Check your goal metric first, then your guardrails: a cheaper model that hurts quality isn't a win. When the answer is clear, roll out the winner or roll it back, and take what you learned into the next test.
Get started with LLM experiments in GrowthBook
LLM trace experiments are available now in beta on GrowthBook Cloud for Langfuse and Arize Phoenix.
To learn more, check out our docs:
- Experimenting on LLM features: how it works, and how to plan your first test
- Setup reference for Langfuse and Arize Phoenix
Pick the model or prompt change you’ve been hesitant to ship, and test it safely with real users.
Related articles
.png)
.png)
.avif)
Ready to ship faster?
No credit card required. Start with feature flags, experimentation, and product analytics — free.

