

The Uplift Blog


GrowthBook 0.6.0 Released 🔥
Version 0.6.0 of the GrowthBook platform is out, with some cool new features!
Metric Graph Improvements
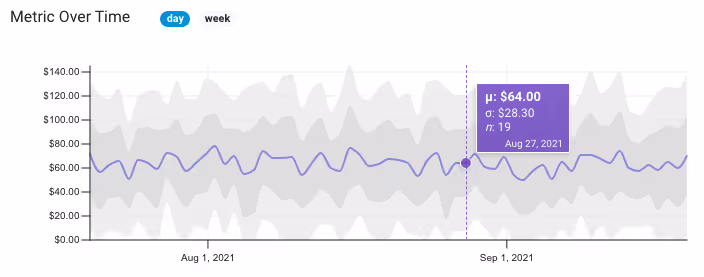
We improved our metric visualizations by adding mouse-over tooltips, one and two standard deviations (shown as shaded areas), and weekly vs daily resolution. You can also filter the graph to a specific segment of users. These changes are all meant to help you better understand your data and spot potential problems.
Projects
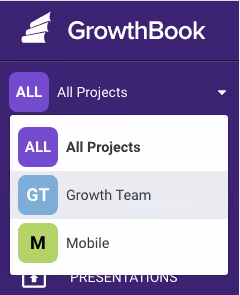
We built support for Projects to help organize your experiments and ideas. You can create a separate project per team, section of your site, or whatever makes sense for your business. Projects are created in the settings section. We have a lot more planned for this feature in the coming months, so keep an eye out!
Import/Export Configuration File

There are two ways to store settings, data sources, and metrics in GrowthBook — using the built-in database or using a configuration file. We’ve made it easier to switch between these two methods with the ability to import/export from the settings page. With this change, you can now start using GrowthBook Cloud and easily switch to a self-hosted instance later (or vice versa).
Plus numerous other enhancements and bug fixes. You can read about the full list of changes here.

GrowthBook 0.5.0 Released 🚀
We just launched version 0.5.0 with some new features we wanted to share.
🔥 Export experiment results as a Jupyter notebook!
Now you can export experiment results as a Jupyter notebook for you or your data teams to dig deeper into the experiment results. Simply define the connection information in the data source settings, then download from any experiment results. This feature is aligned with our philosophy of data transparency. GrowthBook has always shown you the raw queries we run to pull the data, and now you can see the rest of the analysis process within a notebook.
Per-metric data quality thresholds

We added support for more customizations on the experiment metrics. You can now set thresholds on the minimum number of conversions a metric needs before we reveal results, as well as the maximum percent change before we flag a result as suspicious.
SDK Dev Mode

We added support for our development mode in both the JavaScript and React SDKs. It can now also be enabled in staging builds as well as on dev machines. This lets developers easily switch between variations, which makes building and testing experiments easy.
Other improvements:
- You can now import running experiments from a data source
- The view queries button now shows the exact rows returned from the database before any post-processing
- GrowthBook stats engine now available as a standalone Python package on PyPi: gbstats
- Moved the JavaScript and React SDKs to the main GrowthBook repo
- Improved documentation around new data quality checks
Bug Fixes
- Fixed broken number inputs in forms
- Fixed error when sending invite emails to teammates
- Fixed division bug for Postgres/Redshift when metric values are integers
- Fixed problem when rendering modals inside a portal to fix z-index issues

GrowthBook 0.4.0 & August Update
August was quite a month for GrowthBook! We’re closing in on 1500 GitHub Stars, making us one of the most popular open source A/B testing platforms.

We’re also continuing to add many highly-requested features to the platform, based on your feedback in our Slack channel and on GitHub, and we just released version 0.4.0! Here are the major features of the 0.4.0 release:
Per-metric risk thresholds
There’s a trade-off between low. Now you can decide this tradeoff on a per-metric basis. So you can reduce risk and take your time with Revenue while moving quickly and accepting more risk with less important metrics.
Experiment-level dimensions
GrowthBook has always had the ability to define user-level dimensions to drill down into experiment results. But that didn’t work great for things like “browser” or “traffic source” since a user may use multiple devices or have many different sessions on your site over time.
Now GrowthBook also supports exploring risk and ending an experiment more quickly, with experiment-level dimensions for drilling down by these point-in-time attributes. All you need to do is select additional columns in your experiment query. Learn more about dimensions
Export configurations

Back in version 0.3.0, we added support for configuring self-hosted GrowthBook using a config.yml file instead of through the UI. This made it easier to version control and share configuration between environments. With the 0.4.0 release, you can now export settings that were created in the UI to a config.yml file at any time.
Detect variation ID mismatches
GrowthBook now detects and warns you when the variation IDs defined for an experiment differ from those returned from the database when fetching results. This is really useful for identifying typos and bugs in your data.
Custom rules when importing past experiments
When importing past experiments from a data source, GrowthBook applies a bunch of rules to make sure we keep the list of experiments clean. One of those rules requires a minimum runtime of 5 days in an attempt to exclude experiments that were stopped early. You can now customize this minimum length as needed.
Have ideas for other import rules or tweaks to how this feature works? Let us know!

GrowthBook 0.3.0 is Here 🚀
We just launched a new version of our open source A/B testing platform. Here are the new features and changes.
Don’t forget to follow us on Twitter and give us a star on GitHub.
Configuration by YAML files
GrowthBook now supports configuration via YAML files, which will make deployments and updates between dev and production easier and allow you to manage configuration version control.
Custom metric conversion windows
GrowthBook now lets you customize the conversion windows per metric. This is useful if you have long delays between interaction events and conversion events. It is also nice to have your conversion windows in your A/B testing results to match conversion windows used in other reports.
S3 file support

You can now store uploaded files directly in Amazon S3. There are new environment variables for self-hosted installations to connect to your S3 bucket to allow you to use S3 instead of local storage.
Customized experiment update frequency
By default, GrowthBook updates experiments every 6 hours. You can now customize this frequency in the environment variables on self-hosted installations. Of course, experiments can still always be refreshed by using the ‘update’ button.
Connect to Postgres and Redshift with SSL
Connections to Postgres and Redshift now have an option to require SSL on the connections.
Other improvements and bug fixes
- Various Clickhouse bugs — date function names, non-equi joins, json response format, stddev function 3644548 0034530
- Broken yarn install on OSX c71b86a
UnhandledPromiseRejectionWarningon failed SQL queries 83219adCannot read property '0' of nullon experiment results 0ac0fb5- Docs typo
We’d love to hear from you and get your thoughts and ideas. Drop us a line via email, Slack, or Twitter.

GrowthBook 0.2.3 Shipped 🚀
We just launched a new version of our open source A/B testing platform, GrowthBook. We are excited to share the new features and changes.
Don’t forget to follow us on Twitter and give us a star on GitHub.
PrestoDB & TrinoDB support

You can now select PrestoDB and TrinoDB amongst the ever-growing lists of supported data sources. If you have any requests, just let us know.
Improved display of ‘risk’
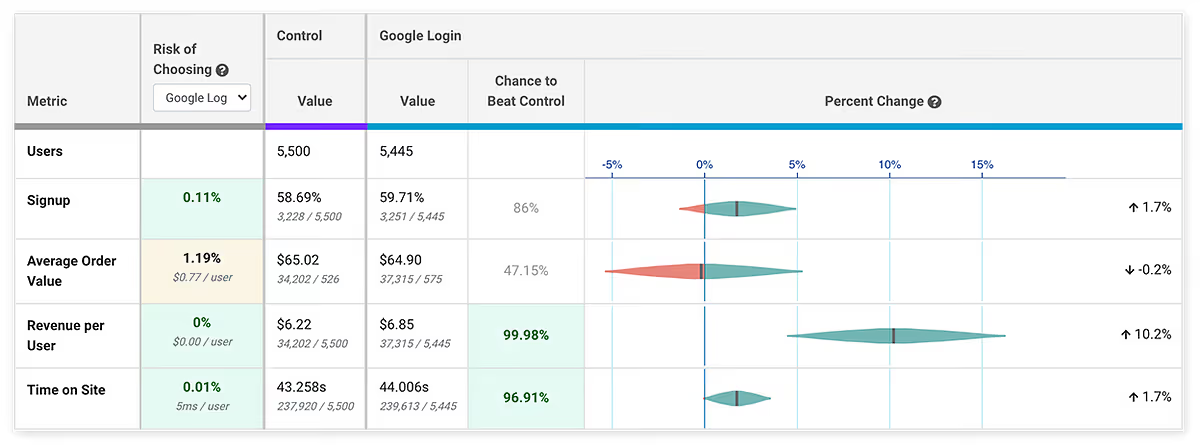
We improved the user experience for showing the Bayesian risk in results. You can learn more about the risk metric in our blog article. Risk shows you what impact choosing a variation will have on a metric, given a worst-case scenario. In the above example, if you chose the Google Login variation, the risk to the signup metric is .1%, even though this metric is not significant yet. You might be okay to take that risk and call the test without having to wait for significance on the metric. This allows you to move faster and test more.
Metric improvements — groups and guardrails
We made some major improvements to the handling of metrics. You can now tag metrics, which helps you organize and search for them. This is particularly helpful when you start adding a lot of metrics. Tagged metrics can be used as groups, and be easily added to experiments. For example, you could add tags to metrics that you want all sell page experiments to measure, under ‘sell page’, and easily add these metrics to all sell page experiments.
We also added support for guardrail metrics, which are metrics you want to keep an eye on and make sure they don’t degrade, but not specifically trying to improve. For example, many companies use page load time, crashes, error rate, or support requests as a guardrail metric to make sure they don’t increase.
Other improvements and bug fixes
- Better logging and error messages
- Allow customizing snowflake role
- Bug fix: variationIdFormat select box not working
- Bug fix: switch from UNION to UNION ALL in queries for better support
- Bug fix: use redshift default for SQL formatting to properly handle table names with dashes
We’d love to hear from you and get your thoughts and ideas. Drop us a line via email, Slack, Twitter, or just reply to this email.

Appetite for Risk — A/B Testing in Fast-Paced Environments
Rigorous statistics are often at odds with the needs of modern, product-driven companies to move fast and ship fast. Statistics is all about probabilities, and the more data, the more accurate the predictions. Product-led organizations are all about building the smallest part of a project that can add value as fast as possible, and then iterating quickly, looking for signals of product-market fit. The Venn diagram of these two areas overlaps with A/B testing, but this creates a tension between the statistics and the need to move fast.
If we all had enormous amounts of traffic to test against and infinite time to do these tests, we would make almost perfect decisions. Realistically, the pressure to ship fast often leads us to make calls on less-than-perfect data. These pressures can happen when metrics appear to be doing especially well or poorly, or if there are time constraints. You can, of course, stop a test whenever you like, as long as you’re aware of what this does to your statistics.
User behavior data has a lot of random variation, and this creates a noisy signal (it’s also a reason why trend data — data over time — is largely meaningless in A/B testing contexts). If samples are small, you’re more likely to be looking at noise than if samples are large. As the sample size increases, this noise is averaged out. Furthermore, if you’re using a Frequentist approach, your statistics only become actionable when the predetermined sample sizes are reached — otherwise, you’re falling into the peeking problem, the subject of many articles. If you’re using statistics that are less susceptible to peeking, like Bayesian or Sequential, you can peek and make decisions.
In all these contexts, some data is absolutely better than no data, but without finishing a test, you increase the odds of picking the wrong variation, and you lose the resolution on the most probable outcome. In short, you increase the risk of making a decision. The question that every experimentation program should be asking then is, what is your appetite for risk?
Risk
Most A/B testing statistics give you the chance to beat baseline/control as the probability that your variation is at least better than other control variation. But this measure gives no indication as to the amount better or worse it will be. If you’re forced to make decisions without perfect data, wouldn’t it be great to have some indication of what risks you’re taking? You would like to know if you call the test now, and you’re wrong about which variation you implement, what the likely negative impact would be. The good news is that Bayesian statistics give us just such a measure.
This risk, also known as potential loss, that Bayesian statistics provide can be interpreted as “When B is worse than A, if I choose B, how many conversions am I expected to lose?” It can replace the P-value as a decision rule, or stopping rule for A/B testing — that is, you can call your tests if the risks go below (or above) your risk tolerance thresholds, instead of using other values. If you want to read more about how risk is calculated, you can read Itamar Faran’s excellent article: How To Do Bayesian A/B Testing at Scale.
Growth Book recently implemented this same risk measure (with the help of Itamar) into our open-source A/B testing platform. This measure empowers teams to call tests earlier and be aware of the risks they are taking in doing so.

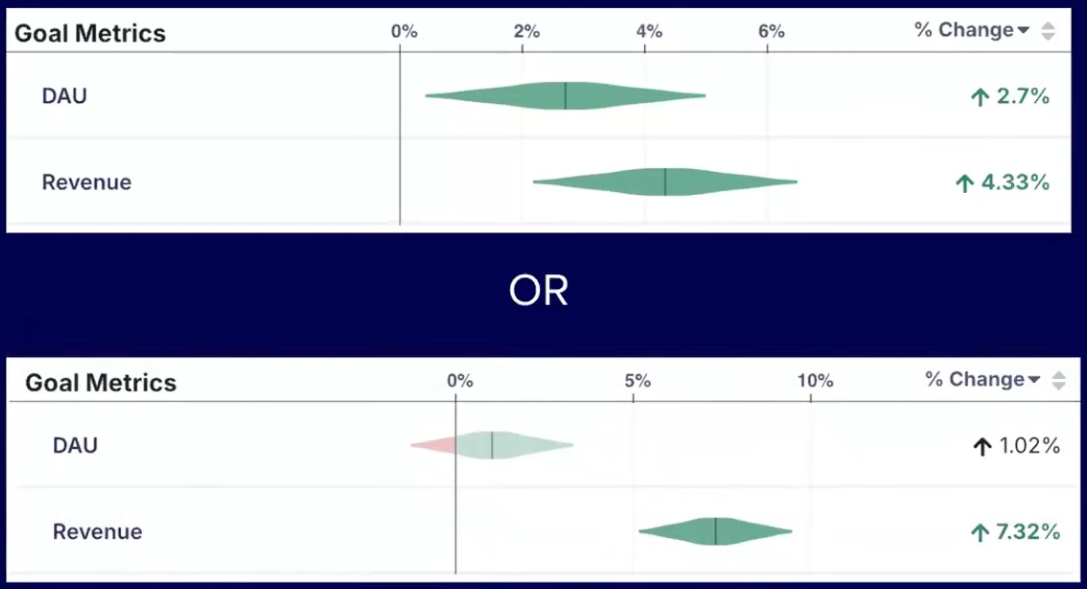
In the above example, both metrics are up, but only have about a 78% chance of beating the control, well short of the typical 95% threshold. However, neither one appears to be very risky. If you stop the test now and choose the variation and you’re wrong, your metrics would only be down by less than a percent. Depending on your business, that may be good enough, and you can move on to the next experiment without wasting valuable time.
The combination of Chance to Beat Control, Risk, and a Percent Change confidence interval gives experimenters everything they need to make decisions quickly without sacrificing statistical accuracy.

GrowthBook Now Supports ClickHouse
GrowthBook now natively supports ClickHouse as a data source for experiment data. ClickHouse is a popular open-source data warehouse/OLAP (Online Analytical Processing) system that scales massively and is used by Yandex.Metrica. Users of ClickHouse can now easily run A/B tests with this data by using GrowthBook. Simply add a new data source, select ClickHouse from the drop-down list, and add your connection details.
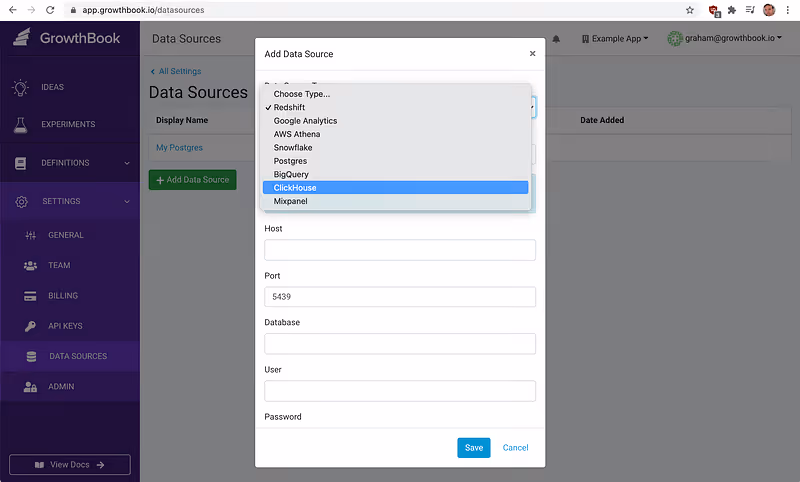
Once the data source is defined, you can use it to create metrics you want to test against. Happy experimenting.

Announcing GrowthBook Open Source Release
We’re excited to announce the release of GrowthBook Experimentation Platform under the MIT license. Recently, we’ve had feedback from the experimentation community that a lot of existing ope- source experimentation platforms are incomplete. Many are old and abandoned, and most lack any sort of user-friendly UI. By open-sourcing the core of the GrowthBook application, we hope to address these problems and give all teams the power of a customized experimentation platform. To host your own version of Growth Book, the GitHub repository is here and technical documentation can be found here.
As we’ve talked about before, open-source experimentation tools can be broken down into three categories: variation assignment and targeting, metric tracking, and analysis/reporting. The variation assignment and targeting piece of GrowthBook has always been open source, but now we’re opening up our solution for the other two.
Open source has always been and always will be at the core of what we believe is a good developer experience, and GrowthBook is committed to offering the best developer-focused experimentation platform.
We invite the community to host their own versions and contribute by sharing feedback and ideas, and by reporting issues on our GitHub pages or in our Sgithub pages or on our slack community.

Objective A/B Test Prioritization
There are many prioritization frameworks out there for A/B tests (PIE, ICE, PXL, etc.), but they all suffer from one critical problem — subjectivity. The reason A/B testing is so powerful in the first place is that people are really bad at guessing user behavior and the impact of changes. Why are we then using those same bad guesses to prioritize? In addition, many of these frameworks place far too much emphasis on effort — how long a test takes to implement. Except in the rarest of cases, the time it takes to implement a test is far shorter than the time the test needs to run. In most cases, effort should be more of a tie breaker, not a core part of prioritization.
At GrowthBook, we developed a new prioritization framework based on hard data, not subjective guesses. It all centers around an Impact Score, which aims to answer the question — how much can you move the needle on your metric? The Impact Score has 3 components — metric coverage, experiment length, and metric importance.
Metric Coverage
Metric Coverage indicates what percentage of the metric conversions your experiment touches. If you have a Sign Up button in your site-wide top navigation, it has 100% metric coverage for signups because 100% of members will see that button before signing up. Your experiment may not change their behavior, but it at least has the potential to. On the other hand, if you have a Sign Up button on your homepage, you may only see 20% of potential new members. Even if you do an amazing job optimizing the button, it will have no effect on the 80% of people who come in through different landing pages.
Metric Coverage doesn’t just take into account the URLs an experiment runs on; it also needs to factor in targeting rules. If your experiment runs only for users in the US, that reduces coverage. If the test only affects the UI on mobile devices, that lowers it as well.
Calculating Metric Coverage is actually fairly simple. You take the number of conversions your test could possibly influence and divide by the total number of conversions across the entire site. Getting these numbers usually requires checking Google Analytics or using SQL and can be tricky for non-technical users. At GrowthBook, we solve this by generating SQL and automatically querying your database, given a few simple prompts (experiment URLs, user segments being tested, etc.).
Experiment Length
Experiment Length is an estimate of how long the experiment must run to reach significance. In essence, you do a sample size calculation and then divide by the daily traffic each variation will receive.
There are many sample size calculators out there (I recommend this one), and the statistics to implement your own are not too hard, so I won’t cover that here. I will note that the sample size calculation does require a bit of subjectivity — namely, choosing a Minimum Detectable Effect (MDE). If you are making a tiny change that most people probably won’t notice, you will need a lower MDE to pick up the change. Conversely, if you are making a major change, a higher MDE will suffice.
Let’s say you do that and come back with a sample size of 2000 per variation. If your experiment receives 500 visitors per day (for the selected URLs and user segments) and you are running a simple 2-way A/B test, it will take 8 days to finish (2000 / (500 / 2)). A 3-way test with the same traffic would take 12 days.
Because it’s best practice to run an experiment for at least a week, even with very high traffic, we set a minimum length of 7.
Metric Importance
Not all metrics are created equal. A “revenue” metric is more valuable than an “enter checkout” metric, which is more valuable than a “sign up for newsletter” metric.
This part of the equation simply assigns a number to each metric, ranging from 0 to 1 on a linear scale. For example, “revenue” might get a 1, “enter checkout” might get a 0.7, and “sign up for newsletter” might get a 0.2.
Developing this scale can be either entirely subjective or backed by data science and modeling. Companies usually have a relatively small set of metrics that remain fairly stable over time, so this scale can be established once at the organizational level rather than for each experiment.
Putting it all Together
Now we come to the actual Impact Score calculation (on a 0–100 scale):
metricCoverage * (7 / experimentLength) * metricImportance * 100
This optimizes for A/B tests that finish quickly and have significant potential impact on the most important metrics. It does not try to guess how likely the test is to succeed (that’s why we’re testing in the first place).
The Impact Score removes subjectivity from the equation and lets PMs focus on what they are really good at during prioritization — planning around limited engineering/design resources, conflicting experiments, marketing promotions, and other external factors.
Ready to ship faster?
No credit card required. Start with feature flags, experimentation, and product analytics—free.

