

GrowthBook 5.0: Product Analytics is now generally available
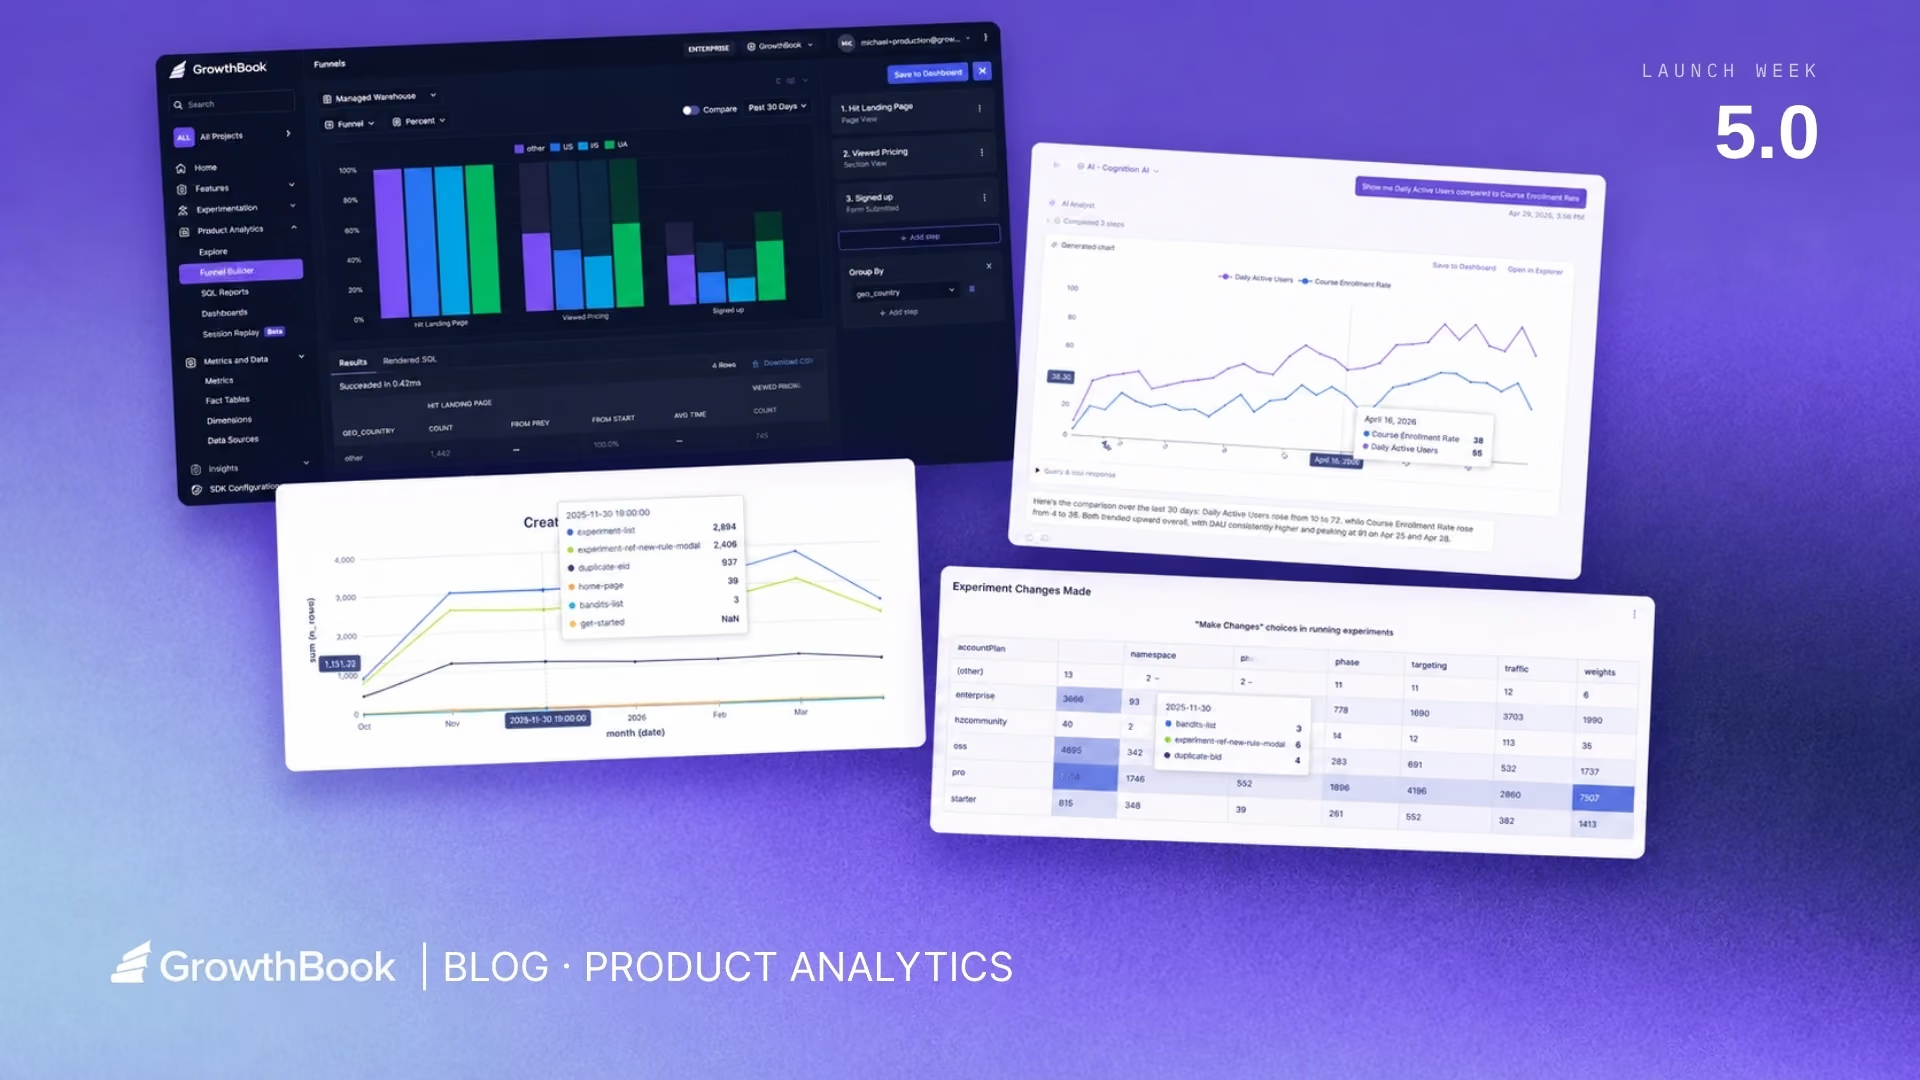
GrowthBook’s Product Analytics is now generally available. Monitor your KPIs, explore trends, build dashboards, and analyze funnels, using the same trusted metric definitions your team already relies on for experimentation and feature flags.
If you're running experiments in GrowthBook, you've already done the hard work. You've connected your data warehouse, defined your metrics, and built a shared language for how your team measures success.
Product Analytics puts those metrics to work beyond experiments. Keep your north star KPIs front and center so your team can identify new opportunities to test, and track how past experiment wins are translating into long-term impact. Build dashboards that show product trends and experiment impact side by side, giving stakeholders the full picture in one place.
This post covers everything that is now generally available within Product Analytics.
AI-powered analytics
A native AI chat agent is built directly into Product Analytics. This opens up analytics to any user, turning a few prompts into actionable insights without needing to know the schema or rely on a data analyst for answers.
Ask questions in plain language, such as “Chart the number of daily users and conversions for the past 30 days” and the agent will build the exploration, render the chart, and surface insights behind the data.
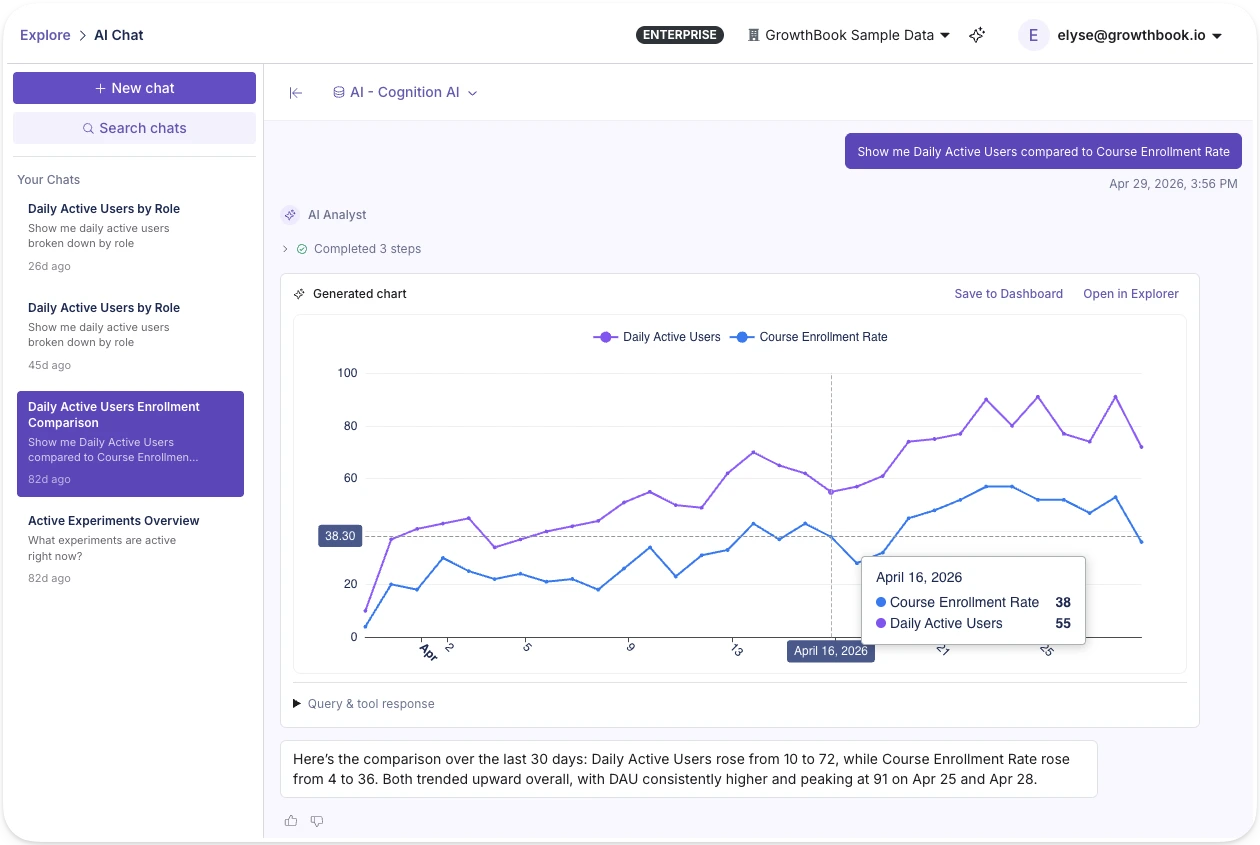
In-app AI assistant
GrowthBook 5.0 also includes a platform-wide AI assistant available from any page in the app. In addition to taking action and supporting workflows across feature flags and experiments, it can also pull up analytics and surface trends from wherever you're working. This assistant pulls from 25+ open-source skills spanning feature flag management, experiment design, and product analytics.
See Product Analytics live
Join a live demo to walk through the Metric Explorer, funnels, and dashboards built on warehouse data.
Pick a Demo Date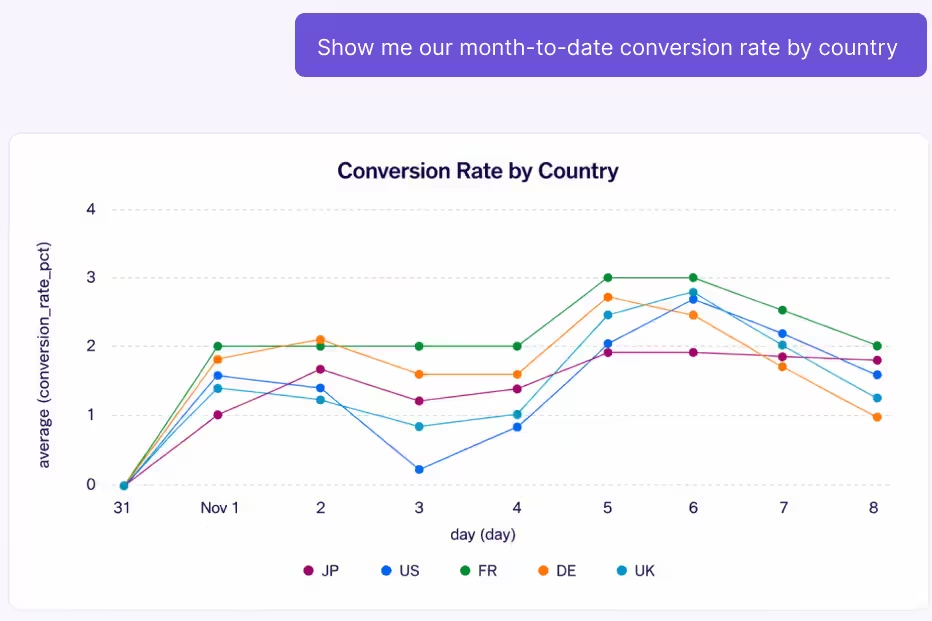
The Metric Explorer: visualize and explore your data
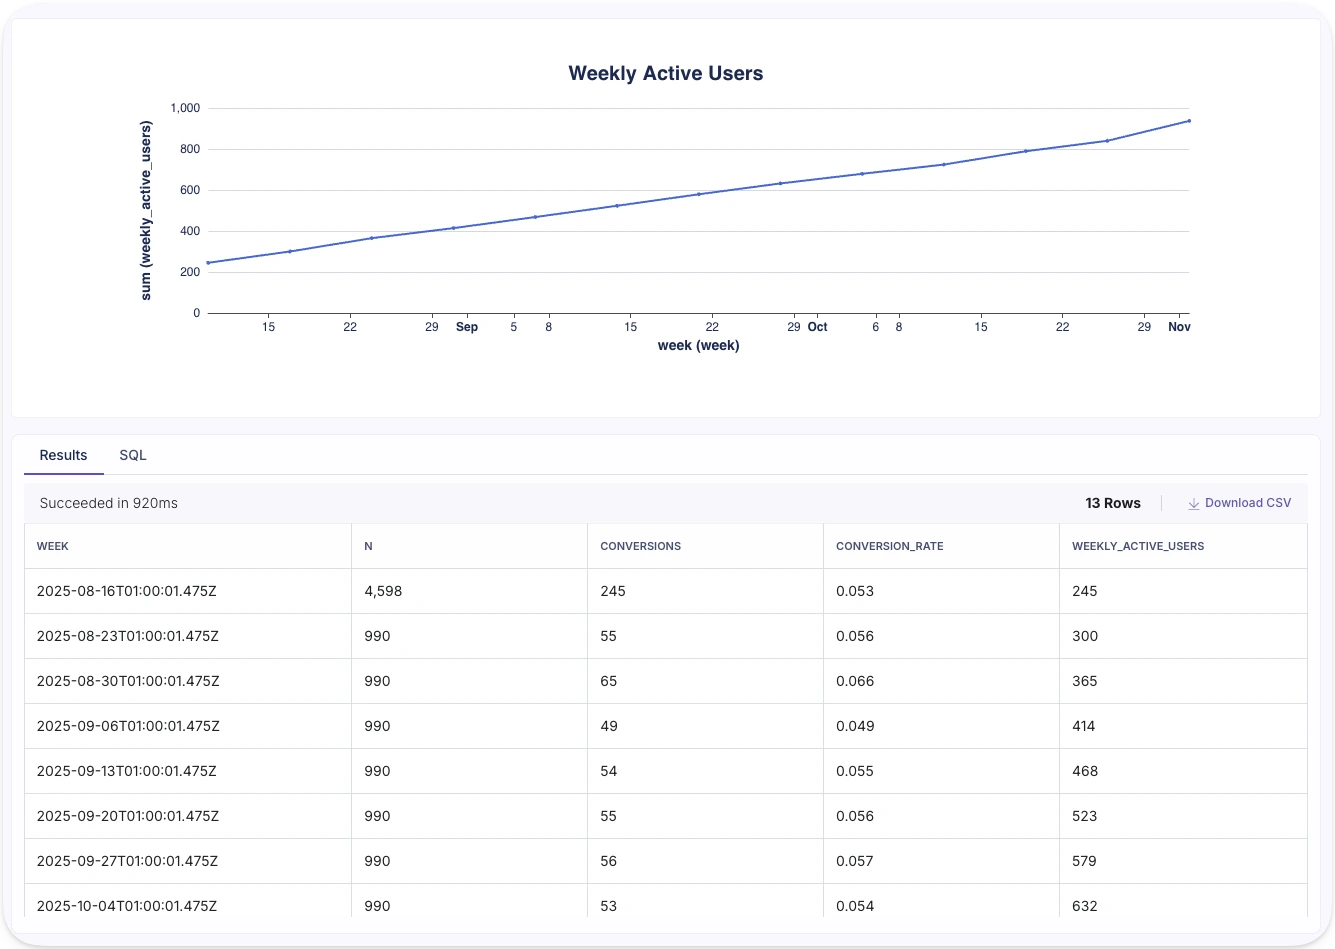
The Metric Explorer lets you visualize any metric your team has defined in GrowthBook without needing to write SQL. These are the same metric definitions powering your experiments, so there's no custom SQL to write and no risk of metric drift between your analytics and your experiment results. This lets teams go quickly from question to chart in seconds.
The Metric Explorer supports a range of chart types (line, area, bar, stacked bar, horizontal bar, stacked horizontal bar, timeseries table, table, and big number) and the ability to segment by dates, dimensions, and filters.
If your team hasn't fully defined metrics yet, the Explorer also supports querying fact tables directly or even raw data source tables in your warehouse, so you can start exploring immediately and promote what you find to reusable metrics over time.
Because GrowthBook generates the SQL behind the scenes, it works with GrowthBook's Managed Warehouse, BigQuery, Snowflake, Databricks, Redshift, ClickHouse, Postgres, and more. Your data never leaves the warehouse.
SQL Reports
The SQL Explorer lets you write, save, and share queries directly within GrowthBook. No external BI tool needed. Pin results to any dashboard alongside your metric explorations and experiment data.
Write a query in the built-in editor with schema browsing and autocomplete, or describe what you want in plain language and let AI generate the SQL from your warehouse schema. Run the query, then layer on the types of visualizations you’d like to see: bar, line, area, scatter, pivot table, or big value (KPI). Configure axes, aggregations, dimensions, and filters visually without touching the SQL again.
Save reports, refresh them on demand, and pin individual visualizations to any dashboard alongside your metric explorations.
Funnel analysis
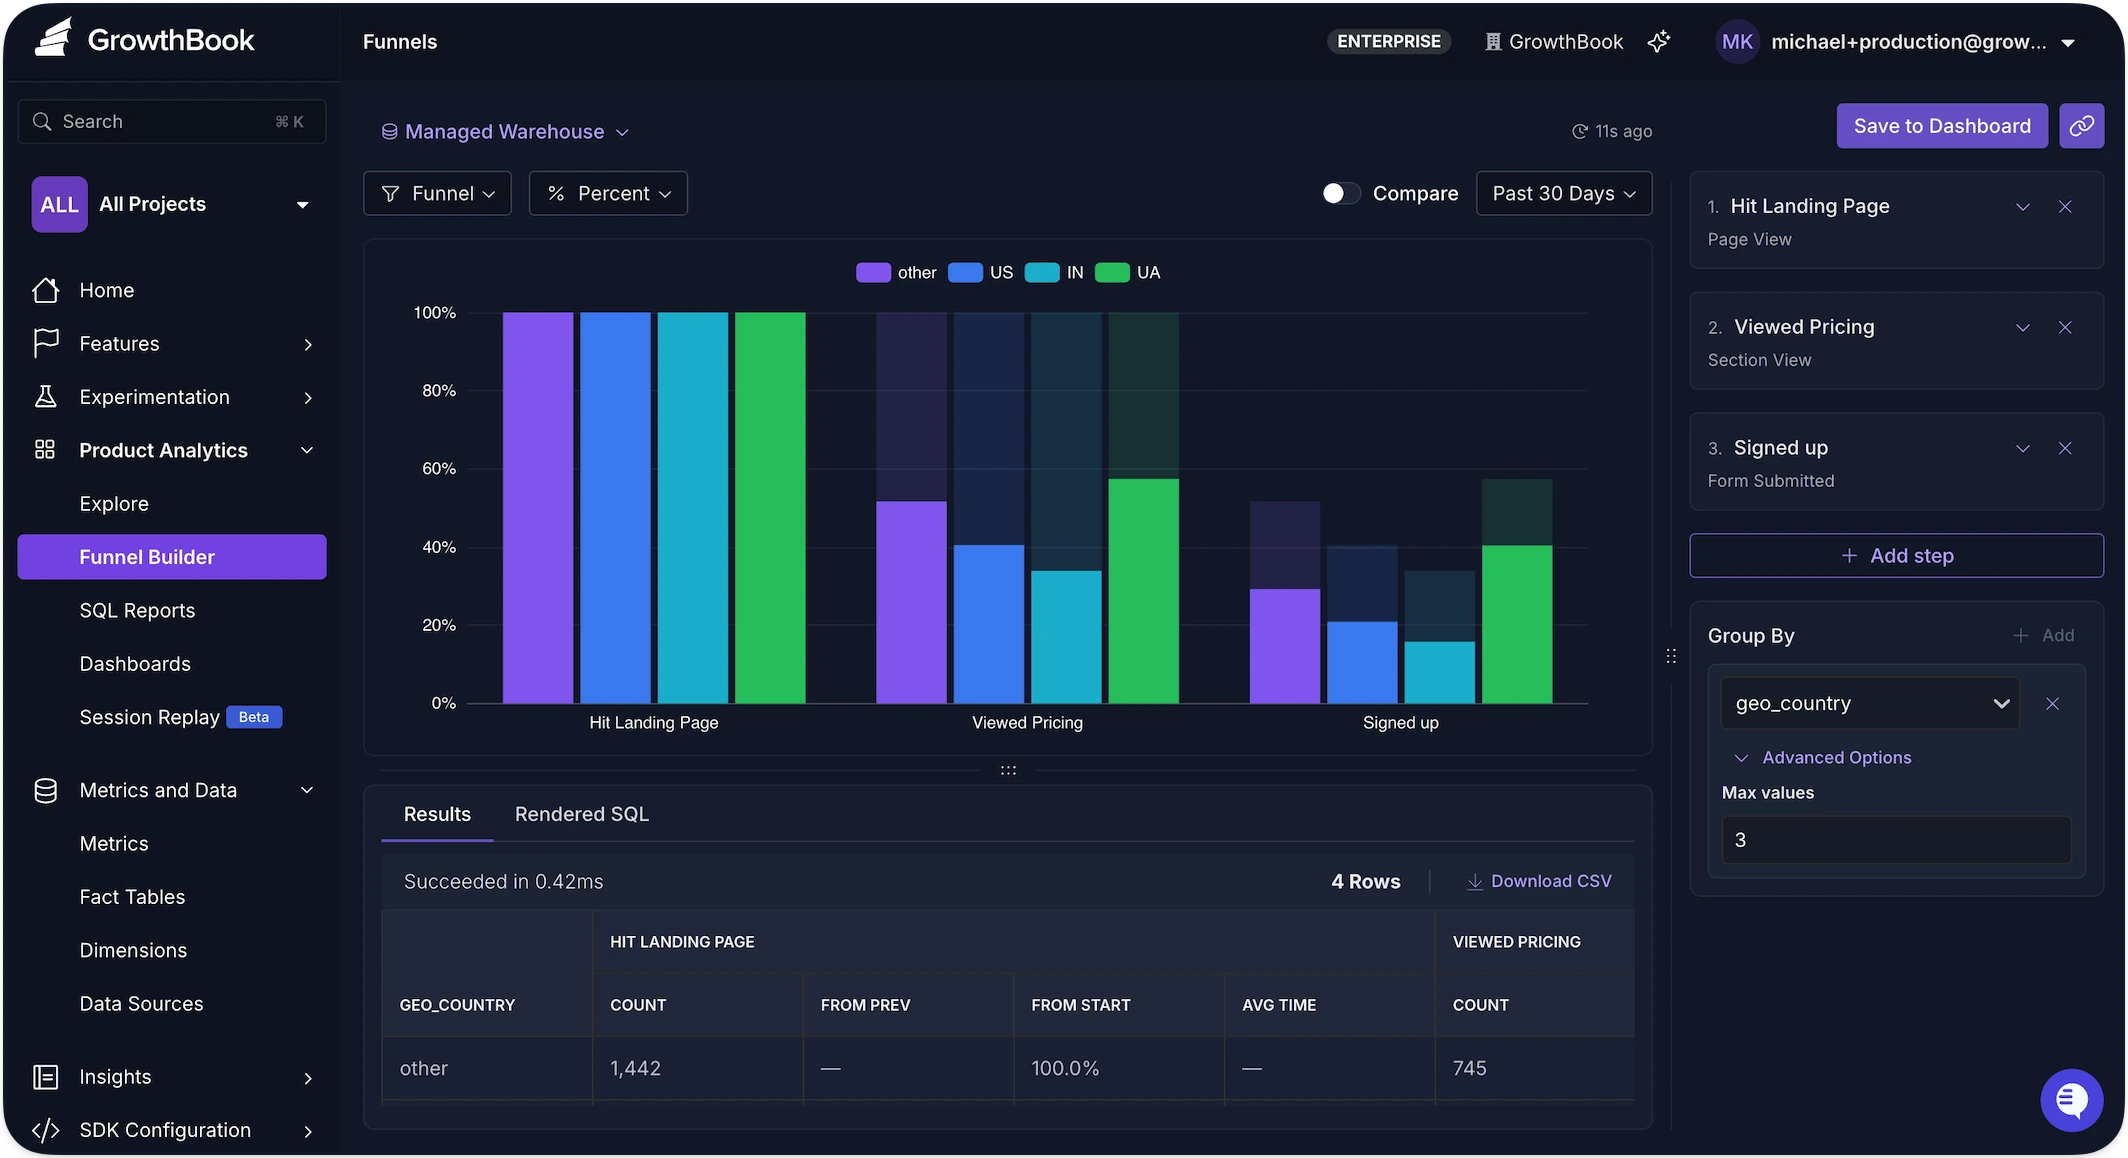
Define step sequences to visualize conversion rates between each step and understand where users fall out of the flow. Break funnels down by any dimension to find where specific segments convert differently.
For example, you might define a checkout funnel and break it down by device type. You notice mobile users drop off at the payment step at twice the rate of desktop. That's a clear signal. From the same platform, you can launch an experiment to test a simplified mobile payment flow and measure whether it closes the gap.
Whether it's your onboarding flow, checkout, or activation sequence, funnel analysis turns drop-off points into experiment hypotheses you can act on immediately.
Dashboards
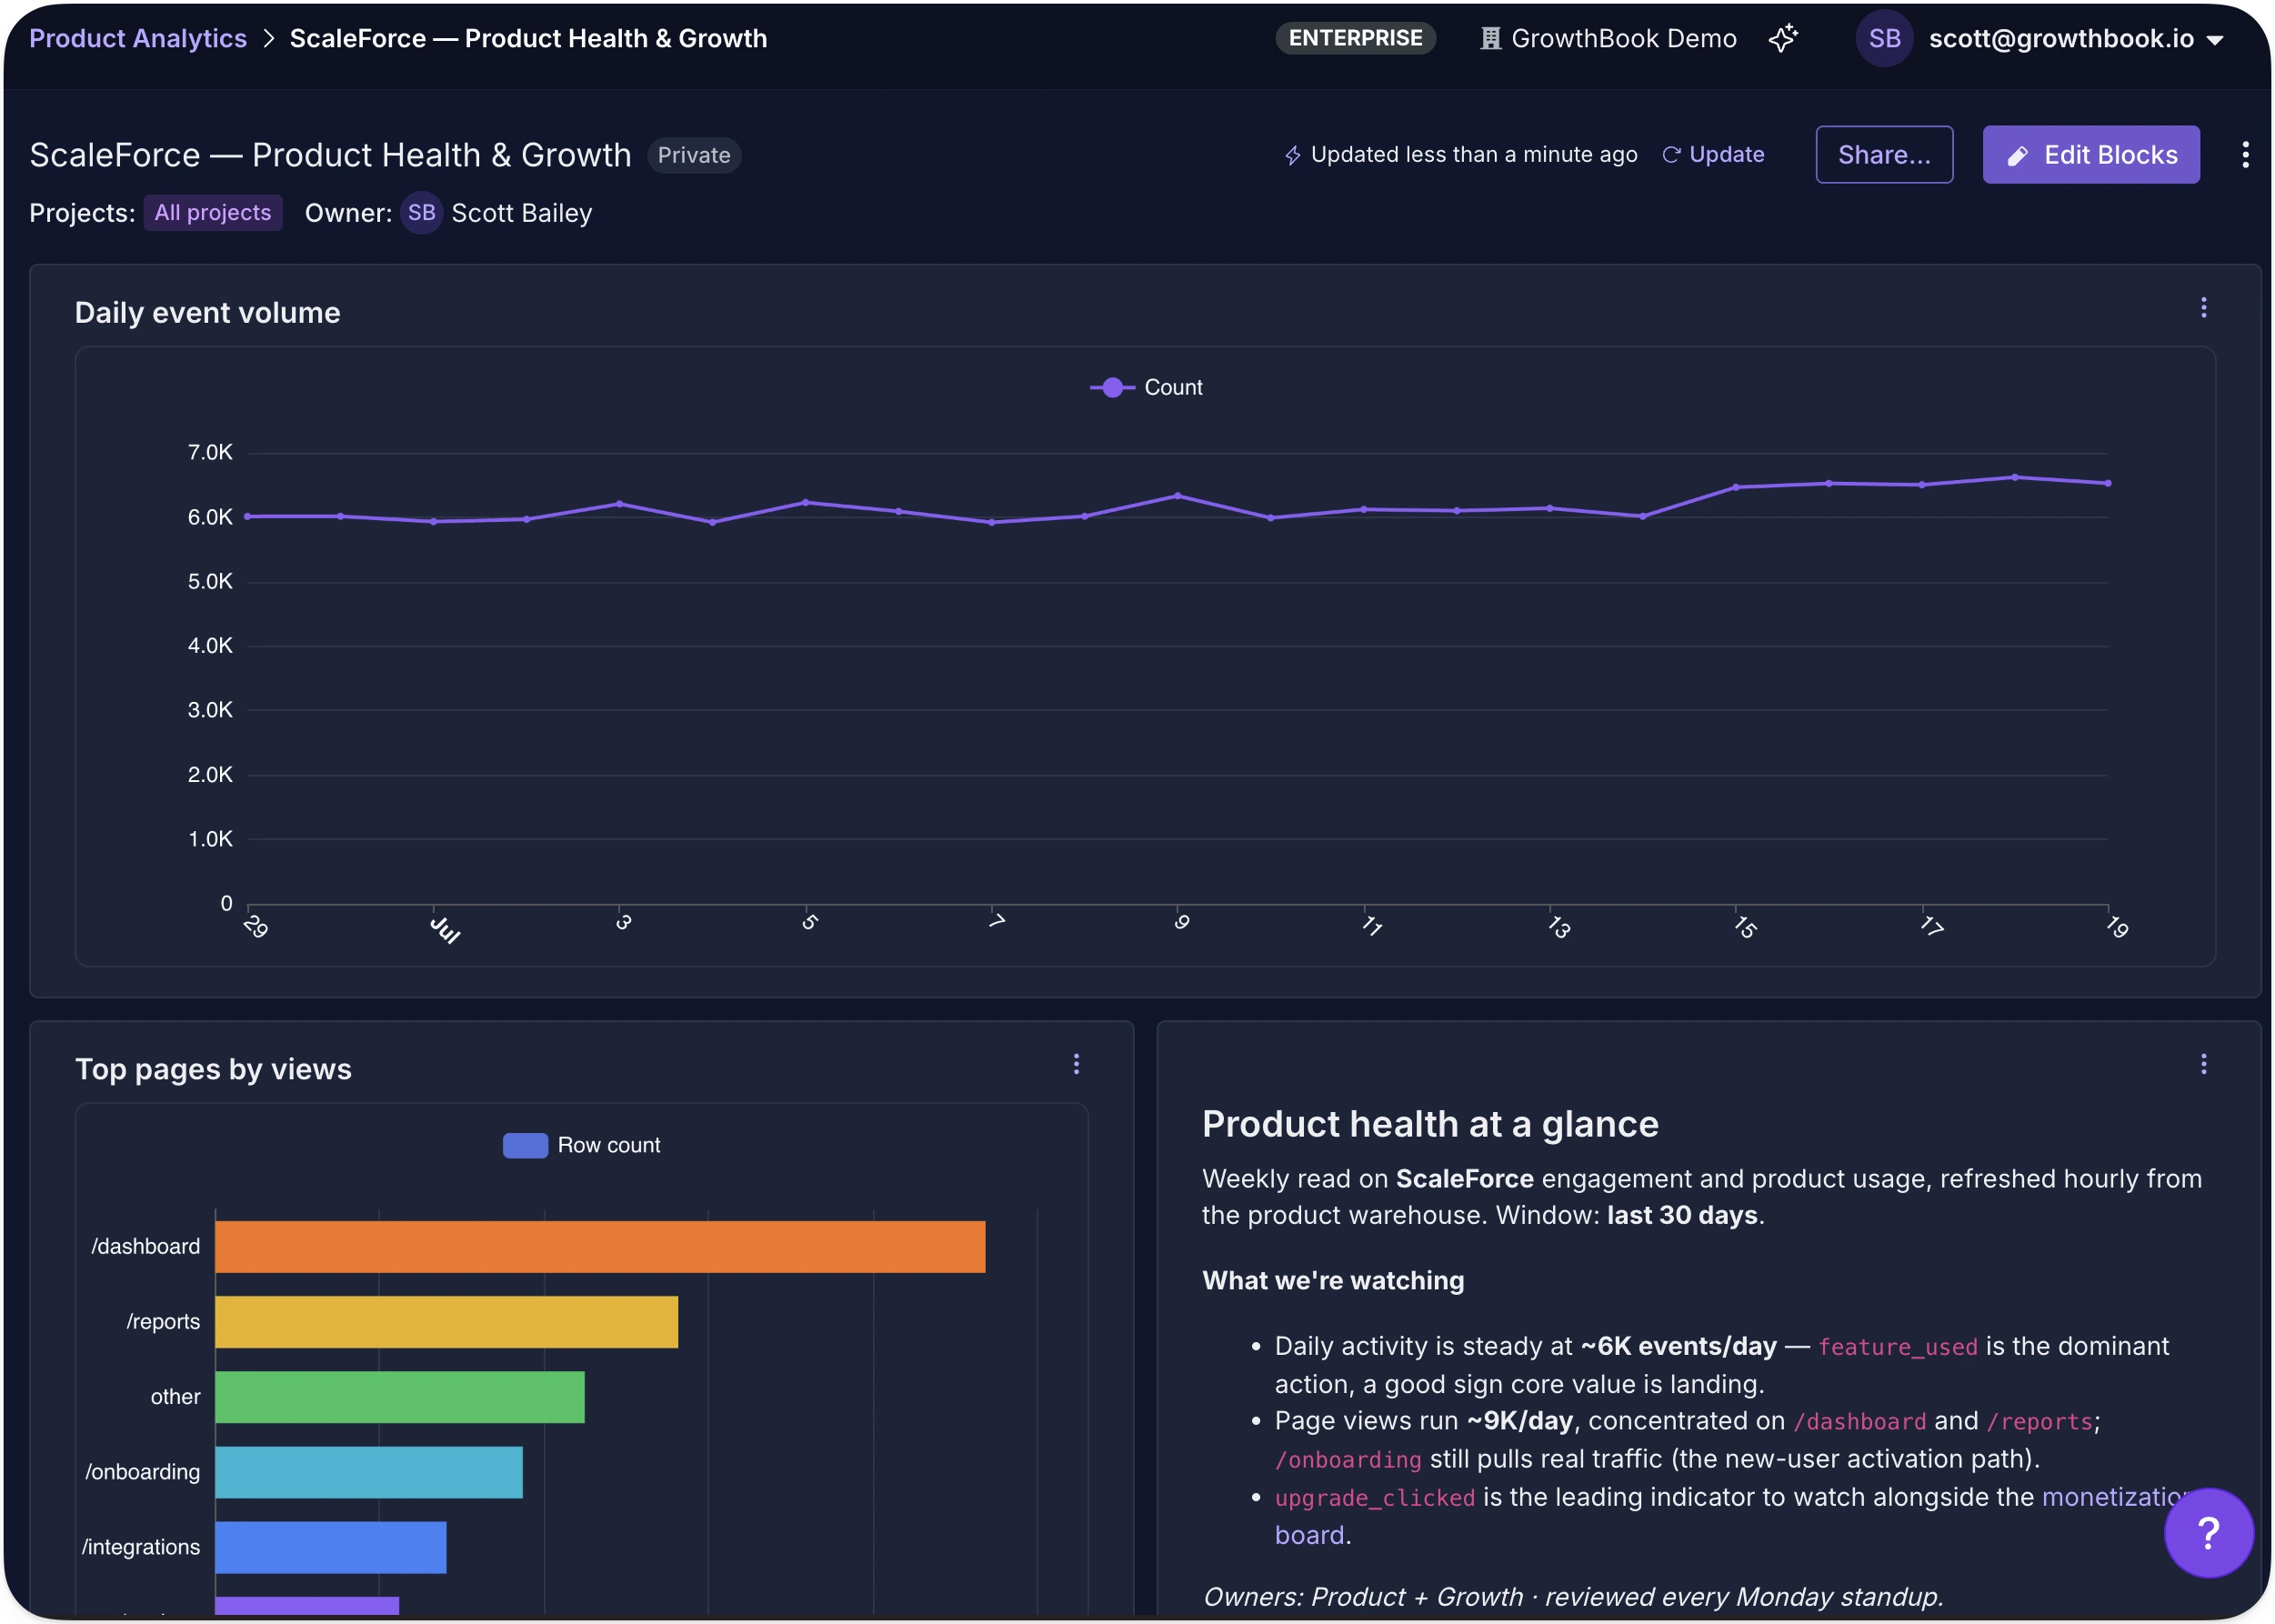
Dashboards let you tell a story with your data. Create custom dashboards tailored to your north star metrics so they remain front and center. Arrange the KPIs that matter most to you on a flexible grid with drag-and-drop, and set a refresh schedule to keep everything current, and share with your team.
GrowthBook dashboards support a range of block types, from metric explorations and saved SQL queries to rich text, so you can build exactly the narrative your team or stakeholders need to get the full picture.
A typical dashboard might include your north star metric trend, a product funnel showing where users drop off, and the scaled impact from all your experiments pertaining to the relevant metrics.
One source of truth
Product Analytics is an extension of the work your data team has already done. The metrics are defined. The warehouse is connected. Now those same definitions power dashboards, funnels, and ad-hoc exploration, not just experiment results.
For teams that want programmatic access, the REST API exposes endpoints for running explorations, and every exploration gets a shareable URL encoding its complete configuration.
Product Analytics is available now. Get started or book a demo to see it in action.
Analyze your own warehouse data
Create a free account, connect your data warehouse, and build your first dashboard.
Start Building Free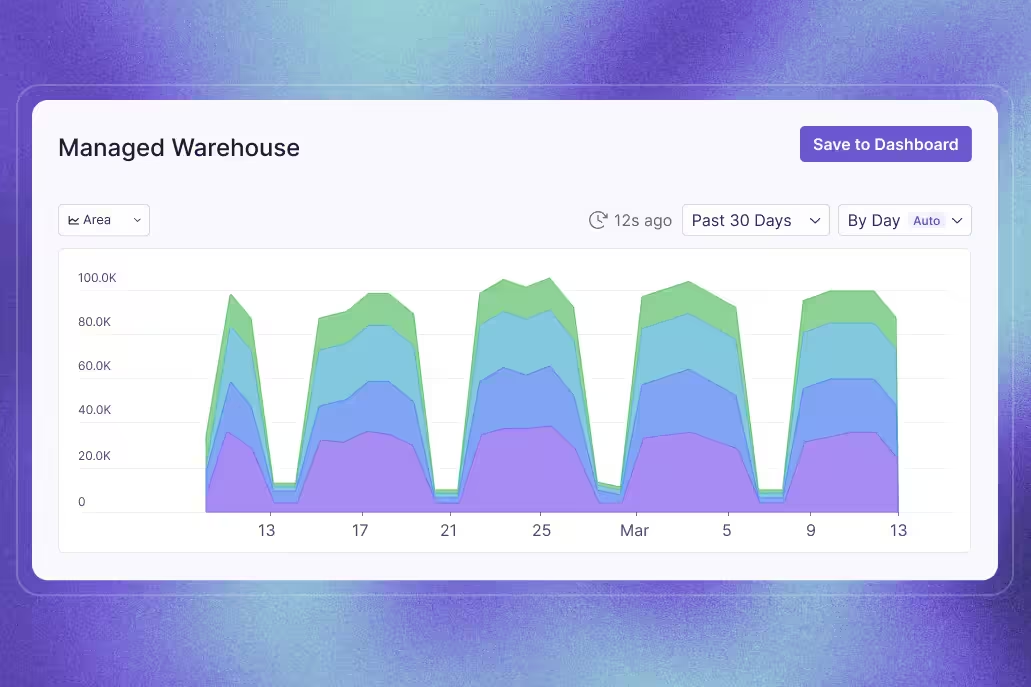
Related articles
Ready to ship faster?
No credit card required. Start with feature flags, experimentation, and product analytics — free.

