

TodayTix Scales Poster Experimentation and Lifts Show Page Views Up to 24%
How a global theater ticketing platform used GrowthBook to run 50+ A/B tests, and discovered design rules that now shape Broadway marketing.

TodayTix Group is the global e-commerce leader for cultural experiences. Their mission is to find a seat for everyone, seamlessly connecting a global audience of more than 20 million with inventory spanning from Sondheim to Shakespeare to Spielberg.

Challenge
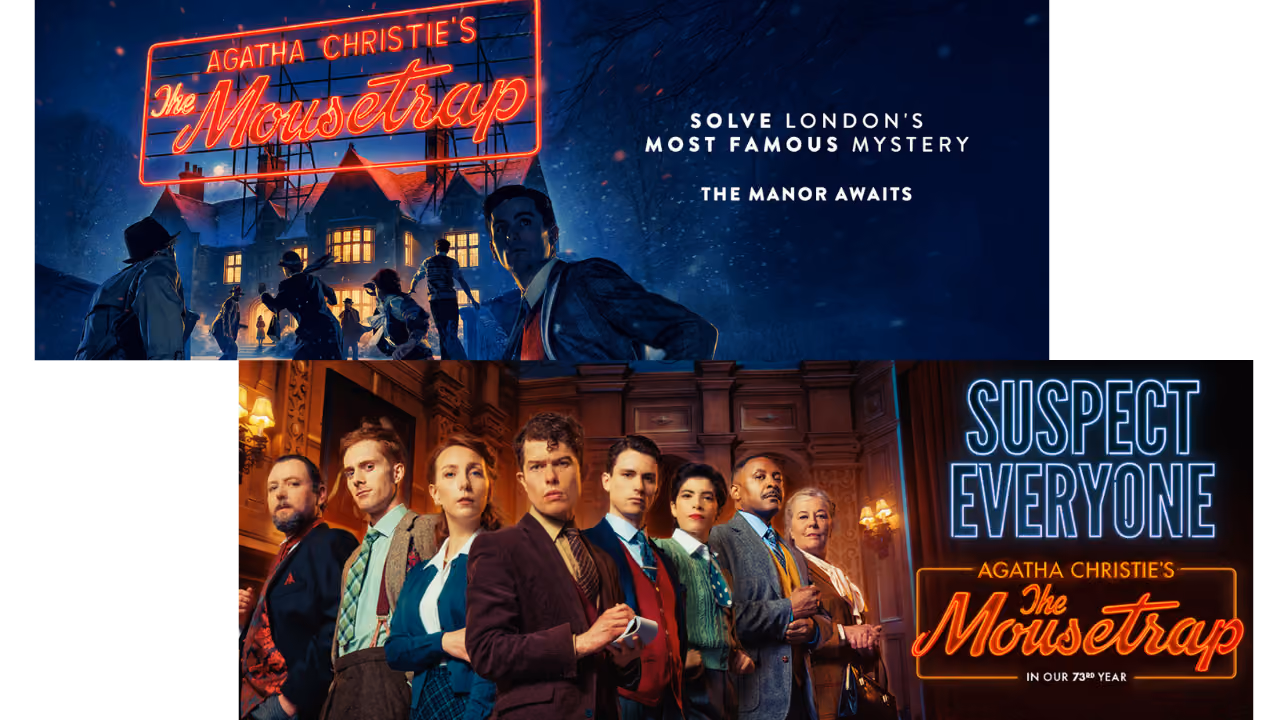
TodayTix Group runs a Netflix-style marketplace for theater tickets with a scrolling grid of show posters across Broadway, London's West End, and global stages. Each thumbnail is effectively a conversion decision: the right image drives a click, a page view, and ultimately a ticket sale. The wrong one gets scrolled past.
The problem is that without rigorous experimentation, nobody actually knows what "right" looks like. Theater is a high-instinct industry. Producers, marketing agencies, and designers all have strong opinions. Without data to settle the arguments, every poster decision is a guess.
The team needed a platform that could run simultaneous experiments across a large, diverse catalog and connect cleanly to their existing data infrastructure. They were already on Amazon Redshift. They needed something that plugged in without rebuilding their pipeline.
Solution
TodayTix Group integrated GrowthBook directly with Redshift, connecting experiment assignment and analysis to the same data warehouse already powering their analytics. The warehouse-native approach meant no duplicate pipelines, no third-party data transfers, and no new infrastructure to maintain.
GrowthBook enabled the team to:
- Run multi-show experiments simultaneously, testing the same hypothesis across 30 shows at once in their first major experiment
- Use page views (intent) as a fast statistical signal, bypassing the long buying cycle inherent to considered purchases like theater tickets
- Reach statistical significance in roughly two weeks, fast enough to iterate within a show's marketing window
- Share data-backed best practices with partners, turning experiment outputs into actionable guidance for marketing agencies and designers
"We wouldn't know the answer ourselves. We can't get it without experimentation. Growth Book has shown us that, and we would really struggle without a tool to give it to us."
— Senior Director, Head of Insight, TodayTix
Results
Up to 24% more page views from optimized artwork
Individual show experiments have delivered page view lifts ranging from 10% to 24%, measuring the increase in users clicking into a show's dedicated page. Given that theater is a considered purchase (specific date, needs coordination, non-trivial price), page view intent is the primary leading indicator of ticket sales.
The face hypothesis: wrong answer, better question
The team's first major experiment asked whether posters featuring a human face drove more clicks than those without. The hypothesis had company-wide buy-in, and yet turned out to be a null result. No statistically significant difference with or without faces. But while analyzing that data, the team spotted a consistent signal they hadn't set out to test: shows with larger title text outperformed their counterparts across the board. That finding, born from a failed hypothesis, is now the single most durable design rule in their best practice library.
10% consistent lift from title size alone
Across dozens of experiments, larger title treatment on poster artwork has produced a consistent ~10% lift in page views. The finding is robust enough that it is now shared with every new show partner as a baseline recommendation.
Key experiment findings
WINNER: Larger title treatment
Most consistent finding across all shows and markets. ~10% page view lift.
WINNER: Clean, uncluttered layout
Posters crowded with credits (director, writer, ensemble, etc.) consistently underperform. Hard to read = easy to skip.
NEUTRAL: Faces on poster
Company-wide hypothesis. No detectable effect. The real signal was title size hiding in the same data.
NEUTRAL: Award callouts
Adding show award mentions to a known show's poster produced no statistically significant lift. Audiences already knew it was good.
SHOW-DEPENDENT: Photo vs. illustration
No consistent winner across show types. Still actively tested per show to optimize.
SHOW-DEPENDENT: Celebrity focus
Balancing celebrity prominence vs. show brand identity has no universal answer. Experiment each time.
Insights that travel beyond the platform
When a winning poster variant is identified, the show's marketing team often adopts it across their broader campaign, including out-of-home advertising, social media, and transit placements. GrowthBook experiment data is influencing what audiences see on bus shelters, not just inside an app.
Implementation
The team connects Amazon Redshift directly to GrowthBook for experiment analysis. Each experiment runs for approximately two weeks before results are reviewed. The workflow spans three groups: TodayTix's analytics team, their internal partnership managers, and the partner's marketing agency and designer, with experiment findings feeding directly back to the creative iteration loop.
New shows enter the platform with zero historical data. GrowthBook gives the team something to offer them immediately: 50+ experiments' worth of accumulated best practice, plus the infrastructure to test and iterate from the first live version.
“More and more people are coming to us saying 'can we please test our poster?' Theater is an emotional industry. People have strong preconceptions, but you just can't argue with data."
— Senior Director, Head of Insight, TodayTix
Next steps
The team is actively tracking GrowthBook's product roadmap, with particular interest in AI-driven features. The experimentation program continues to expand as new shows are onboarded and the catalog of tested variables grows. The 50-experiment baseline is a strong foundation to build on.
Ready to ship faster?
No credit card required. Start with feature flags, experimentation, and product analytics—free.

