

How Floward drove double-digit revenue growth
Building an experimentation culture with a warehouse-native experimentation platform enabled faster decisions, deeper insights, and scalable testing across markets.

Floward is the leading online flowers and gifting company in the Middle East and the UK. The company was founded in 2017, and within five years expanded operations to include nine countries. They love making the process of sending flowers and gifts as enjoyable as receiving them.


Executive summary
Floward’s data science team wanted to move beyond opaque, black-box A/B testing. In late 2024, they migrated to GrowthBook Enterprise, integrating directly with their AWS Redshift warehouse to bring experimentation inside their own data pipeline.
Within nine months, the team launched 200+ live experiments across web, iOS, and Android, validated results in real time, and helped drive double-digit revenue growth. More importantly, GrowthBook gave Floward complete visibility, control, and reproducibility, turning experimentation into a data-driven discipline and encouraging an experimentation culture within the company.
Background
Floward operates across nine markets, including Kuwait, Saudi Arabia, Oman, Qatar, Bahrain, United Arab Emirates, Jordan, Egypt, and the United Kingdom. Each market behaves differently, from purchasing power to cultural preferences, so the data team needed to test locally, learn globally, and maintain a single source of truth.
The Challenge: black-box experimentation
Before GrowthBook, experiments ran through a platform with limited custom metric support. That approach hit predictable pain points:
- No access to underlying metric definitions or SQL
- Difficulty establishing proper randomization for experiments
- Inability to augment the measurement framework to add or enrich insights
“Our previous measurement tools felt like a black box and it was difficult for us to integrate our own in-house metrics. GrowthBook has enabled us to become a lot more data-driven in how we make decisions.”
— Amr Abouhussein, Head of Data
The Solution: warehouse native experiments
Floward adopted GrowthBook Enterprise to align experimentation with its existing AWS infrastructure.
Integration Overview
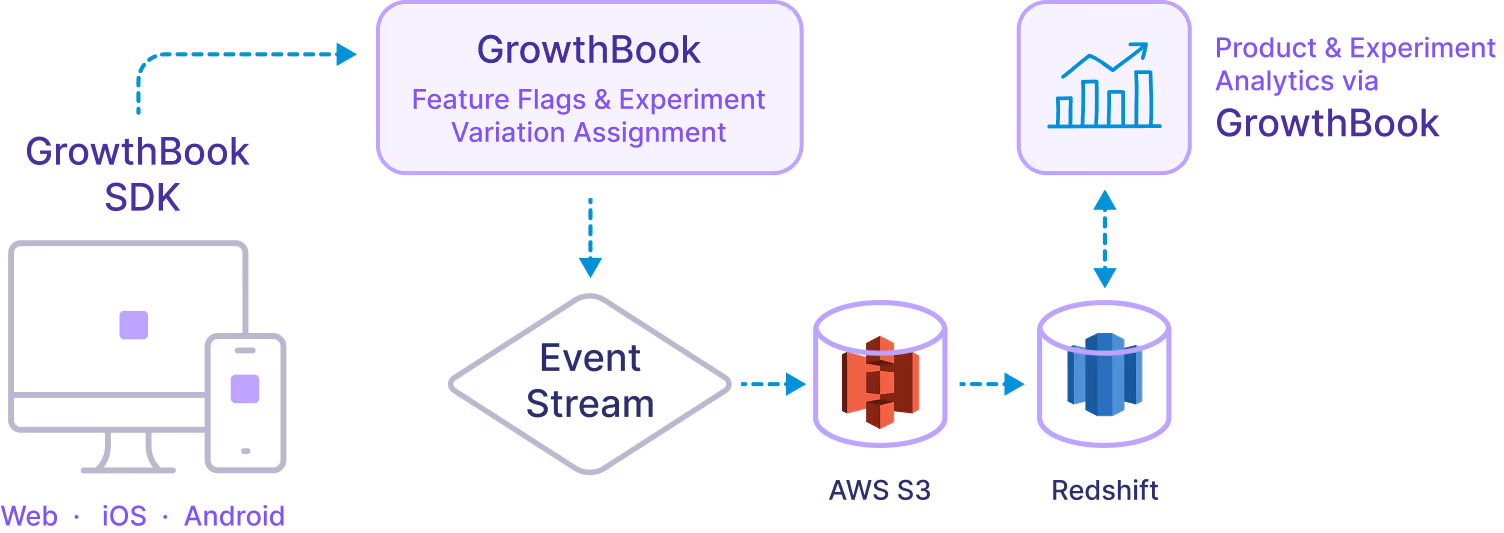
- Warehouse-native: All metrics computed directly from Redshift; no duplicated events.
- Custom SQL metrics: Engineers define standard conversion, revenue, and retention queries in SQL, ensuring consistency across experiments.
- Instant rollouts: Flags and variations can be turned on or off in seconds without requiring new builds.
- Granular targeting: Experiments segmented by country, language, and device type.
Product and data wins
Before GrowthBook, the setup relied on third-party aggregation, manual experiment configuration, and limited rollout control with basically zero ability to explain what was actually happening. After GrowthBook, everything runs on Redshift as a single source of truth, experiments are SDK-driven and versioned in Git, rollouts and rollbacks are instant, and results are fully explainable with transparent SQL and daily monitoring.
Experiments that moved the needle
Kuwait – “Best Friend Collection” homepage experiment
Hypothesis: Featuring the Best Friend gift collection at the top of the homepage would increase conversion.
Results:
- +8% Order Conversion
- +4% Revenue Lift
Insight: Prioritizing culturally relevant collections directly increased both conversion and revenue, validating homepage merchandising as high-leverage.
Qatar – High-margin product visibility
Hypothesis: Positioning high-margin products at the top category on the homepage would improve business performance.
Results:
- 0% Change in Order Conversion
- +6% Revenue Lift
Insight: While conversion did not increase, revenue grew, indicating users shifted toward higher-margin products without reducing purchase intent.
Global – New users layout experiment
Hypothesis: Changing the homepage layout to feature low-cost curated products would encourage first-time purchases.
Results:
- +3% Order Conversion
- -5% Revenue Impact
Insight: Lower price positioning increased first-time purchases but reduced overall revenue, highlighting the importance of measuring both conversion and revenue simultaneously. This is possible because GrowthBook runs directly on Floward’s Redshift warehouse.
Quantitative impact
- Experiments Run: 200+ across three platforms
- Sales Growth: Double-digit YoY increase
- Homepage Conversion Lift (Kuwait)+8%
- Revenue Lift (Qatar test)+6%
- First-Time Conversion (Global test)+3%
- Experiment Velocity: Setup time cut from 3 days to less than 30 minutes
Key learnings for engineering teams
- Own your data path. Run metrics from your warehouse, not your vendor’s.
- Start small, scale fast. Prove value with one or two experiments, then templatize rollouts.
- Enable every role. Provide product managers with access so data scientists aren’t bottlenecks.
- Collaborative monitoring. Daily checks mitigate experiments not going in the right direction.
Ready to ship faster?
No credit card required. Start with feature flags, experimentation, and product analytics—free.

