Interleaving experiments: how to test a new ranker with a fraction of the traffic

Interleaving tests a new ranker by merging its results with the current ranker's into one list, so every user compares both. Companies like Netflix and Airbnb report reaching a verdict with 2% of the traffic a standard experiment needs, or less.
Search and recommendation teams run out of traffic before they run out of ideas
Rankers are algorithms that decide the order of items in a list, like search results or recommendations. Their goal is to show the user the most relevant items at the top. To keep improving and stay relevant to users, teams change their rankers all the time: a new model, a new signal, new weights.
Knowing whether a change to the ranker really improves the list with live user data is a key challenge. A mature ranking system is already pretty good, so most changes have small effects. Small effects need a lot of users, so experiments take time. Meanwhile, the queue of candidate rankers the team wants to test keeps on growing. Running experiments becomes the bottleneck, and iteration gets slow.
In marketplaces, it gets even worse. When users compete for limited supply, like appointment slots or hotel rooms, users who see ranker B can book supply that users who see ranker A would otherwise have booked. That's a SUTVA violation, and it biases the comparison between the groups. The usual fix is to randomize whole regions or time periods instead of users. That leaves far fewer units to compare, so a ranker test that already took weeks with user randomization becomes infeasible.
Offline evaluation is the usual workaround, but it's a poor predictor of which rankers will win in an experiment.¹ Interleaving fills the gap between offline evaluation and standard experiments. Instead of showing ranker A to one group of users and ranker B to another, you merge both rankers' results into one list and show it to everyone. Then you check whose items people picked. Companies that run interleaving report needing a small fraction of the traffic a standard experiment needs: under 1% at Netflix, about 1.5% at DoorDash, about 1.7% at Amazon and about 2% at Airbnb. A ranker test that would take a month can reach a decision in a day or two. The decisions mostly hold up, too. When Airbnb compared 29 interleaving results with standard experiments on the same rankers, 82% picked the same winner. Interleaving answers a narrower question than a standard experiment, but it predicts the winner much better than offline evaluation does.
Interleaving also avoids the marketplace problem. Both rankers face the same supply at every search, so the comparison between their items stays unbiased.
In this post, we explain how this experiment type works. We walk through how two rankers' lists are merged into one, the two ways to turn clicks and orders into a winner, and why the method needs so little traffic. We briefly touch on the limitations and how it compares with a standard experiment.
How are the two lists merged and served?
As an example, take a food delivery app with a "Recommended for you" list. Ranker A is the one in production, putting a lot of weight on the cuisine the user orders most often. For this user, it ranks the best sushi places nearby at the top. Ranker B is a candidate. It mixes in other cuisines, like a pizza place. On most days, this user is looking for sushi, but on some days they might go for pizza. Now, which ranker is better?
The way GrowthBook merges two lists is called team-draft interleaving, which Netflix, Airbnb and DoorDash also use.² It works like two team captains picking players. In every round, each ranker picks its highest item that isn't in the interleaved list yet. A coin flip determines which ranker's pick goes in first. Behind the scenes, you track which ranker put what item on the list. The user has no way of telling there are different rankers at play, or that there is even an experiment going on.
There is one special case. If both rankers want the same item in the same round, it goes in once and belongs to neither ranker. That's what happens to Kaito Sushi in round 1, since it's at the top of both lists. An item both rankers want at the same position can't tell you which ranker is better, so a click on it counts for neither. Without this rule, the coin flip would give the item to one of them, and clicks on it would only add noise to the comparison. Like Airbnb and DoorDash, GrowthBook leaves these items out of the analysis. We call the items that belong to a ranker competitive, and the ones that belong to neither non-competitive.

In round 2, A wins the coin flip and picks Umi Sushi. B then picks Hana Sushi Bar, its highest item that isn't taken yet. When a ranker picks an item that exists in the other ranker's list further down, that item is crossed out in the illustration to show that it can no longer be picked.
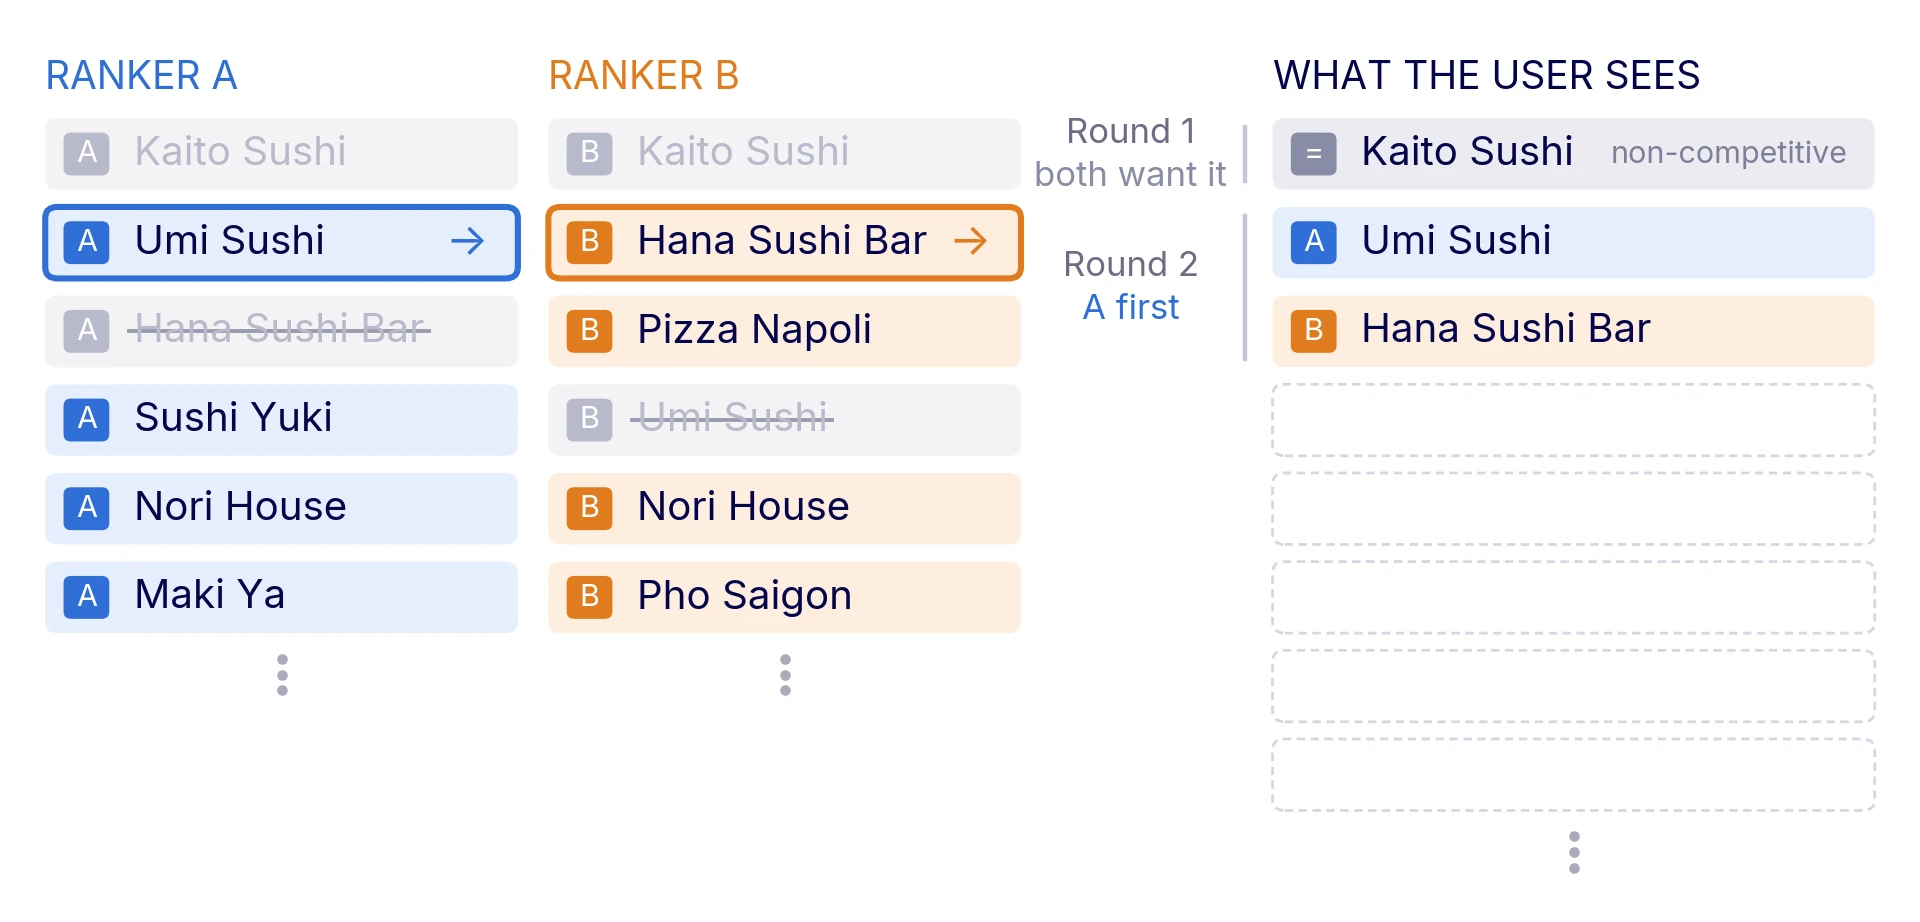
In round 3, B picks first and takes Pizza Napoli. A's next item would be Hana Sushi Bar, but since B already picked it, A picks Sushi Yuki instead.

The draft continues like this. In round 4, both rankers want Nori House, so it goes in as non-competitive, just like Kaito Sushi did at the top. Round 5 is an ordinary round again, with a coin flip determining the order. These are the first eight restaurants the user sees. The draft continues the same way further down, until the lists run out. If one ranker runs out of items before the other, the rest of the list is filled from the other ranker's list, and those items are non-competitive.
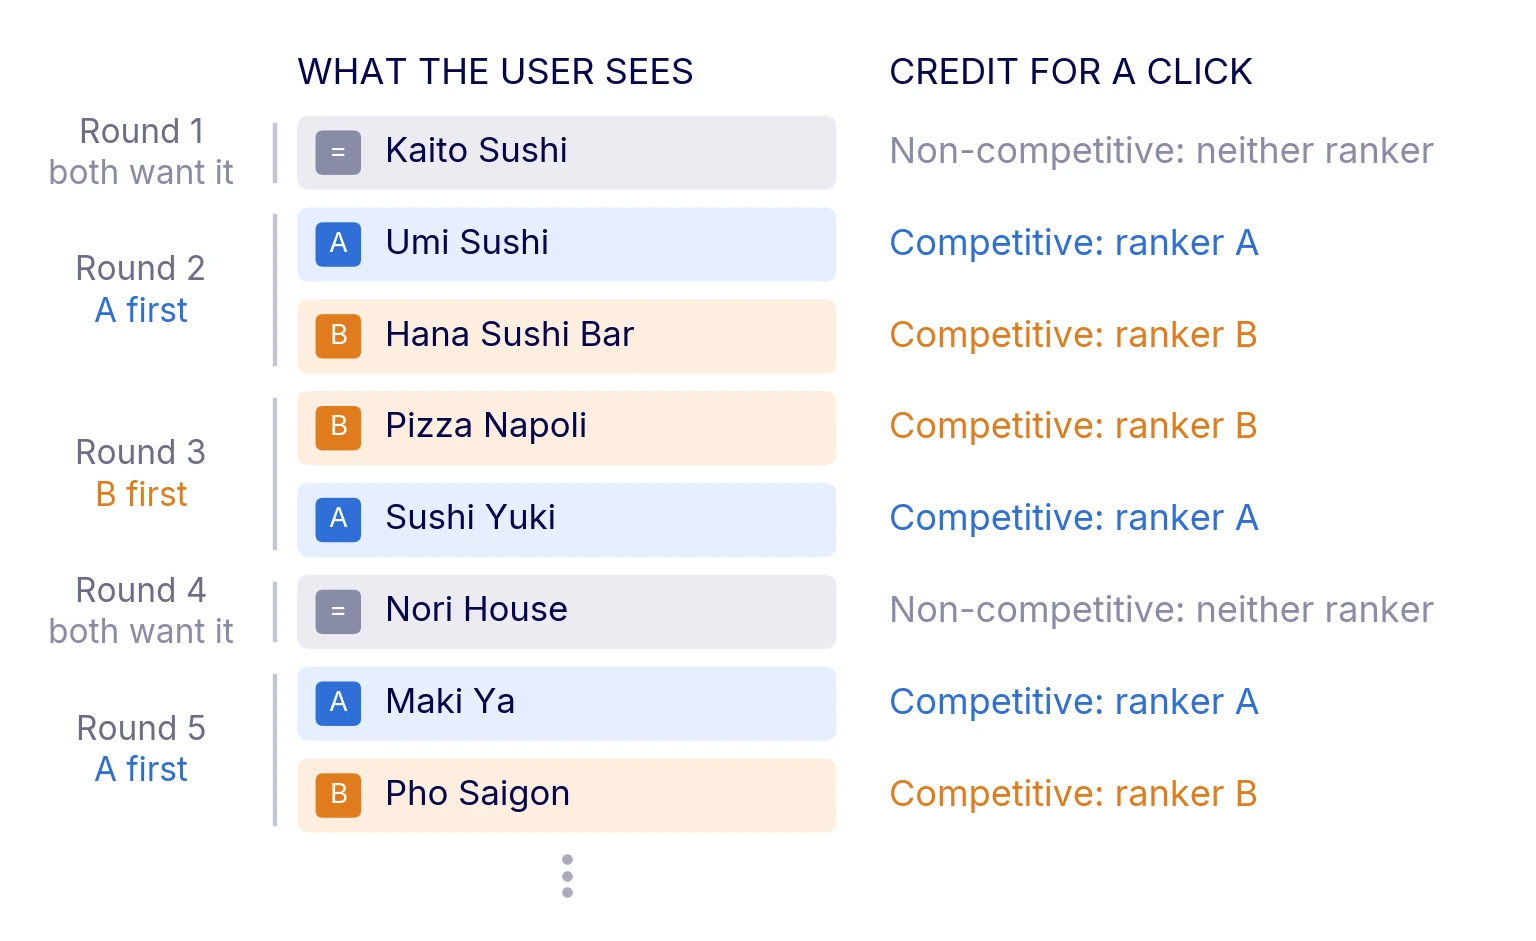
Two properties make the comparison fair. First, every round with a competitive pick gives each ranker exactly one item, so both rankers get the same number of competitive items. Second, since a coin flip decides who picks first, neither ranker gets the higher position of the pair more often than the other. That matters because people click items near the top of a list more often.
On the practical side, interleaving means getting results from both rankers every time the list is shown, and then merging them. The merge itself adds essentially no latency. The only delay comes from waiting for both rankers, so the list is only as fast as the slower one. If the rankings are computed ahead of time, there's no extra delay at all.
Finally, log the interleaved list and, for every position, which ranker the item belongs to. That's a bit more data than usual. However, you can't credit a click to a ranker without it, and it's hard to reconstruct afterwards.
How do you pick a winner?
The merge decides what the user sees. A separate rule decides what counts in each ranker's favor in your analysis. Linking an outcome, like a click or an order, to an item, and thereby to the ranker that picked it, is called attribution. What the ranker receives is credit. A click on a non-competitive item, like Kaito Sushi or Nori House, gives no credit. A click on a competitive item gives one credit to the ranker that picked it.
There are two ways to turn credits into a result. Paired analysis compares the two rankers within each merged list a user sees. User preference analysis adds up each user's credits over the whole experiment and asks which ranker that user preferred. GrowthBook supports both, and most teams benefit from running both on different outcomes.
Paired analysis: the most power
Paired analysis works when it makes sense to link an outcome directly to the single merged list where it happened. That works well for immediate engagement, like a click or an add-to-cart, and for an order, which counts for the last list the user saw before it. Each such engagement gives the ranker behind the item a credit, and you count A's credits and B's credits in that list. Suppose that the user clicks Hana Sushi Bar. In that list, B gets one credit and A gets none. If the user doesn't engage with any competitive item, the list is left out of the analysis.
Each list gives one paired comparison between the rankers, and a user sees many lists during an experiment. The test checks whether B gets more credits per list than A, by more than chance can explain. The result tells you how much more engagement B gets per list than A. The outcome can also be a number, like the order value, as long as it belongs to a single item in the list.
This is where most of interleaving's speed comes from. We recommend tracking at least one immediate engagement metric in every interleaving experiment.
User preference analysis: one vote per user
User preference analysis gives each user one vote over the whole experiment. The vote goes to the ranker that got more credit from that user. A user who gave both rankers equal credit, or none at all, drops out of the comparison. The test then compares the share of votes for B with 50%. If it's further from 50% than chance can explain, the ranker with more votes wins. Counting one vote per user also keeps a few very active users from deciding the result.
There are several rules for how a user's credit is counted. This one is useful for outcomes that happen after several visits. Suppose that a user opens the app at midday, again in the afternoon and once more at dinner time, when they order from Umi Sushi. You can't link that order to only one list, so the credit goes to whichever ranker picked Umi Sushi in each list. If B picked it twice and A once, B gets two credits and A one, so the user votes for B. This is the rule GrowthBook uses, and Airbnb's is similar: it credits a booking to every search that showed the listing, not only the one the booking came from. Other rules are possible, like counting each user's clicks, and GrowthBook may add them later. The best rule for your setting depends on how your users browse and decide, which we cover in the follow-up post.
User preference analysis has less power than paired analysis. The advantage is that it's more relevant to your organization when users come back several times before deciding. Which one you depend on for decisions is a trade-off between power and relevance of the signal.
Why does interleaving need so little traffic?
First, in a standard experiment, one group of users sees ranker A and another group sees ranker B. Users differ a lot. Some order every day, others once a month, and some always order sushi. That variation between users is noise, and averaging it away takes many users. In interleaving, every user sees both rankers in the same list. So the comparison happens within each user, and the differences between users cancel out.
Second, only the positions where the rankers disagree count. Both rankers want Kaito Sushi and Nori House in the same round, so clicks on them are ignored. Those clicks can't favor either ranker, so they would only add noise. It's the same idea as triggering, or using an activation metric in a standard experiment, where you only analyze users who could have seen the change. At Bing, ignoring clicks on the top results both rankers shared meant the test needed only about 40% of the data it needed otherwise (Chapelle et al., 2012).
The third reason depends on how people use the list. Most users don't scroll down the full list. They scan from the top and stop once they find something good. Suppose the first good restaurant the user sees is one of A's picks. They click it and never reach B's pick further down. So the better ranker doesn't only gain a click. It also takes the click away from the worse ranker, and thus widens the difference between them. Iizuka, Morita and Kato (2023) show this formally. In their model, if users explore the full list without early stopping, interleaving has no advantage over a standard experiment at all. So a surface where people scroll the whole list either way, or compare every option before choosing, gains little.
Together, these three reasons explain why the companies in the intro needed 2% of a standard experiment's traffic, or less.
Where does this leave you?
Interleaving answers a narrower question than a standard experiment. It tells you which ranker's items users picked more often, not how much your key outcomes would change if you shipped the winner. Every user sees the interleaved list and never one ranker on its own, so behavior after shipping can differ. In a marketplace, interleaving also can't show how supply changes once you ship B. For example, B might send most bookings to a few providers until their slots fill up. And outcomes that belong to a user rather than an item, like retention, can only be credited loosely.
In the follow-up post, we go through which analysis fits how your users decide, including outcomes that build up over several visits. We also cover what can make interleaving and a standard experiment disagree, and how much you can rely on its verdict.
The key reason to run interleaving experiments is speed. Every user sees both rankers, so the differences between users cancel out. And only the items where the rankers disagree count. That means you can test many more ranker ideas in the time one standard experiment takes. The most promising ones then go on to a standard experiment. Check out how to set yours up.
Join the interleaving beta
Interleaving is in private beta for GrowthBook Enterprise customers. Book a demo to talk with our team about testing your rankers.
Book a Demo
¹ In 23 comparisons at Booking.com, each new model against the one it replaced, the gain in offline performance showed no clear correlation with the gain in the business metric (Pearson correlation −0.1) (Bernardi et al., 2019). The authors note that all the models targeted the same metric, and that they found the same pattern elsewhere at Booking.com.
² An older method, balanced interleaving, also alternates between the two lists but doesn't record which ranker placed each item. So it has to credit clicks in a different way, and that can favor one ranker when the two lists are very similar. Amazon uses a corrected version of balanced interleaving.


Related articles



Ready to ship faster?
No credit card required. Start with feature flags, experimentation, and product analytics — free.